The Relative Rotation Graph™ below shows the relative position and movement of international equity markets against the FTSE All World index.
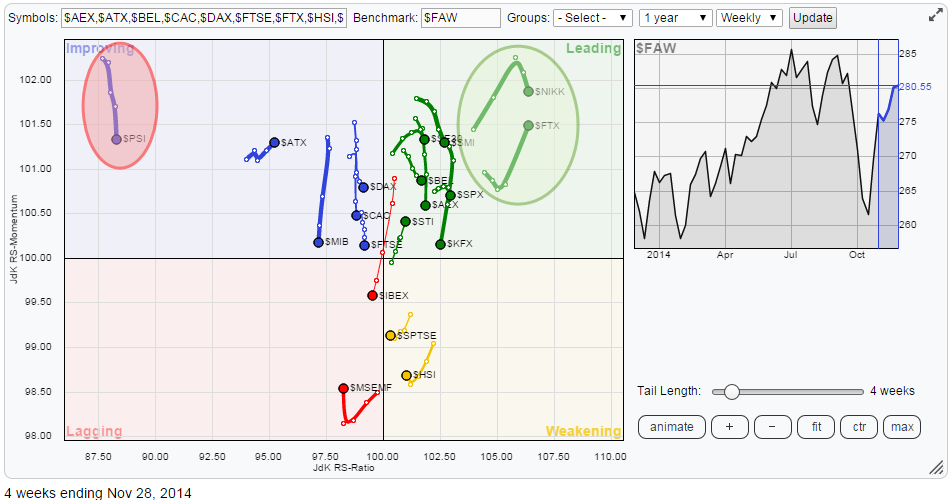
At one glance we can immediately see which markets deserve our attention. THAT is the big advantage of RRG™ Charts.
In this case it is $PSI, the Portuguese equity market inside the red shaded area in the improving quadrant, which is by far the weakest market in terms of relative strength. And on the right hand side of the plot in the leading quadrant we can see $NIKK and $FTX the Japanese and Chinese markets standing out positively.
Portugal
When I look at an RRG like the one above and I see such an outlier like Portugal in this case I immediately question myself: "wow, how would that look on a price chart?" Working on the StockCharts platform, that is just one click away. In the table below the RRG in front of each ticker symbol there is a small candle charting icon. Click on that icon and your default chart will open up for that particular ticker. I prefer to right-click and open the chart in a new tab, which enables me to go back and forth between the RRG and the price chart on two different tabs without having to reload them every time.
For $PSI that gives me the chart below.
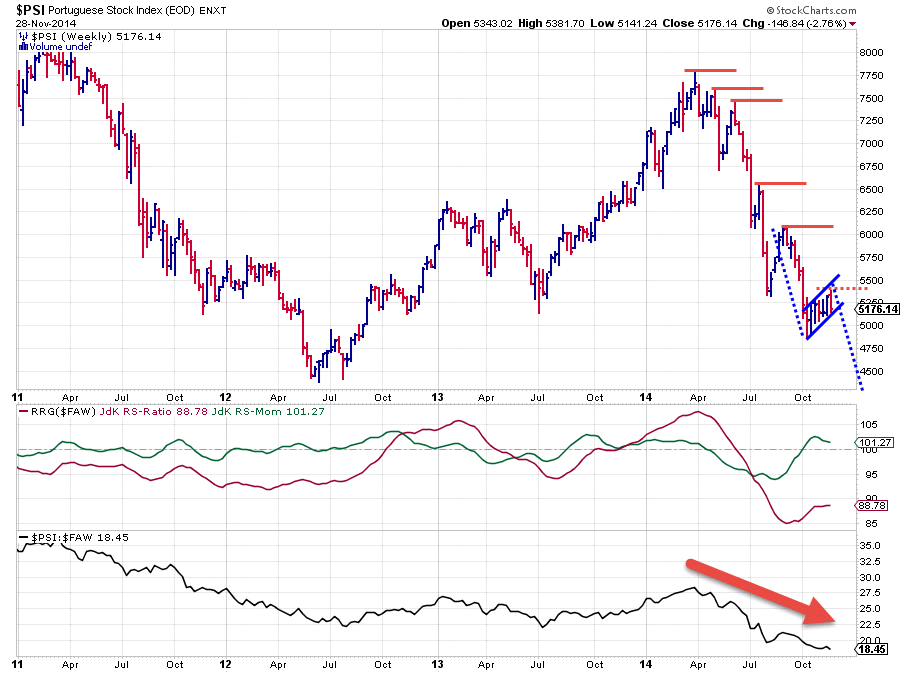
Let's just conclude that the price pattern off the high back in April of this year does not really look like a "random-walk" :) A strong series of lower highs followed by lower lows are characterizing this down-trend. And I cannot see any reason why this would stop any time soon.
The recent rally can clearly be judged as a recovery within the down-trend and this recovery looks to be shaping up like a flag-pattern. These flags are usually continuation patterns that occur halfway in a move. This makes it possible to come up with a "guess-timate" of a potential price-target in case of a downward break out of the pattern.
Such a breakout occurs when the lower rising trend-line (blue) will give way. In that case the price target can be pegged at the end of the lower dashed blue line, which more or less coincides with the June-July lows of 2012. Still a very decent decline!
Please note that I have used a very conservative way of measuring the price target, from the TOP of the flag pattern and not from the breakout level. The more aggressive measuring would point clearly below the 2012 lows which would mean another very significant downward break for this market ...
With headlines all over the news that equity markets are marching to new highs and shouting that 2014 was a very good year for equities so far, it is not surprising that Portugal's relative strength is strongly pointing down. Because all these headlines are NOT talking about Portuguese stocks ... that's for sure.
The JdK RS-Ratio line is way below the 100-level, and JdK RS Momentum has already peaked above it and is coming down again. The small rally inside the flag pattern has caused a little recovery in relative momentum resulting in an upward rotation into the improving quadrant on the RRG chart, but relative strength (RS-Ratio) is still so weak that a rotation on the left hand side back towards and into the lagging quadrant is more than likely.
From a relative as well as a price point of view this is still qualified as a very dangerous and weak market with a lot of downward risk.
Japan
How different a chart can look over the same historical period is illustrated in the chart of the Japanese Nikkei index printed below.
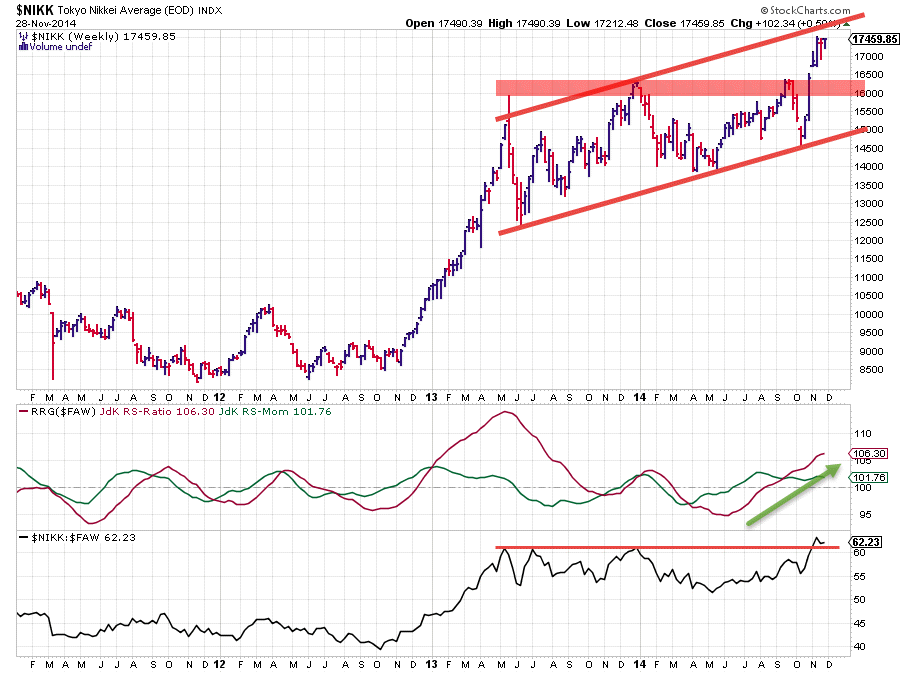
For almost two years the area between 16.000 and 16.500 served as a steel barrier of resistance above the market. Three serious attempts to break beyond that level have taken place and three have failed.... until recently.
The fact that the lows which were formed after every attempt to break higher came in at subsequent higher levels indicates that buyers were willing to get back into the market at higher prices after each drop. The buying power behind the recent rally that pushed the Nikkei index through the 16-16.500 resistance zone was too much for the sellers who had been keeping the market under pressure and they surrendered. The lack of selling pressure after the break even caused a nice 'break away' gap on the chart which is another sign of strength.
The relative picture for Japan looks equally nice. The raw RS line (lower pane) also broke above an important horizontal resistance level which suggests new fuel for a continuation of the relative rally.
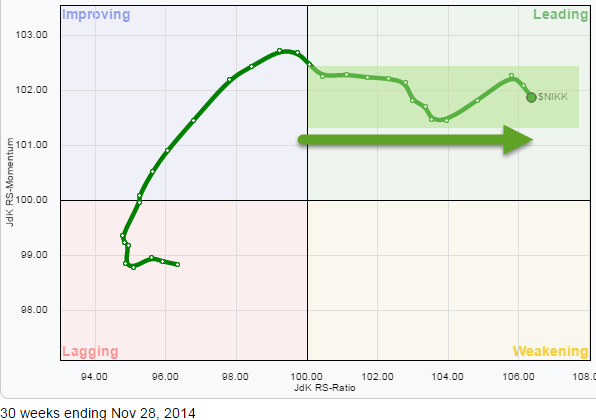
On the RRG-Lines chart (middle) the JdK RS-Ratio already picked up the rising trend in relative strength somewhere in August with a very steady horizontal slope for the JdK RS-Momentum line. This type of constellation of the RRG Lines results in a tail on the RRG chart that moves more or less horizontally on the RS-Momentum axis but steadily higher on the RS-Ratio axis. See the RRG chart below. Very nice!
 So, all good on the Eastern front so far but we should not let ourselves be fooled by the price action that we see on our chart-screens.
Especially because what is NOT on your screen could ruin you.
If you run a long-term chart for the NKY index you will immediately see that fairly soon the index will hit a very important resistance level around 18.000.
This means that Japan is a very strong market at the moment, both from a price and a relative perspective. That we should keep an eye on the 18.000 area for resistance that could, temporarily, cap the rally in the Nikkei index. But once broken there will very likely be much much more upside potential for Japanese equities.
Clearly the former resistance area between 16-16.500 will now start to act as support.
China
The second market that drew our attention inside the green shaded area on the RRG chart was China, and for good reasons as the chart below will show us.
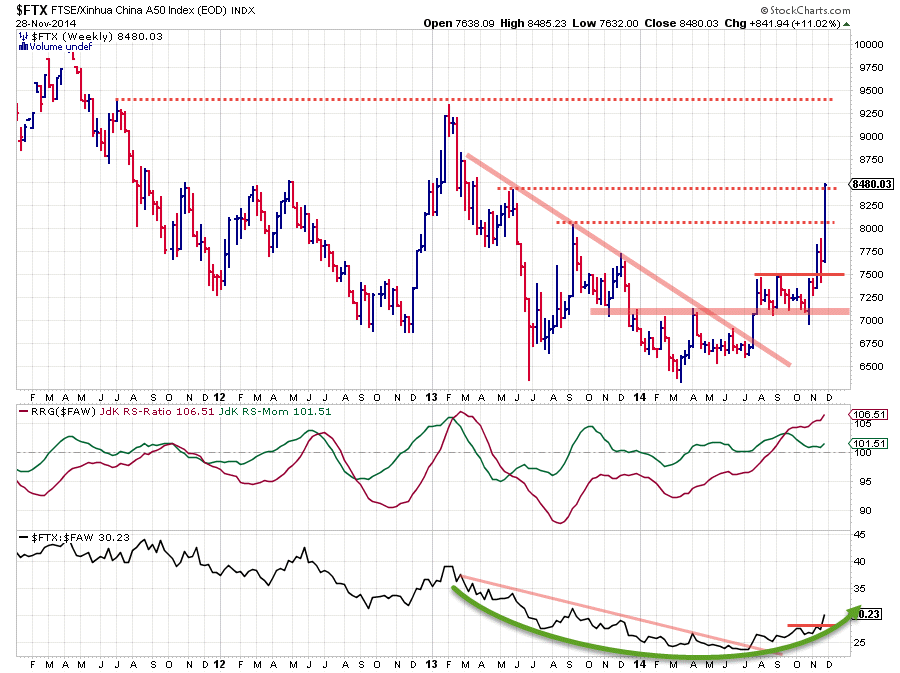
From a technical point of view, a lot has happened on the $FTX chart this year.
In March $FTX found support at the level of the 2013 low, after an initial rally which was capped by horizontal resistance, just above 7000, a first new higher low was set. Then in July-August the long-term falling resistance line was broken and subsequently the resistance near 7000 gave way and after a few months of sideways trading between 7000-7500 the latter resistance level was also broken and China started to take off, breaching some intermediate resistance levels with ease.
The relative picture is going through similar phases of improvement as annotated on the chart. In July-August the falling trend-line in the raw RS-chart was broken and the JdK RS-Ratio picked up the new relative up-trend. Recently a small decline in RS-Momentum was visible but that seems to be coming to an end as the JdK RS-Momentum line looks to be bottoming out above the 100-level setting the stage for a new jump in relative performance of the Chinese market over the FTSE All World index.
Conclusion
- Portugal remains a very dangerous market with a lot of downward risk
- Japan looks to be continuing its rally on both the price and relative charts but could get into some trouble near 18.000
- China is breaking resistance levels with ease and is getting ready for a new jump in relative strength
Note: Please note that I have have used a universe of international indexes each quoted in their local currency to avoid the currency effect on the relative rotation which occurs when running these analyses on ETFs. Investors can obviously use these country ETFs (often quoted in US dollars) to create exposure to international markets. The decision to hedge or not to hedge the FX component will then become a seperate decision!
Julius de Kempenaer | RRG research


