Below is the Relative Rotation Graph holding the 30 stocks that make up the Dow Jones Industrials index.
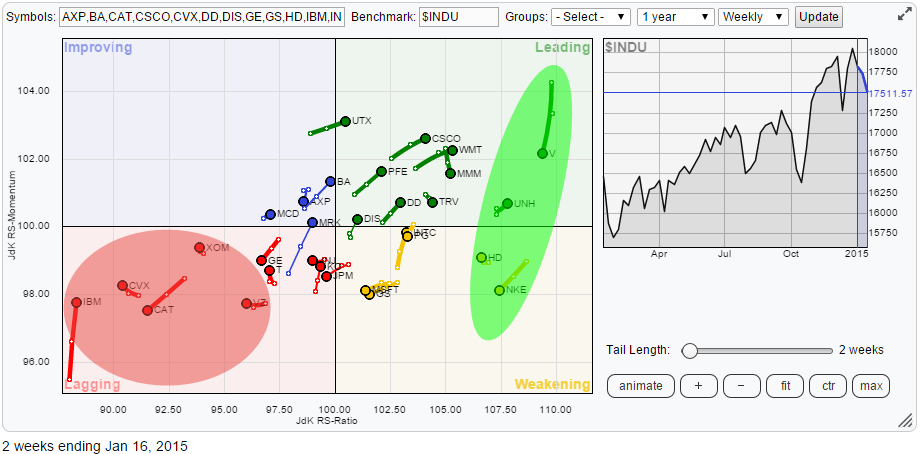
When I start analysing a universe like this I always start to look at what's going on on the outskirts of the RRG. In this case they are the names inside the shaded areas. Green on the positive side and Red on the negative side. These are the stocks that are in a mature relative up- or down-trend against the Industrials index. Basically the stuff that you want to hold in your portfolio already and the stuff that you should have gotten rid of a while ago. If you want, you can quickly browse through those charts for a confirming visual inspection of the price chart but if you are tracking a specific universe for a while there is probably no need for that as you will already know how these charts look.
On the StockCharts.com platform you can easily do that by going into the table below the RRG and clicking the chart icon to bring up the price chart of that security. I have made it a routine to right-click that icon and choose open-in-new-tab. This keeps my RRG intact and opens up the price chart with my default layout (for that universe) in another tab and I can flip back and forth between the two and connect what I see on the RRG to the price action.
As having all 30 names on one RRG makes a pretty crowded picture I usually want to drill down into the universe a little deeper and get my focus on opportunities or warnings that are sent by the relative movement of the securities against the index.
In order to do that I check off the boxes in front of the names that are inside the shaded areas. In this case these are V, UNH, HD and NKE in the green shaded area. They are all in solid (relative) up-trends and even the two that are inside the weakening quadrant are still at very high JdK RS-Ratio levels which makes them less vulnerable for a turn down.
On the other side, the negative relative trends, the stocks are IBM, CVX, CAT, XOM and VZ. They are all in mature (relative) down-trends with no signs for improvement in sight, so I will leave them where they are for the time being.
Once the check-boxes are ticked off click on the "fit" button in the control area and tadaaaa........ magically the chart all of a sudden looks a lot more readable!
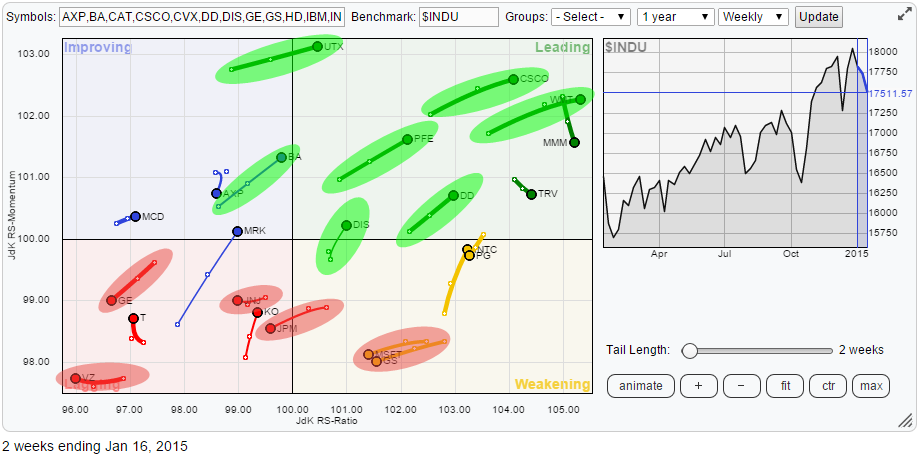
What I am looking for are stocks that are moving in the same direction on both axes. So for potential longs or overweights I would like to see increasing values on both the JdK RS-Ratio AND the JdK RS-Momentum axes; this means that the stock is improving its relative strength against the benchmark and that improvement is backed by positive relative momentum. These names I have shaded in green for further inspection.
For potential shorts or under-weights or sells when they are held in a portfolio I am scanning for stocks that go down on both axes. This means that the stock is in a relative down-trend AND that trend is being pushed further down by negative momentum.
This gives a sub-set that deserves further attention. And that 'further inspection' can really fit anyone's regular work-flow. If you are used to using a bunch of indicators to make up your mind, go ahead. If you are an EW analyst use your positive counts on the names in the green shades and your negative counts on the names in the red shades. Personally I like the simple, primarily price based, approach and look for trends, patterns and breakouts. But really there is no right or wrong here.
While scanning the charts I picked two weaker ones and two stronger ones to have a closer look at.
General Electric Co. (GE)
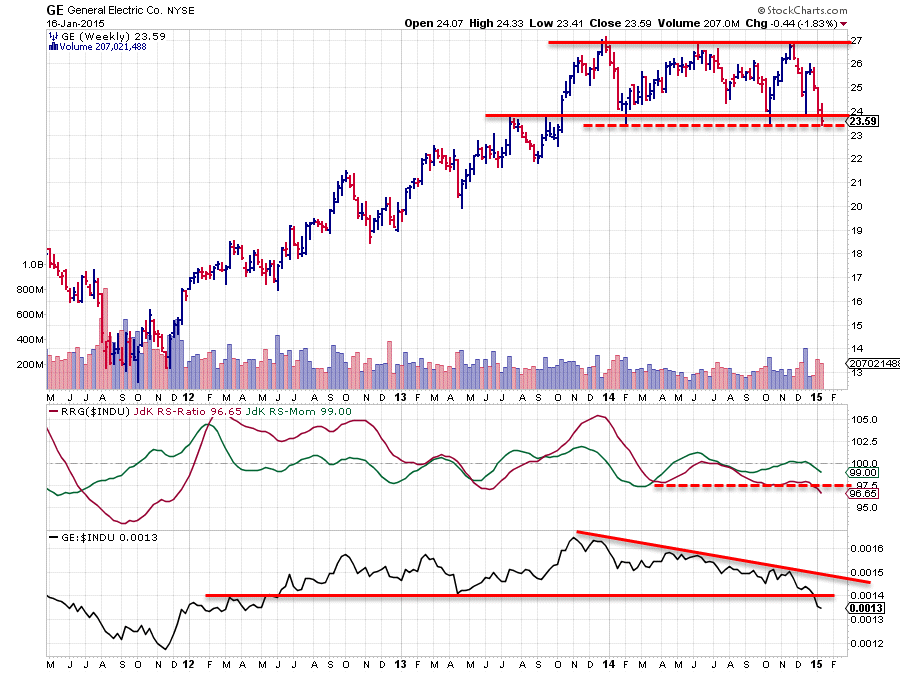
The GE chart is characterized by a broad trading range (24-27) during, pretty much, all of 2014. At the moment price is threatening the lower boundary of this range and, depending how you draw your horizontal support, has already broken it. The solid red support line connects two previous highs and the price 'clusters' of the 2014 lows, which I think is the preferred way as that is where real demand kicked in at the time. The dashed line connects the extreme lows which i like to see as 'ultimate' support levels. A break below these lows will be a confirmation of the weak signal already given by the break of the solid support line at last Fridays close.
An inspection of the relative strength against the Industrials index via the RRG-Lines and the raw RS-line does not do much better. The JdK RS-Ratio line has been moving below the 100-level already since the beginning of 2014. The recent hiccup in price within the boundaries of the trading range has caused a little improvement of relative momentum but this is now also starting to wane again and pushing the RS-Ratio line below its previous low and to the lowest levels of the past three years. And a similar move we can see in the raw RS-line which is breaking important support.
With relative strength against the benchmark and price threatening to break out of a broad, and long lasting, trading range I'd be very careful with GE for the time being.
JP Morgan Chase Co (JPM)
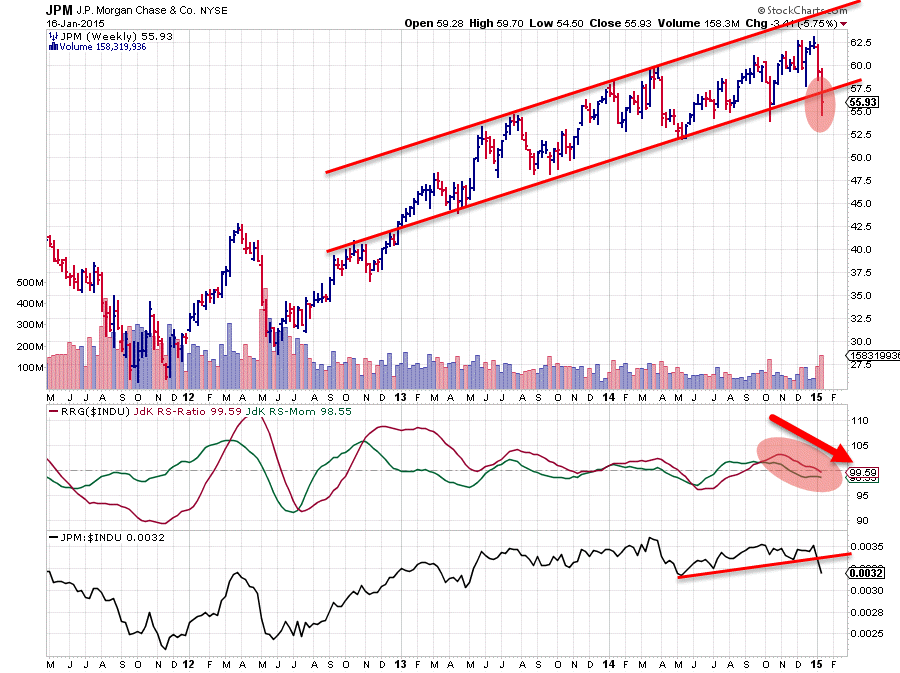
Contrary to GE, JP Morgan's chart is showing an up-trend since mid 2012. It has not been the most perfect up-trend but the sequence of higher highs and higher lows is clearly visible and a channel can be drawn connecting the major highs and the major lows of that trend. Last week the decline in price broke the rising support line triggering a sign of weakness. There are still two previous lows that could offer a support but it is not very strong and as a result of the downward break, the upside potential in price is now limited, as the previous low near 57.50 and the former rising support line will now start to act as resistance.
From a relative point of view things do not look much better. On the RRG Lines both the JdK RS-Ratio and the JdK RS-Momentum lines are heading lower and just caused JPM to cross over into the lagging quadrant. On the raw RS line the downward break of the slightly up-sloping support line confirms this weakness and signals (relative) weakness ahead for JPM against the Dow.
United Technologies Corp (UTX)
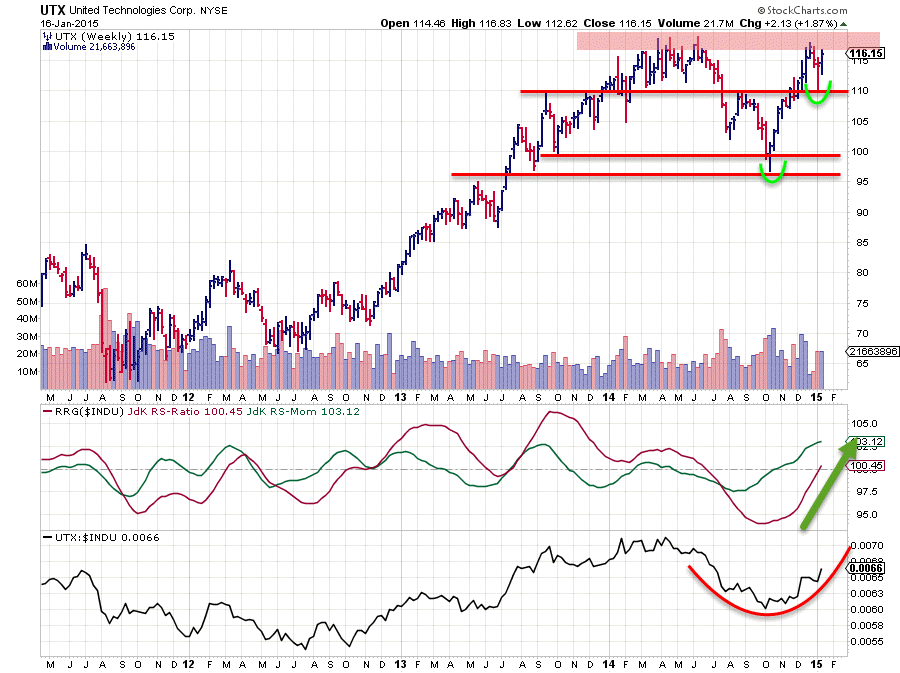
On the Relative Rotation Graph UTX really stands out. It is the stock with the highest JdK RS-Momentum and it is powering into the leading quadrant.
On the price chart it is immediately clear that there is heavy resistance overhead in the 115-120 area which will have to be cleared first before any new upward price potential will be unlocked. Therefore I start this one from a relative perspective.
In the pane holding the RRG-Lines it is visible that the JdK RS-Momentum line crossed above 100 sometime in October of last year. This caused UTX to enter the improving quadrant on the RRG chart and it managed to continue its positive rotation and work its way through the improving quadrant and cross into leading at last week's close. The raw RS-line shows a nice turnaround and definitely changed direction to the upside. Hence from a relative perspective I expect further out-performance versus the Dow Jones Industrials.
However, as said above, on the price chart UTX is facing some serious resistance. It is very clear that if 120 can be taken out to the upside there will be much more upside potential for this stock. Backing a positive scenario is the fact that the recent decline seems to have put in a low at 110 again, a level we have seen coming into play a number of times over the past year and a half. This can also be seen as the start of a new series of higher highs and higher lows. The proof will be in the pudding and definitely a confirmation of the up-trend when the next leg up will be able to break 120 and accelerate higher.
Walt Disney Co. (DIS)
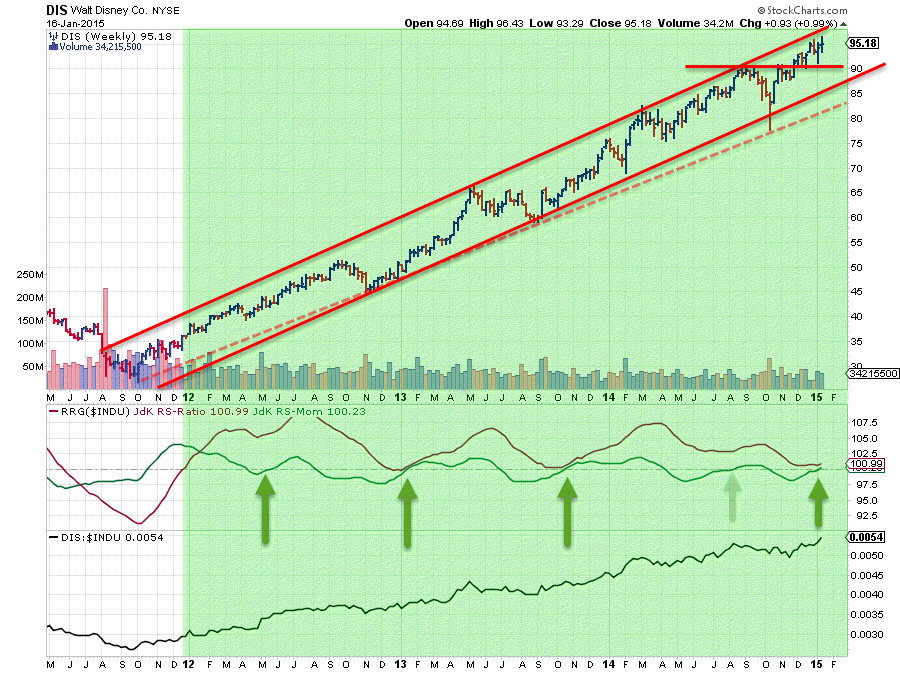
What can I say ....?
If you're ever at a birthday party and run into an economist who tries to convince you that markets are a 'random walk' and that trend-analysis is therefore a futile effort as they can simply not exist then show him this chart and ask him to explain how this can happen if markets are indeed a random walk?
Then grab yourself a drink and enjoy the party as chances are high that Mr RW Economy will not bother you any more that night. :)
Now on a more serious note ... WOW! what a trend that is. On BOTH the price and the relative line. The series of higher highs and higher lows, contained inside a parallel channel, is still in full swing and recently once again broke above a previous high confirming its strength. On the relative line the picture is not much different!
If you look closer into the interaction of the JdK RS-Ratio and RS-Momentum lines the rotations from the leading quadrant into the weakening quadrant and then back into leading again can be seen well. The green arrows indicate points in time where momentum crawled back above 100 again after having fallen, temporarily, below it and pushing DIS into the weakening quadrant. At the arrows the rotation takes DIS back into leading. As we know that a rotation which takes place completely on the right hand side of the RRG-chart is the characteristic for a very strong relative trend, the crossings from weakening into leading are important to watch as they are new upward thrusts within an already rising relative trend. Apart from the arrow mid last year all three before that preluded another up-move in relative strength against the Dow.
We will still have to wait and see what happens on this particular occasion, but so far things look good (especially the break above resistance on the price chart) and this move definitely does NOT look like a Mickey Mouse rally to me!
Conclusion
- General Electric Co. (GE) :Relative down-trend under way, confirmation on price chart upon break below 23.50
- JP Morgan Chase Co. (JPM) : Breaking support on both price and relative charts. Looks to be heading lower on both.
- United Technologies Corp. (UTX) : Strong improvement in relative strength but needs to break overhead resistance near 120 for confirmation
- Walt Disney Co. (DIS) : Keep on truckin!
Julius de Kempenaer | RRG Research
RRG, Relative Rotation Graphs, JdK RS-Ratio and JdK RS-Momentum are registered TradeMarks by RRG Research


