In my first article of this year I talked about more developed markets improving versus Emerging Markets. In the past few weeks however I have been monitoring rotation in international equity markets with interest as I think we are at cross-roads with regard to some relationships in this universe.
Obviously the relationship between the US and Europe is monitored by a lot of investors and pretty much all of 2014 that was a pretty boring thing to do. The US was leading Europe, and a lot of other parts of the world, and that was it, full stop..... But maybe not any more?
Below I have created a Relative Rotation Graph holding the German DAX index, the European STOXX 600 index and the S&P 500 index and use the FTSE all world index as the benchmark.
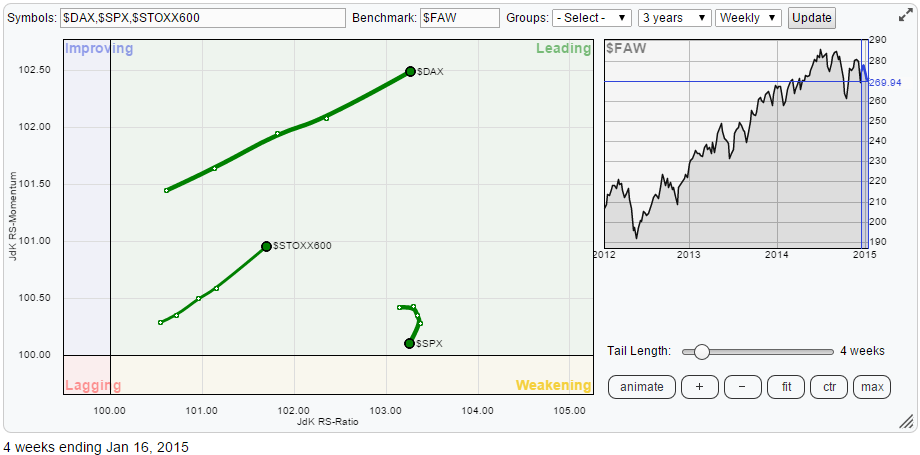
As you can see all three indices are comfortable moving inside the leading quadrant on the RRG but over the past few weeks things have started to change.
Very clearly the STOXX 600 index and especially the DAX index are powering ahead and gaining on both axes. The SPX on the other hand has started to turn around and, albeit slowly, lose on both axes.
Adding a few annotations helps to make a few observations straight off the RRG chart.
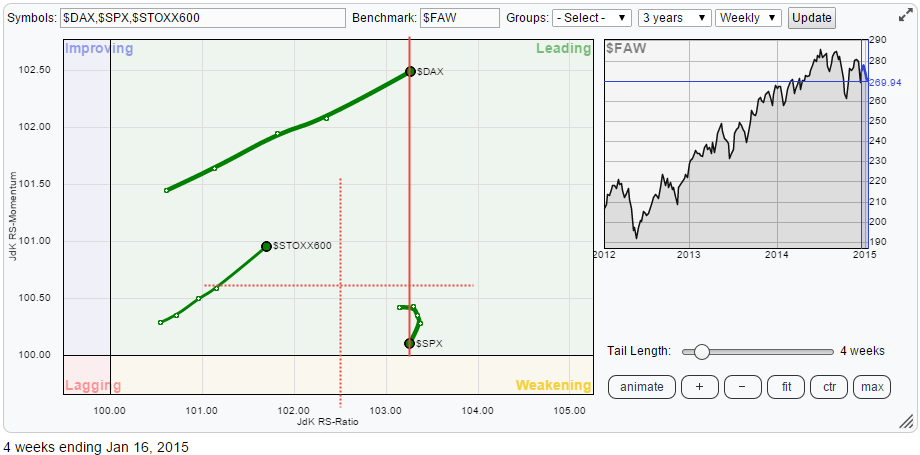
- The DAX is crossing over the S&P in relative strength terms at this moment. The solid vertical red line shows that bot indices are lining up on the JdK RS-Ratio axis with the DAX moving right and the SPX moving left. When plotted on a regular chart this will show a move of the JdK RS-Ratio line crossing above the 100-mark.
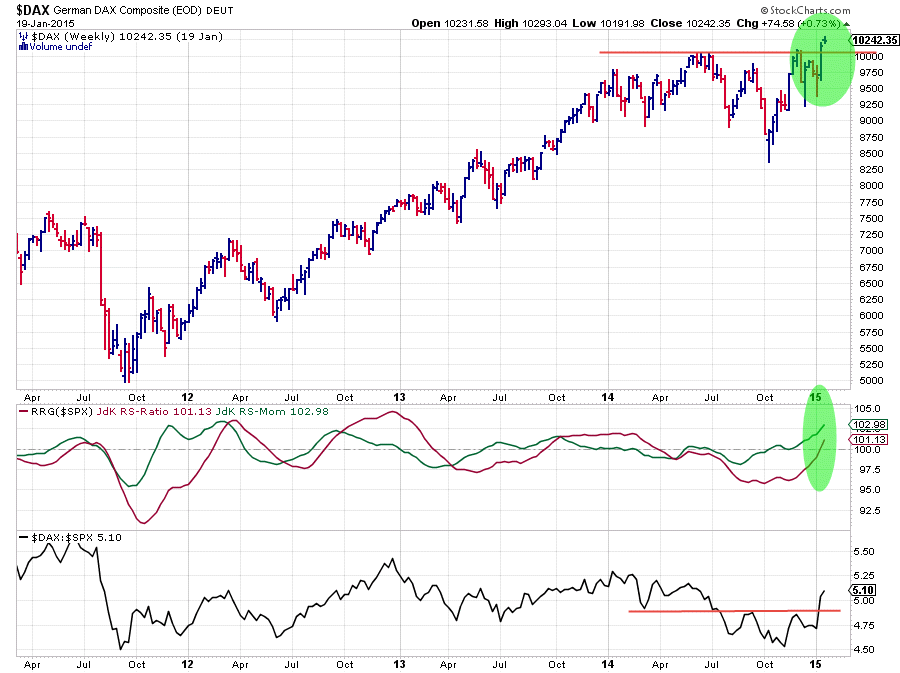
The break above the (heavy) horizontal resistance barrier will most likely add fuel to the upside and back the relative improvement. The completed H&S reversal pattern on the raw RS-line is beneficial and the price pattern on the bar-chart can be seen as an inverted H&S continuation pattern. They do not happen very often, but when they do ...
- If I draw an imaginary cross-hair between SPX and STOXX600 I can see a 'new' RRG in which the STOXX index is inside the improving quadrant and rapidly heading towards leading. The SPX is inside the weakening quadrant and moving towards lagging. On a regular price chart with RRG-lines that relationship looks like this:
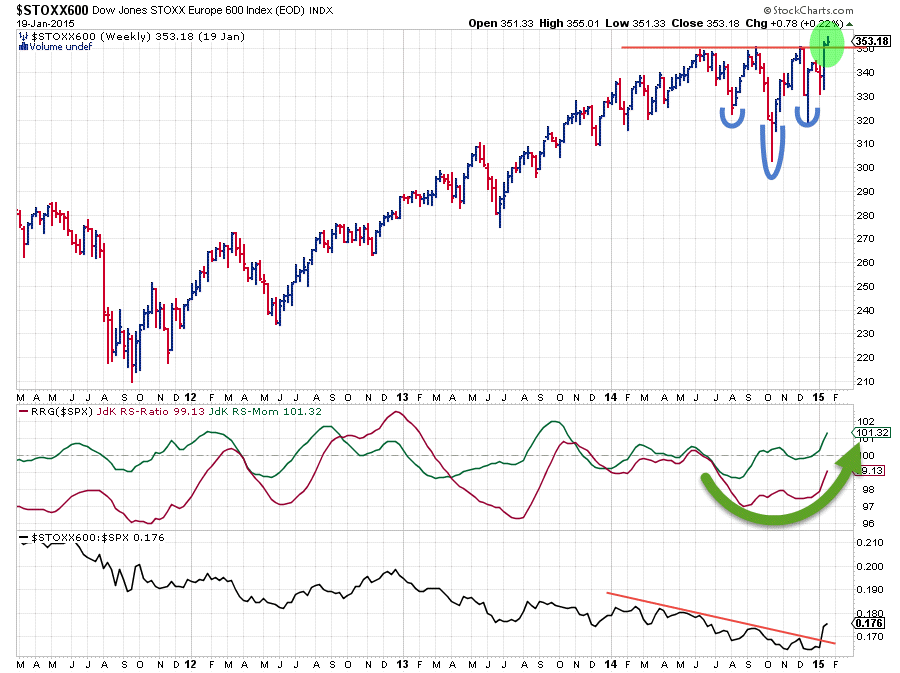
As you can see this 'turnaround' is in an earlier stage than the DAX-SPX relationship but undeniably relative strength is improving for Europe over the US. In the above STOXX chart the inverted H&S continuation pattern is much more pronounced and better visible than in the DAX chart but either way, and you do not even have to 'believe' in H&S patterns as continuation patterns, the upward break is powerful enough. The only caveat we need to make is that these are weekly charts that we're looking at and this week is not over yet. A Friday close above the break-out levels (neckline) will be the confirmation but so far things look pretty strong for Europe!
Julius de Kempenaer | RRG Research
RRG, Relative Rotation raphs, JdK RS-Ratio and JdK RS_Momentum are registered TradeMarks by RRG Research


