On the Relative Rotation Graph holding the 10 SPDR sector ETFs comparing them to the S&P 500 index there is one sector standing out .... big time that is!! I am talking about XLE here, the Energy select sector SPDR.
Initial observations
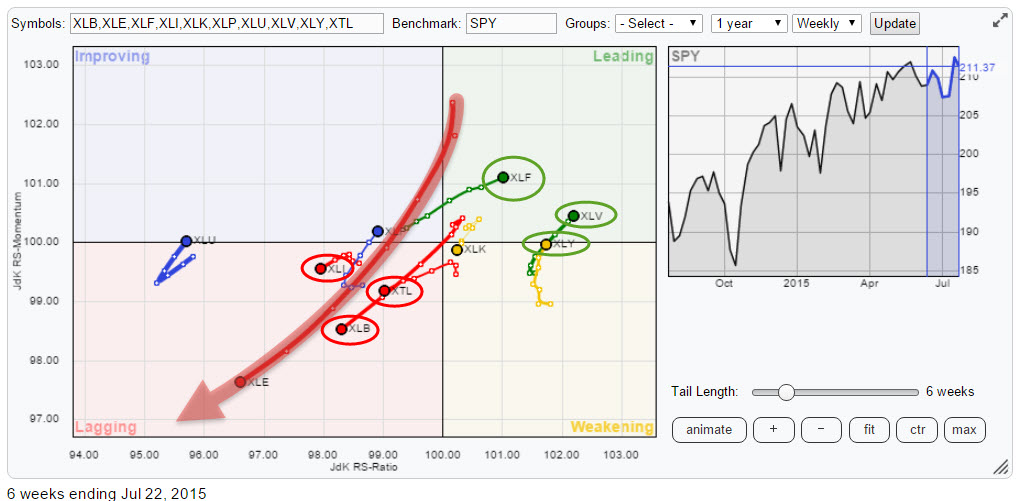
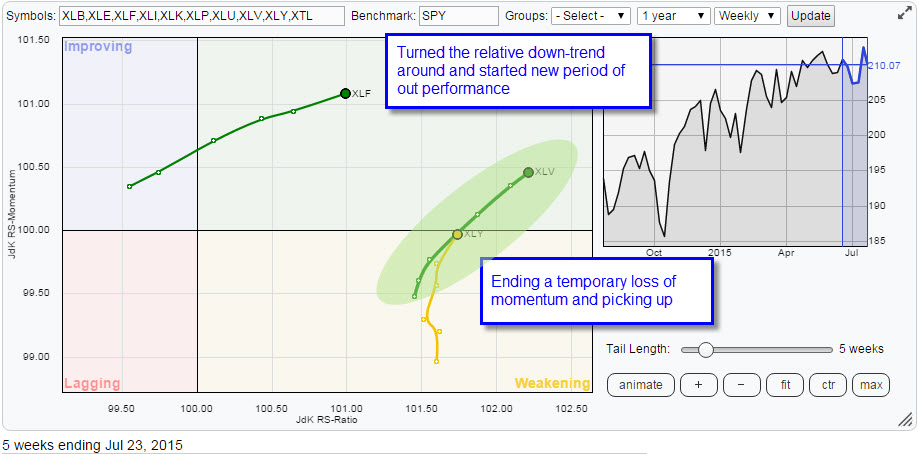
As you can see on the RRG it is the sector with, by far, the longest trail on the plot indicating that it has the strongest change in the strength of its relative trend. In six weeks time the sector moved from slightly inside the leading quadrant, at JdK RS-Momentum values above 102, to deep inside the lagging quadrant and is now still heading lower on both axes fast.
But there is more to see! As a matter of fact the S&P sector universe is nicely split into some clearly positive and some clearly negative (relative) trends.
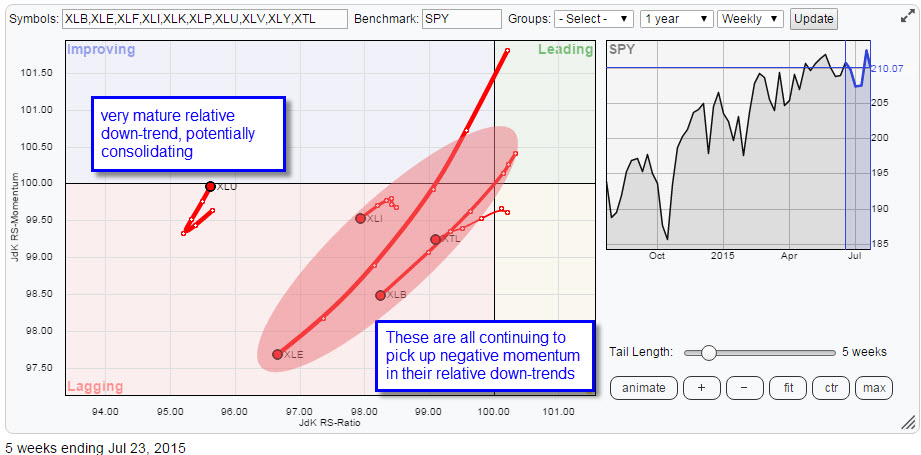
Together with XLE inside the lagging quadrant you will find XLI, XLB and XTL all showing a trail that is heading lower on both the JdK RS-Ratio and the JdK RS-Momentum axes. Also way on the left of the Relative Rotation Graph you will see XLU, the utilities sector. Its position on the RRG indicates that it has the weakest relative trend in this universe at this moment. However this does not mean that XLU will have the most negative potential going forward. It just signals a mature relative down-trend for this sector. Trying to call a relative low here is like trying to catch a falling knife as there are no signs that the trend has turned yet.
On the opposite side, in the leading quadrant you will see three sectors highlighted. These are XLF, XLV and XLY. They are all, almost, inside the leading quadrant and moving higher on both axes which suggests that their relative strength against the S&P 500 index is in an up-trend and still moving higher.
The lagging quadrant
XLE - Energy Select Sector SPDR
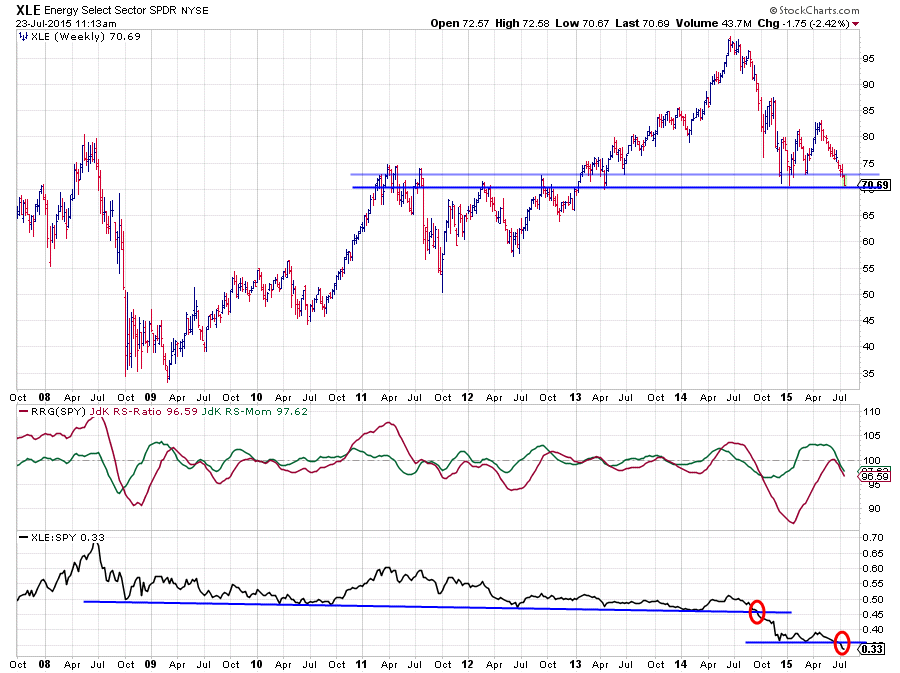
To get a better handle on the price moves of XLE I have plotted a long-term chart above, including the RRG lines and its raw relative strength.
What immediately stands out, at least for me but I'd love to hear your opinion, is the fact that XLE is currently resting at a very important support level near $ 70, going all the way back to the beginning of 2011 and with a little fantasy you could even say that the $ 70 area played a role in 2007-2008 as well. Without a doubt, some important market highs and lows have been formed around that $ 70 level in the past, most recently in the beginning of this year.
At the moment the market is putting that level to the test and given the speed of the recent decline it looks like that previous low does not stand a chance against current (negative) market momentum and will break anytime soon. The thing is; WHEN this happens a major level will be breached downward opening up the way for a lot more downside price action.
When we move to the relative strength sections you will find that on the raw RS chart the previous low has already been taken out to the downside. Pushing relative strength to the lowest level in 10 years. That in itself is already a pretty clear negative for XLE.
Inspection of the RRG-Lines learns that the recent rotation we have seen in XLE through the improving quadrant and just into the leading quadrant before things started to turn was a "recovery" move. With both the JdK RS-Ratio and the JdK RS-Momentum lines now below the 100-level and pointing down the relative down-trend seems to be back with a vengeance. When $ 70 gives way in the price chart as well we will very likely be facing (much) more weakness for XLE!
XLB - Materials Select Sector SPDR
One of the other sectors inside the lagging quadrant is Materials (XLB), the sector looked promising in the beginning of June but then made a sharp turn down later that month and that rotation accelerated into the lagging quadrant in the beginning of July.
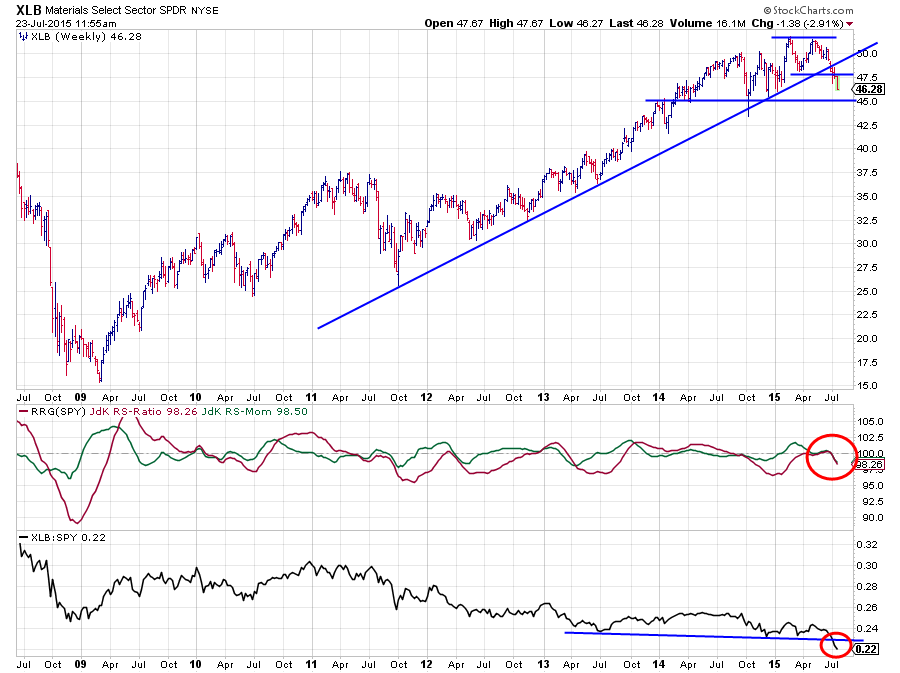
In this case also, a long-term chart provides the needed insight as to the importance of the (relative) moves we are seeing.
First on the price chart you can see that a long-term rising support line which has held up and caught all corrections since 2011 was broken downward a few weeks ago. But what I find even more interesting is the fact that the move that broke the rising support line also completed a double top pattern with the two highs set just below $ 52 in February and May of this year, and the in between low at $ 48 which makes a target calculation possible around $ 44. Looking at the chart I see $ 45 showing up as the next important support level for XLB which is close enough to our $ 44 target.
A break of this support level will very likely have serious implications for the subsequent price move as it opens up for more downside in price. Possible even towards levels as low as $ 37.50.
Just like we have seen in XLE, also in the case of XLB the relative strength charts are already ahead in triggering negative signals. The raw RS line has just dropped below its most recent low and pushed relative strength to multi-year lows. On the pane holding the RRG-Lines you can see that both lines (Ratio and Momentum) are almost overlapping each other. This translates into an almost perfect negative 45 degree angle or (225 degrees) pointing XLB deeper into the lagging quadrant.
The leading quadrant
XLF - Financials Select Sector SPDR
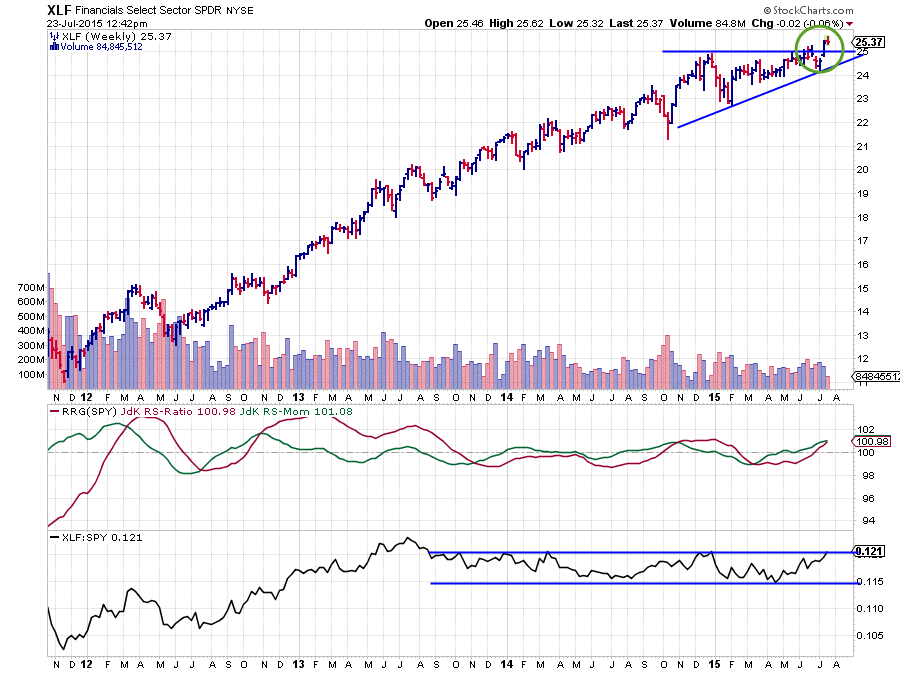
In the previous edition of the RRG blog on US sectors the financials sector already made the cut as being potentially interesting.
At that time price was still below the horizontal resistance line that runs over the price peaks since the beginning of this year. As you can see on the chart above this barrier has now given way at the end of last week and is holding up well so far.
This means that the old resistance level around $ 25 can now be expected to start offering support in case of corrections or pull-backs which can be used as new buying opportunities. Based on the ascending triangle pattern a price target can be pegged around $ 27.50 which means just shy of 10% upside potential in terms of price.
A note of caution here as the $27.50 level co-incides with some highs and lows back in 2006 and 2007 which could come in as resistance again.
Moving on to the relative strength of XLF against SPY we can see in the raw RS-chart that the trading range of the past two years is still intact but that RS has reached the upper boundary and is still on the go and likely to break above the late 2014 high. Such a break will very likely unlock new upward potential for the relative strength of XLF/SPY.
The RRG Lines are already suggesting that an up trend is underway as both the JdK RS-Ratio line and the JdK RS-Momentum line are moving higher while above the 100-mark which puts the Financials sector comfortably inside the leading quadrant.
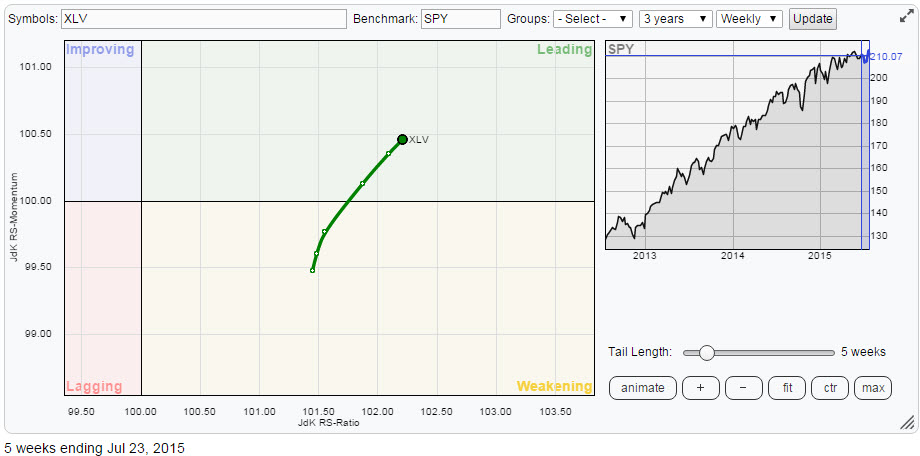
XLV - Health Care Select Sector SPDR
The Health Care sector is probably the most boring sector of the past 3 years to write about...
It's going up and it's outperforming the broader market... next please ....
I am not going to recap all that has been said about how strong this sector has been and still is. But what I do want to share with you is the RRG below that holds only XLV in comparison to SPY. If you click the picture the live RRG will open and you can click the animate button to play the rotation over the past three years. Watch the rotations taking place almost exclusively on the right hand side of the graph, with only a short intermezzo in 2014 ... Do you also find that as amazing as I do?
XLY - Consumer Discretionary Select Sector SPDR
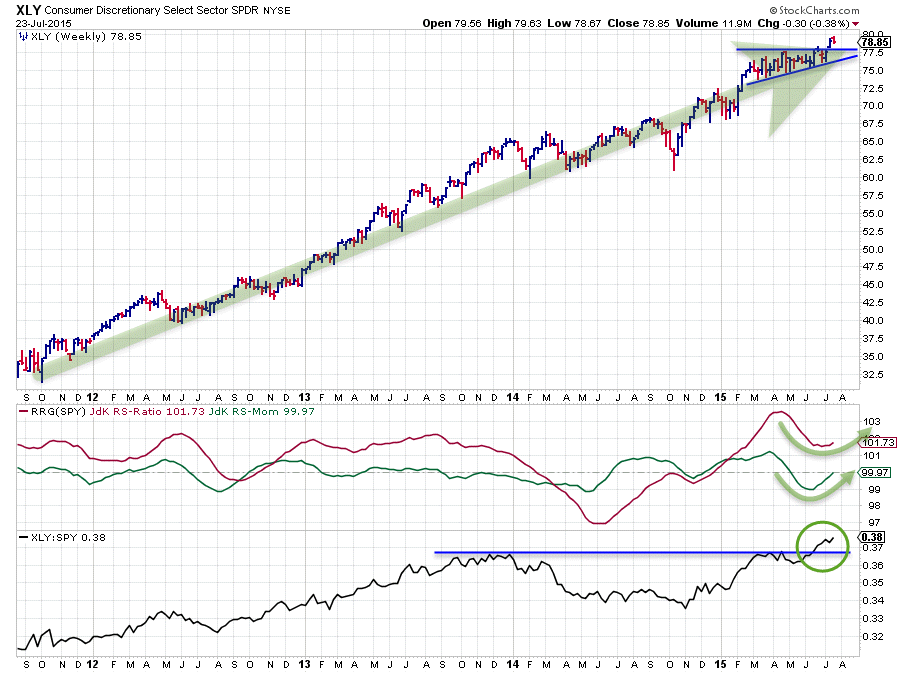
The third and final sector on the positive side of the RRG, almost inside the leading quadrant, is Consumer Discretionary (XLY).
The price chart over the past 3-4 years is showing one big up-trend in general. In comparison with the other sectors in the S&P universe and the movement / rotation since the beginning of this year there are a few things to highlight with regard to XLY.
The first thing to note is on the price chart where you can see that XLY has just broken a horizontal resistance level which clears the way for a further rally.
When we move to the relative strength sections of the chart the raw RS-line shows an important break. A few weeks ago the market pushed XLY/SPY above a horizontal level into new all-time highs in terms of relative strength. This is a strong move which should not be ignored. It is pointing to a further rise in relative strength for Consumer Discretionary.
In the chart holding the RRG-Lines this translates into a JdK RS-Ratio line which is well above the 100-mark, indicating that a relative up-trend is well underway, and a JdK RS-Momentum line which is just crossing back up above the 100-level, indicating that the temporary loss of relative momentum has ended and the up-trend in relative strength can continue higher.
All in all once again a strong signal for Consumer Discretionary in both the price and the relative charts.
Conclusion
- Clear split in sector rotation showing up on RRG
- Very strong move for Energy - XLE sector back into lagging quadrant
- Materials - XLB breaking up trend in price and dropping to new lows in relative strength
- Financials - XLF continuing to pick up (relative) strength and one of the leading sectors
- Health Care - XLV: boring :) still going strong
- Consumer Discretionary - XLY: RS breaking to new all-time-highs, expect further strength vs S&P 500
Always curious to learn what you think. Looking forward to any remarks and questions in the comments below.
Julius de Kempenaer | RRG Research
RRG, Relative Rotation Graphs, JdK RS-Ratio and JdK RS-Momentum are registered TradeMarks by RRG Research


