The Industrials sector, XLI, itself is positioned near the center of the Relative Rotation Graph holding all the sector ETFs that make up the S&P 500 index. This means that XLI is moving more or less in line with the S&P 500 and that there is, at the moment, not much to gain on a sector level.
In this article, I will take a look at the individual stocks that make up the Industrials sector and see if there are any opportunities, positive or negative, on an individual equity level.
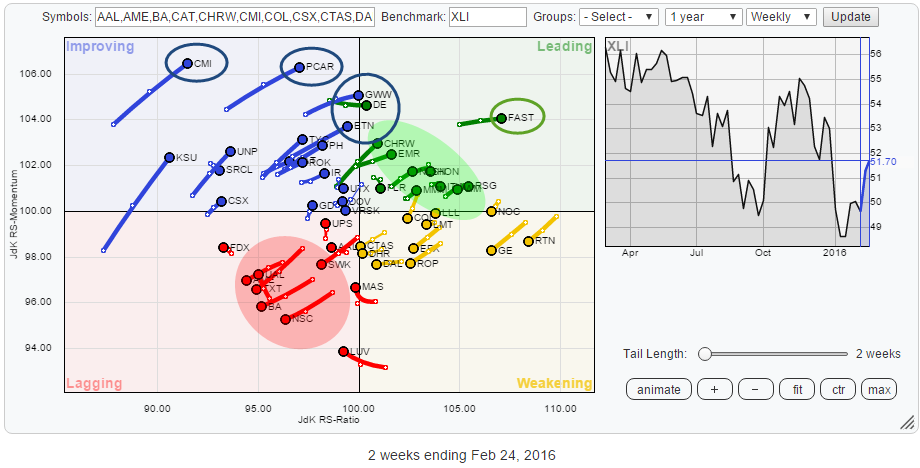 The Relative Rotation Graph above holds the top-50 (by market cap) stocks inside XLI. Based on the relative position of the sector the positioning of the individual equities is pretty much what one would expect; fairly evenly spread out over the plot.
Summary
- SWK inside of cluster of stocks heading deeper into lagging quadrant
- CMI and PCAR show long tails in improving quadrant, but it seems too early to call a turnaround
- GWW offers potential as it crosses over to leading quadrant
- FAST leading the sector, heading higher on JdK RS-Ratio axis
- CHRW & EMR are "Nice, Nice, not thrilling but Nice..."
- MMM breaking to new highs in relative strength, NLSN breaking to new highs in price
Inside the lagging quadrant
Inside the lagging quadrant, there is a distinct cluster of stocks heading lower on both axes, their tickers are shaded on the, zoomed in, RRG below.
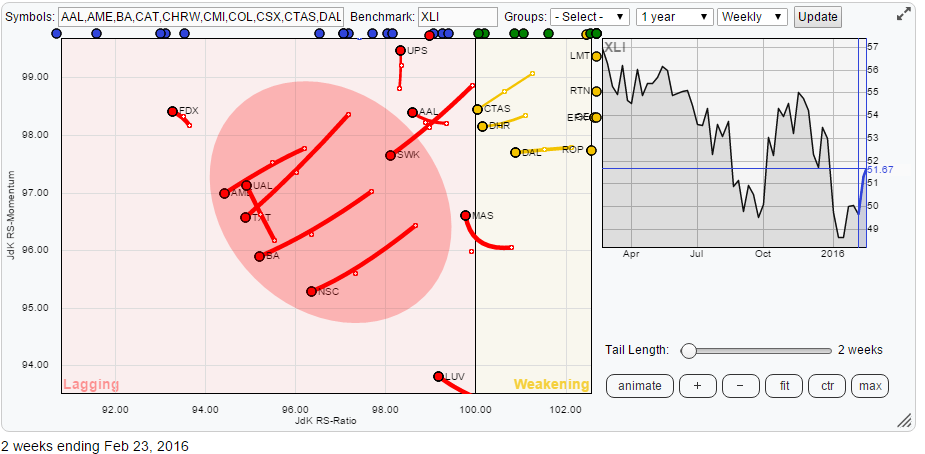 Inside the shaded area there are some stocks clustered together and clearly heading lower on both axes. These are AME, TXT, BA and NSC.
If you take a look at the price charts of these stocks, you will probably agree with me that these are not "good looking" charts ... UAL is also in that shaded area but, started to move higher on the JdK RS-Momentum axis. A quick look at the price chart reveals that this up-tick in relative momentum is probably a recovery within the relative downtrend.
Moving in a similar direction but in an "earlier" phase is SWK, this means that SWK has more room to move lower and, therefore, is probably more "at risk" at the moment.
Stanley Black & Decker Inc. - SWK
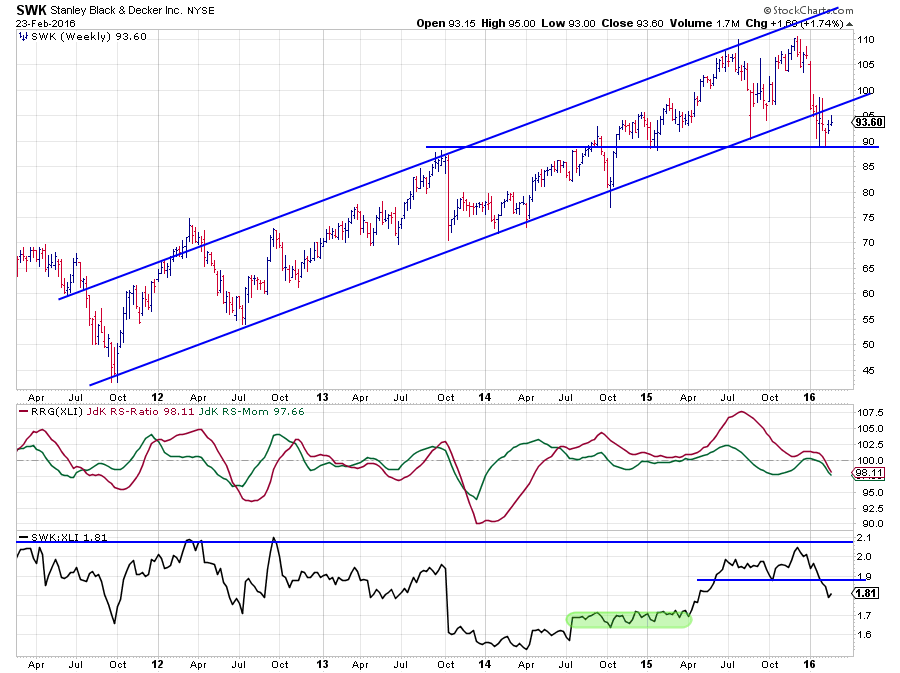 Drawing trendlines on the SWK chart is a challenge. I think the rising support line on the graph above, and its accompanying parallel resistance above, is perfectly feasible. However, when you stretch the chart over ten years you will find a trendline emerging out of the 2009 low which runs just underneath the recent low near $ 90, and it is an equally feasible trendline.
To me, this reaffirms two things to keep in mind when drawing trendlines. First, always be aware of the longer-term picture and secondly, two trendlines, drawn according to the rules, can still be different and debatable. In short, there is no such thing as a "perfect" trendline (but sometimes it is definitely possible to tell when a trendline is wrong ;) ).
Working from the chart above the level around $ 90 also shows up as a horizontal support level offered by two peaks in 2014 and two troughs in 2015. Hence, a break below this support level is expected to cause an acceleration of the decline.
On the raw RS-line, the area around 2.1 proved to be too strong again, and a clear high in relative strength was set. Coming off this resistance area, the RS-Line broke its previous low which is another sign of weakness and also limits the upside potential for relative strength in the near future.
The JdK RS-Ratio line picked up the uptrend in relative strength back in June 2014 when it crossed above 100 and remained above 100 until very recently.
The downward cross of the RS-Ratio Line below 100, backed by a renewed decline in the JdK RS-Momentum line, is now causing SWK to head deeper into the lagging quadrant and suggesting a further underperformance against XLI going forward.
Improving
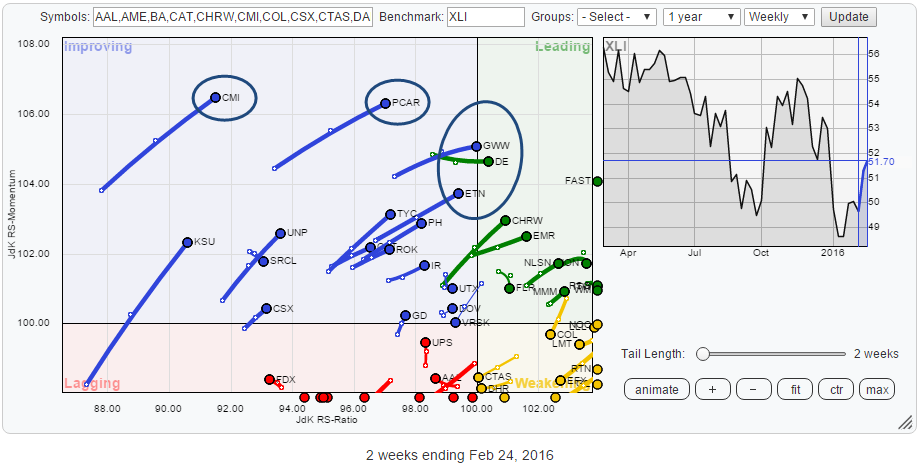
Inside the improving quadrant and on the edge of the leading quadrant there are a few stocks that stand out. At the top of the improving quadrant, we find CMI and PCAR. They catch the attention because of their high levels on the JdK RS-Momentum axis and their long tails. This makes them worth an inspection of their price charts. However when I run their charts and look at the combination of both price- and relative charts my judgement that both are probably recovering inside their (relative) downtrend, rather than turning around to start a new relative uptrend.
For CMI and PCAR the combination of price and relative charts is not convincingly enough to justify calling a turnaround or a new relative uptrend.
On the edge of the quadrant, we find three stocks that are about to cross-over into the leading quadrant. Beware that the last observation on the weekly RRG is fluid until Friday's close. So during the week, a stock can be in leading on Tuesday but back in the improving quadrant on Friday when its position is fixed for the week. The stocks I am referring to are GWW, DE and ETN.
Out of these three, I want to have a closer look at GWW. DE and ETN are definitely not weak charts as such, especially when compared to the other stocks in this universe. However, when I look at the raw RS-Lines of all three stocks my analysis is that GWW looks to be forming a relative low at the end of a prolonged downtrend and seems to be turning around. DE and ETN, despite their relative improvement, still have some overhead resistance on their RS charts that needs to be taken out.
WW Grainger Inc. - GWW
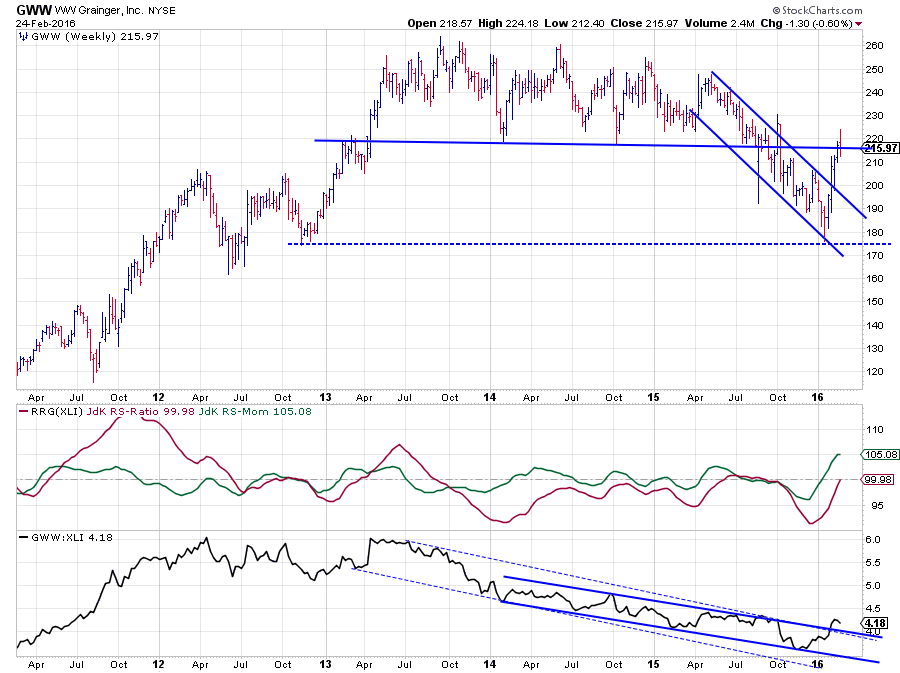 The simultaneous rise of the JdK RS-Ratio - and the JdK RS-Momentum Lines has put GWW at its current position on the RRG. When I trace the move in the RRG Lines back to the raw relative strength chart I see that it has been in a downtrend vis a vis XLI since the relative peak back in May 2013.
On the RS chart, I think two down-sloping channels can be detected. I have marked these two channels separately, one solid and one dashed. As you can see, the upper boundary for both channels converges at the point where the RS line breaks higher which gives a little extra confirmation to judge this move as a break of the previous trend.
Be careful it is in its early stages. To call a turnaround and / or the start of a new relative uptrend I would like to see the beginning of a new series of higher highs and higher lows in the RS-Line. That has not happened yet.
The firm level of relative momentum, highest in five years, indicates that this could be a more definite move than those that we have seen since the RS-Ratio line dropped below 100 in September 2013. Moreover, it looks as if this strong level of momentum is now dragging the RS-Ratio above 100 again, suggesting the start of a new relative uptrend.
The only bit of concern comes from the price chart where GWW found support near $ 175 which was a significant low in, late, 2013 and subsequently broke out of a short-term falling channel. However, after the initial rally, following the break the stock price is now challenging an important former support level near $ 215-216 which is starting to act up as resistance.
This could cause a short setback in price, but as long as the concurrent setback in XLI will be bigger, the RS Line (GWW:XLI) will continue to rise making GWW one of the more interesting stocks within XLI.
Leading
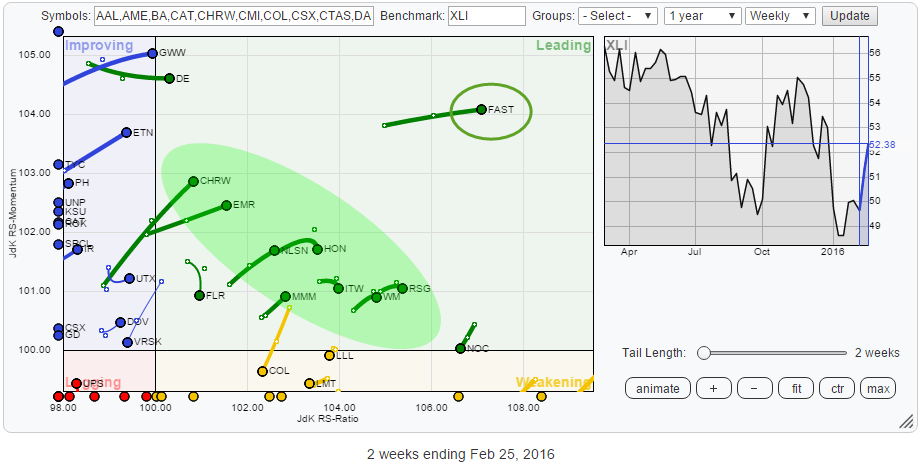 In the leading quadrant, there is one stock that stands out from the rest. FAST is deepest inside the leading quadrant and continues higher on the RS-Ratio axis at a solid pace while it is stationary on the RS-Momentum axis. Then there is a cluster of stocks in the green shaded area which have just entered (from improving) or re-entered (from weakening) the leading quadrant.
Inside that shaded area, I am looking for the stocks that are still advancing on both axes which brings me to CHRW, EMR, NLSN and MMM. The tails of the others started to, slightly, bend down this week. It is not bad, but I simply think the ones that are continuing higher on both axes are stronger and/or have more potential.
Scanning the price charts of CHRW and EMR reveals that they are, as Dom Deluise once said it, "Nice, nice, not thrilling but nice ..."
MMM and NLSN seem to be better positioned from both a price and a relative perspective. MMM is breaking out to new highs on its relative strength against XLI (MMM:XLI). I picked NLSN for a closer look as it is breaking out to new highs in price and, ok ok... also because it has its headquarters in Amsterdam (or at least very close to it in one o the suburbs called Diemen).
Fastenal Co. - FAST
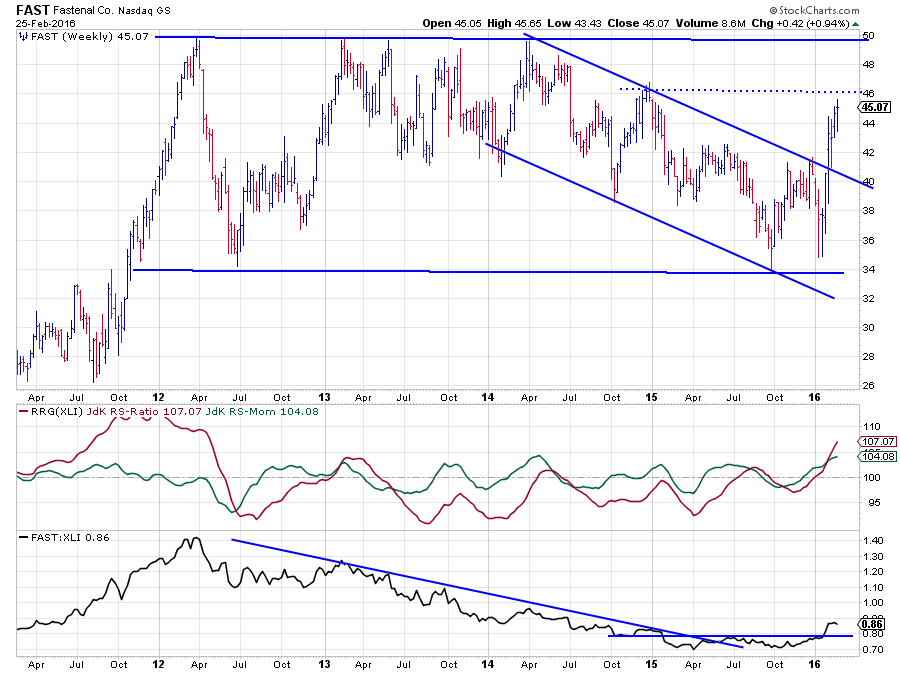 After a very strong and steep rally in 2012, FAST peaked just below $ 50 and that level became a solid resistance level in the years to follow. The area was tested three to five times (depending on how much leeway you want to give a "test") but never gave way. During 2014 and 2015 the price trend was predominantly down, and FAST reached a low near $ 34 late September of last year.
Out of that low things started to improve for FAST. One more (lower) high against the falling resistance line was set late December, but the subsequent decline did not break the previous low and, by definition, therefore, did not reach the lower boundary of the falling channel. A first higher low was set just above $ 34, and the following rally took out the previous high and the falling resistance line, ending the downtrend in price. $ 42 should offer good support now in case of a setback while the next big resistance level is the area near $ 50 with some intermediate resistance around $ 46.
From a relative perspective, FAST showed a downtrend, pretty much all the way since the peak early 2012. There have been some attempts to turn the tide, but they all (three) failed soon after the RS-Ratio managed to get above 100.
In the relative strength line, the low was set at the beginning of 2015. Subsequently, a small trading range started to emerge, and the falling resistance line was taken out. A confirmation of the improvement and a sign that the relative trend has turned upward came when the RS-Line broke above its mid-2015 highs early 2016.
The clear bottoming out process after a long downtrend in the RS-line, combined with a solid move above 100 of the RS-Ratio line backed by high RS-Momentum levels suggests that a meaningful new period of outperformance of FAST against XLI is underway.
Nielsen NV - NLSN
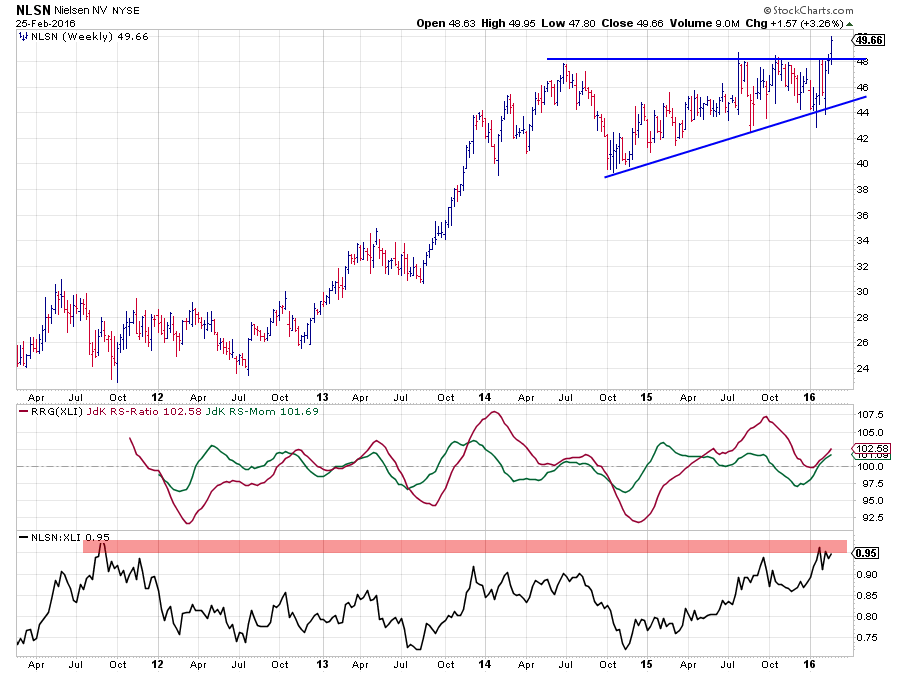 The first thing noticed when looking at the NLSN chart is the fact that price is breaking out to new highs. And, as a matter of fact, it is moving to new all-time-highs. This is undeniably a strong sign for the expected price development in the near future, and it also means that the breakout level, i.e., the area near $ 48 is projected to come back as support in case of a setback. Hence, limited downside risk with plenty of upward potential. Something all investors like to see.
On the relative charts, the raw RS-Line is seen challenging its all-time-highs as well, but it has not been able to push through the 2011 peak. The relative uptrend, out of the late 2014 low, however, is clearly visible and was picked up by the JdK RS-ratio line in April last year. During the transition from 2015 into 2016, the RS-Ratio line had a "touch and go" with the 100-mark. This relative setback caused the tail of NLSN on the Relative Rotation Graph to re-enter the leading quadrant from weakening.
The NLSN chart is already strong in itself, especially because of the break to new highs in price. When relative strength will also be able to take out its resistance area (~0.975), a further push into the leading quadrant and a continuation of outperformance over XLI may be expected in the next few weeks/months.


