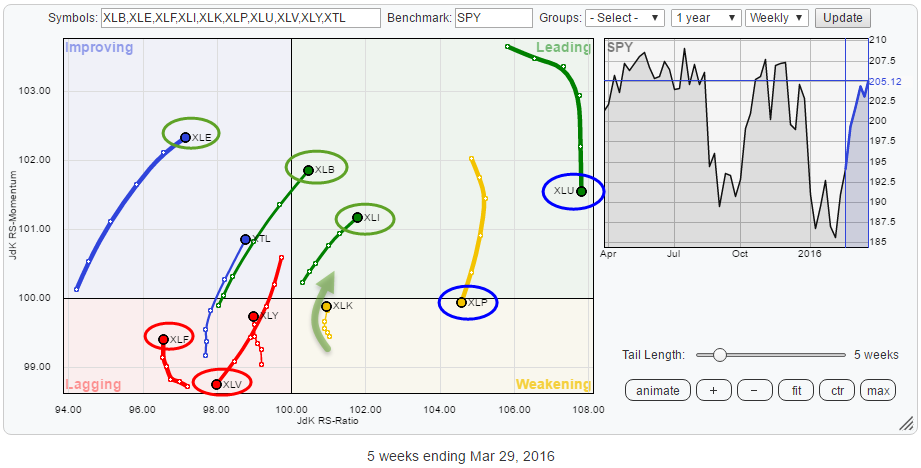
The Relative Rotation Graph for US sectors shows us the relative movement of the various sectors against the benchmark (SPY) and against each other and in this way visualizes the current sector rotation in the US equity market.
The RRG below shows the ETFs covering the major sectors of the S&P 500 index against the ETF (SPY) that tracks this benchmark.
Summary
- Loss of relative momentum in XLU expected to be temporary before resuming uptrend vs. SPY
- XLP continues higher inside rising channel on the price chart. Relative trend continues to improve
- XLI expected to improve further on break beyond $ 55
- XLK starting to rotate back to leading quadrant
- Sector rotation in XLV not healthy at all
Quick scan
The first look at this Relative Rotation Graph reveals that some relative momentum moves are underway. On the right-hand side of the plot we find XLU and XLP, the sectors that have been leading the way in recent months, losing relative momentum. While on the left-hand side we find XLE, XLB and XLI clearly heading higher on the JdK RS-Momentum scale. I will look at the individual charts of some of these sectors in combination with the RRG-Lines to analyze if these momentum moves have the potential to really change the relative trend or if they are corrections/recoveries within longer-term moves.
XLK (Technology) is inside the weakening quadrant at the moment but it is showing an interesting rotational pattern back up to the leading quadrant again with a very short tail.
In the weakening quadrant, XLF is still far down on the JdK RS-Ratio scale and therefore, despite the recent pickup in relative momentum, still deemed as unattractive. A dangerous rotation is seen in the Health Care sector (XLV) as it reversed course inside the improving quadrant a few weeks ago and then quickly started to pick up negative relative momentum and has now entered the lagging quadrant again showing a long (power)full tail.
Utilities - XLU
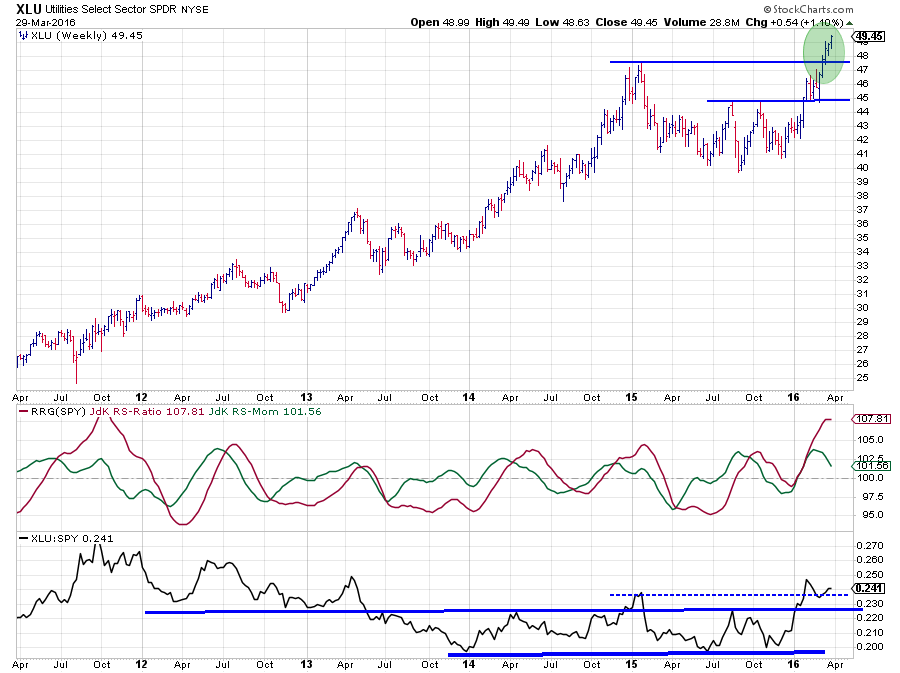 The price of XLU jut broke to new highs which is undeniably a strong sign and often followed by a (further) rally. The additional (side) effect of such breaks, which I like, is that the old resistance level, in this case, $ 47.50, becomes the new support level. So as a result of such a break the risk/reward dynamics for the security change significantly. Before the break, it had limited upside potential and increasing downside risk while now, after the break, XLU has limited downside risk and plenty of upside potential. From a technical point of view, there are no old highs available anymore that can serve as resistance.
On the relative charts, XLU has not reached new highs yet but it seems to be completing a major base in relative strength. If we just look at the relative strength of XLU vs SPY (XLU:SPY) in the lower pane of the chart, we see a clear decline from the 2011 relative high into the low just before the start of 2014. This down move was then followed by two years of sideways relative movement, almost to the day. In the first weeks of 2016, the RS-Line broke above the upper boundary of the two-year trading range and started moving higher.
The move in relative strength was picked up by the RRG-Lines which started to move higher and above 100 in sync and the JdK RS-Ratio line (measuring relative trends) pushed to the highest level in four years. It is not strange that after such a move some sort of a correction starts to show up.
Given the position of XLU on the Relative Rotation Graph. It is the strongest sector in the universe by a mile at 108 on the RS-Ratio scale. And the fact that raw relative strength has just broken from a two-year sideways base. The current loss of relative momentum will very likely be a temporary pause before the relative trend will continue higher.
Staples / Discretionary - XLP / XLY
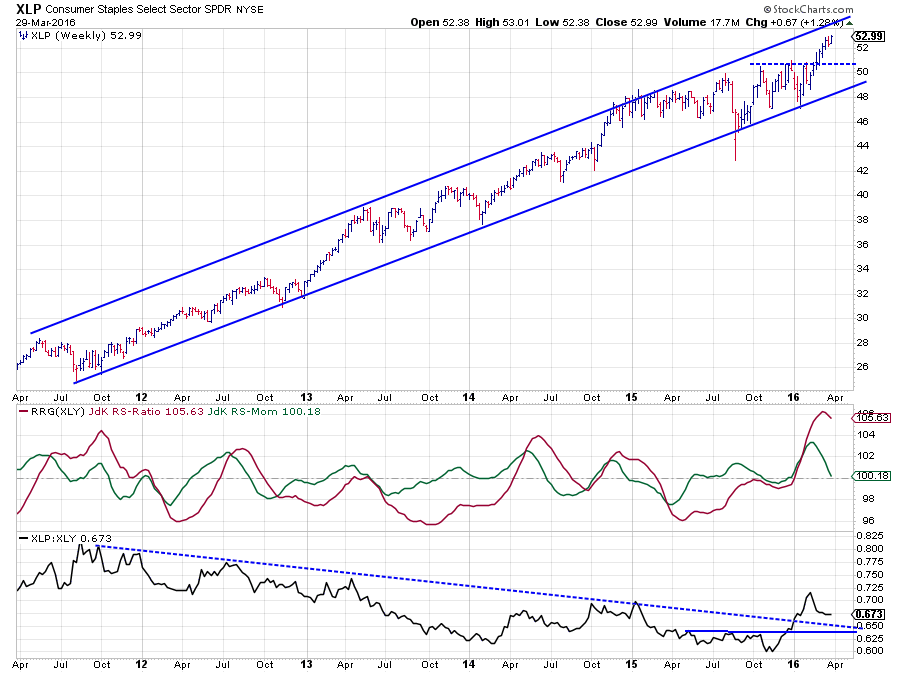 The Consumer Staples sector (XLP) is showing a rotational pattern quite similar to XLU on the RRG, just a bit closer to the benchmark.
Above is an updated version of the chart of Staples versus Discretionary (watch out not vs SPY). The break of the relative downtrend that characterized this chart since 2011 is still very visible and still very much intact. In this relationship the JdK RS-Ratio has risen to the highest level in five years, indicating that it is a very strong relative trend in play at the moment.
On the price chart of XLP, the upward trending channel is very much alive, and there is still some upward potential left before XLP will reach the upper boundary again. On the downside, risk seems to be limited at the moment to the level of the former peak just above $ 50 where support may be expected.
Industrials - XLI
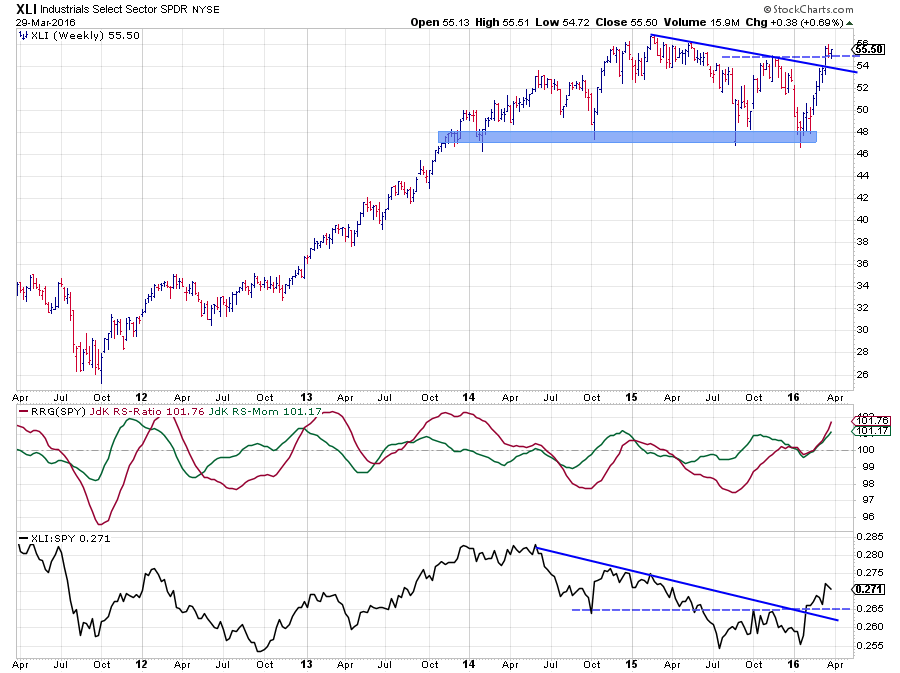 Out of the three sectors, mentioned in the quick scan, that are moving higher on the JdK RS-Momentum scale, XLI is furthest to the right and looks to be the strongest.
The relative strength of XLI vs SPY shows a downtrend out of the 2014 high. During this period, the JdK RS-Ratio line moved predominantly below the 100-level. Early 2016 the RS-Line broke its falling resistance line and at the same time completed a double bottom formation. Reason enough to call the end of the relative downtrend.
At the same time, both RRG-Lines (Ratio and Momentum) started to move higher in tandem and this is what we see back on the RRG chart where XLI is moving higher on both axes and deeper into the leading quadrant at an almost 45-degree angle, indicating a healthy relative uptrend.
Improvement is also visible on the price chart where XLI first managed to break its falling resistance and shortly thereafter the horizontal level near $ 55. The next hurdle to watch is the level of the peak in early 2015, beyond that is uncharted territory for XLI.
Technology - XLK
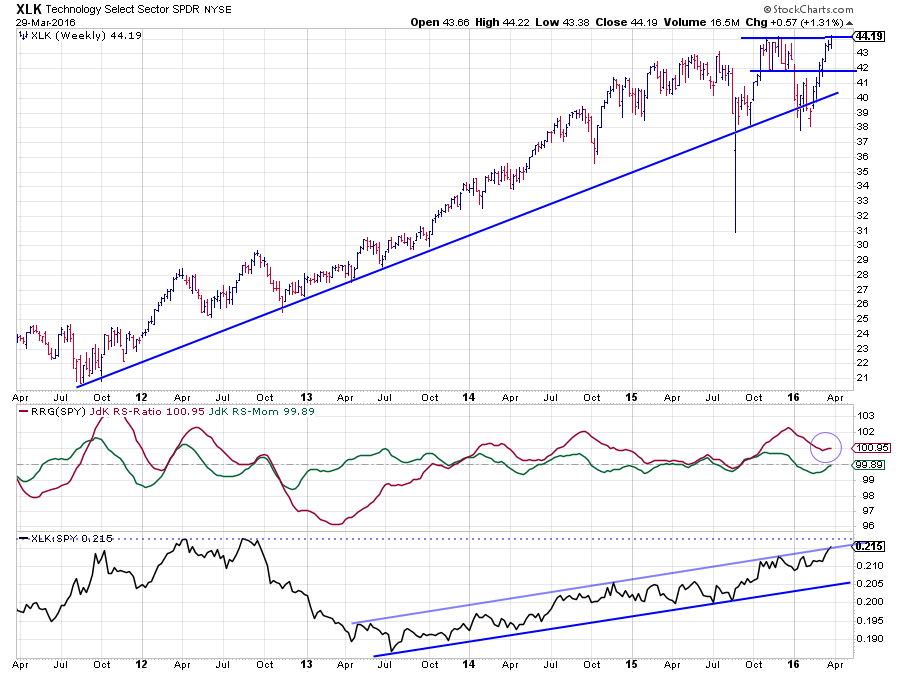 XLK is pushing against resistance at the moment on both the price and the relative charts. On the price chart, the late 2015 peak near $ 44 is challenged while on the RS-chart XLK:SPY is pushing against the upper boundary of the rising channel. An extra hurdle will show up for the RS-Line shortly when the rising resistance will meet the level of the peaks in relative strength that were set in 2012.
So, at the moment, there is quite a bit of risk from both price- and relative perspectives. Clearly a break higher will flip the risk/reward ratio around and make XLK very attractive again. The encouraging bit is found in the rotational pattern of XLK on the Relative Rotation Graph.
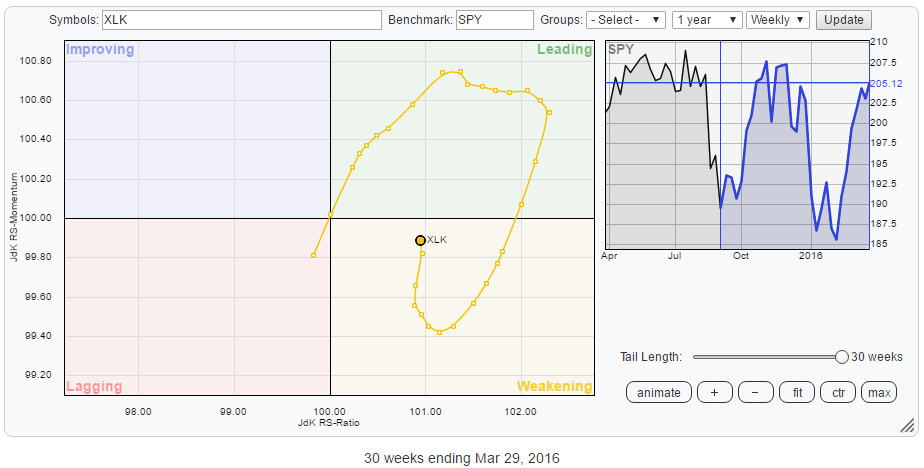 What we see here is the start of a rotation that could bring back XLK into the leading quadrant without travelling through lagging/improving. Usually, this is the sign of strong relative trend in play that just went through a period of consolidation or correction. A break beyond resistance on the price chart will very likely lead to further improvement in relative strength which will push XLK back into the leading quadrant again.
Take a look at the daily RRG of XLK, which confirms the improving relative strength at the moment, and watch the price action around $ 44-45!
Health Care - XLV
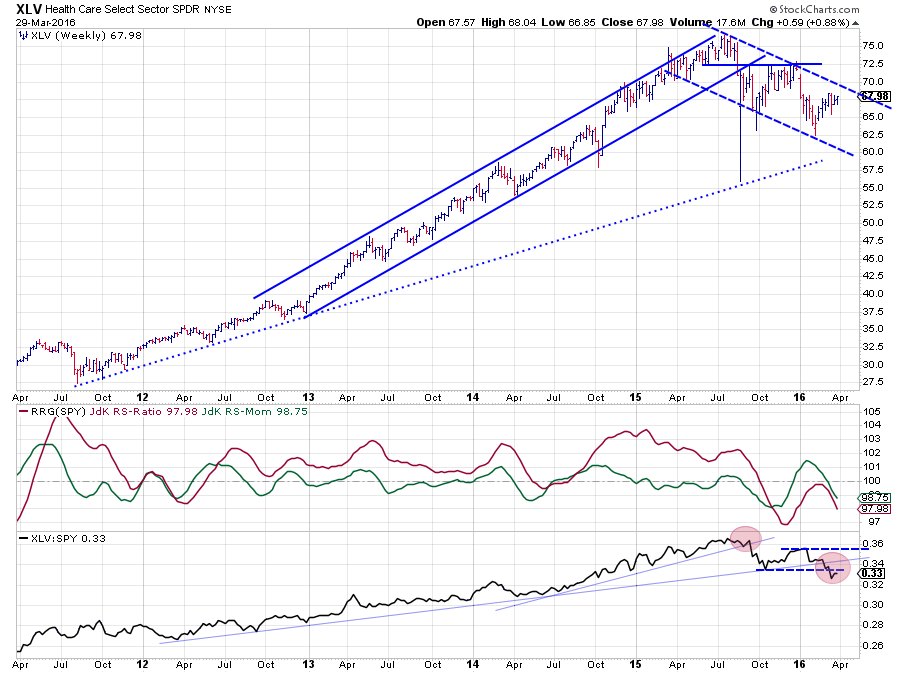 The Healt Care sector is showing a completely dfferent picture and is, actually, not looking that healthy at all.
After a very strong and prolonged uptrend in price and relative strength from 2011 onwards, things started to change in the middle of 2015. After peaking above $ 75 XLV started to drop rapidly, breaking all sorts of support on both the price and the relative charts. After the very wide swings in August things started to stabilize a bit but never got back into the strong trend which was in play prior to july-August 2015.
Q4 of 2015 showed a recovery in price and a consolidation in relative strength but neither was able to put in a new higher high. As a matter of fact on both charts, a lower low was formed, indicting weakness. Beginning 2016, things started to deteriorate almost immediately with price pushing to a new low, followed by relative strength dropping below its previous low in the last few weeks, meanwhile breaking its rising support line.
This combination of price and relative movement has caused a rotation on the RRG chart completely on the left hand side of the chart (oppositie the XLK rotation seen above)
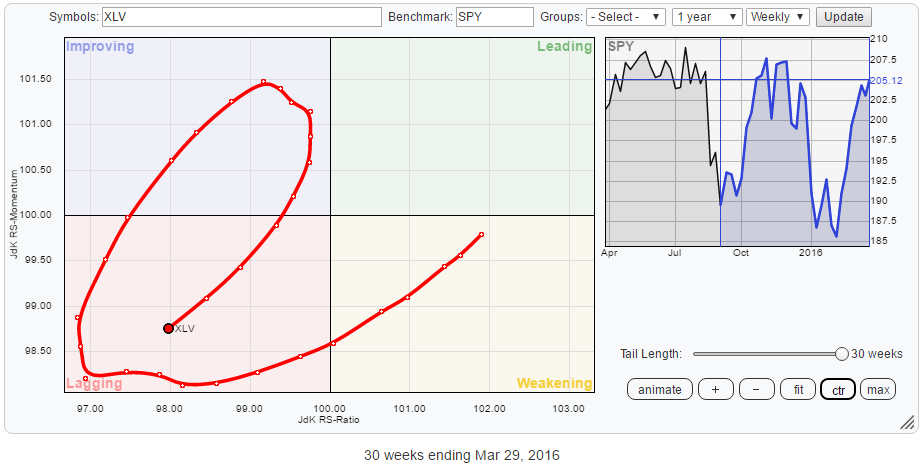 This rotational pattern, in combination with developments on price- and relative charts, leads to the believe that XLV is set for further underperformance against SPY in coming weeks/months.
Julius de Kempenaer | RRG Research
RRG, Relative Rotation Graphs, JdK RS-Ratio and JdK RS-Momentum are registered TradeMarks by RRG Research
Follow RRG Research on social media:
LinkedIn Facebook Twitter


