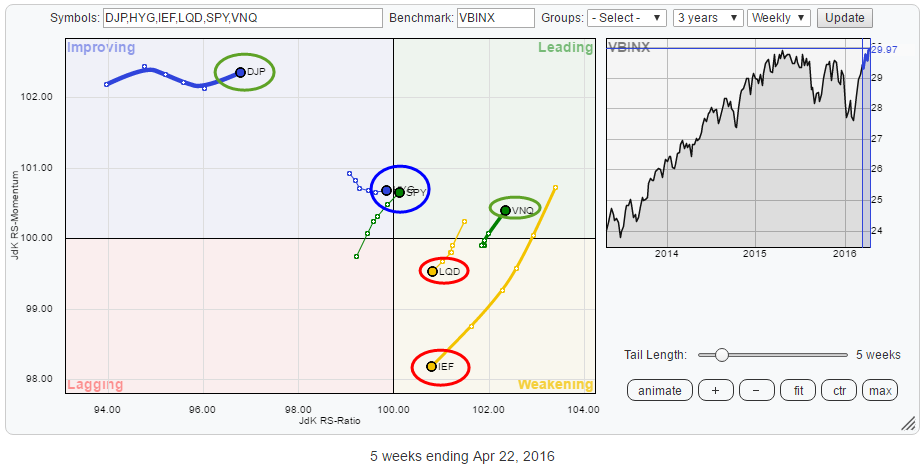
The Relative Rotation Graph below shows the rotational picture for a number of asset classes, based on ETFs, against the Vanguard Balanced index fund on a weekly basis. For some of these asset classes, the equivalent picture on a daily basis is confirming but for others it is contrarian. Or maybe I should say, confusing.
Summary
- Commodities confirming turnaround after long downtrend
- Short-term pattern in VNQ suggests longer-term weakness at hand
- SPY:IEF ratio at proving grounds
Quick scan
A quick scan over the Relative Rotation Graph above reveals that there are two asset classes that are standing out at the moment. I.e. they are showing rotational patterns away from the benchmark (center of the chart).
These two asset classes are Commodities (DJP) inside the improving quadrant, travelling towards the leading quadrant at a steady JdK RS-Momentum level and Government bonds (IEF) inside the weakening quadrant but heading rapidly, see the long tail, towards the lagging quadrant. These two asset classes deserve a bit of our analysis-love.
HYG, SPY and LQD are all (very) close to the centre of the chart which means that there is not too much deviation from the benchmark at the moment.
VNQ, which represents the Real Estate sector, is now the highest ranking sector on the JdK RS-Ratio axis.
In order to get a more detailed view of the rotations that are currently underway, I have plotted a daily version of the Relative Rotation Graph above.
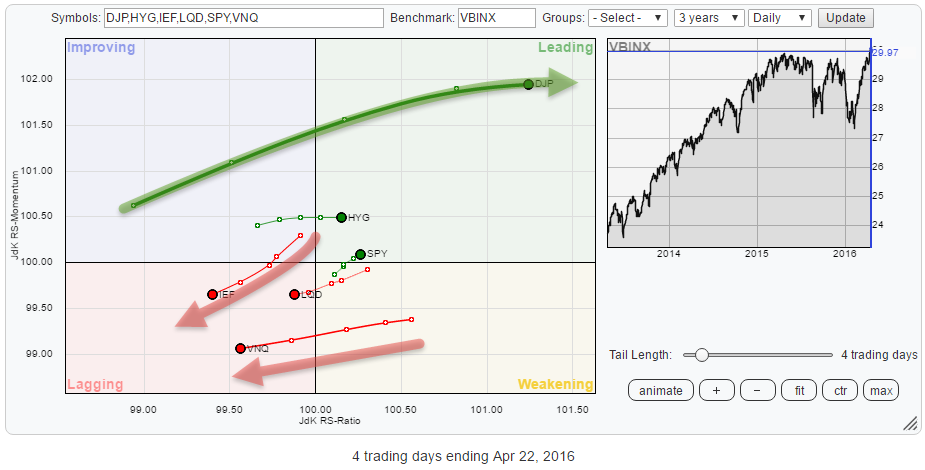 The strong rotation for Commodities (DJP) is clearly visible, powering into the leading quadrant, backed by a long tail. On this daily RRG, IEF (Government Bonds) is already heading into the lagging quadrant and it is even coming from a rotation through the improving quadrant, suggesting that a strong relative downtrend is underway on a daily timeframe.
Inside the leading quadrant, we only find HYG and SPY but very close to the benchmark and, especially SPY, has a very short tail. This means that there is not much power behind the relative move of SPY at the moment.
The rotations for VNQ (Real Estate) on the weekly RRG is as good as opposite its movement on the daily RRG; this requests a further investigation.
Commodities - DJP
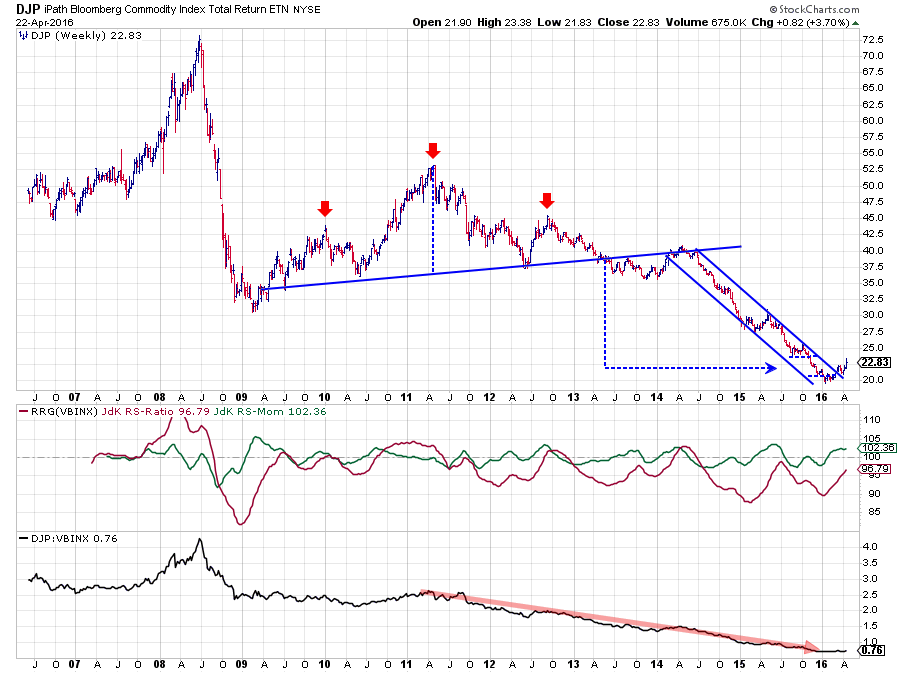 The gradual improvement for commodities after a multi-year decline is starting to take shape slowly but securely. The chart above shows the long-term development of DJP. The most noteworthy event on the price chart is the break out of the down sloping channel in March after completing a bottom formation around $ 20.
After the initial break and subsequent rally, DJP went through a setback more recently which ended in a first higher low on the weekly chart. Last week the market managed to also break above its most recent high which means that a new series of higher highs and higher lows is now underway.
The JdK RS-Ratio is still below the 100-mark but working its way higher supported by a JdK RS-Momentum line that is already above 100 and stabilizing around 102.
The structure of this turnaround is better visible on the daily chart of DJP below.
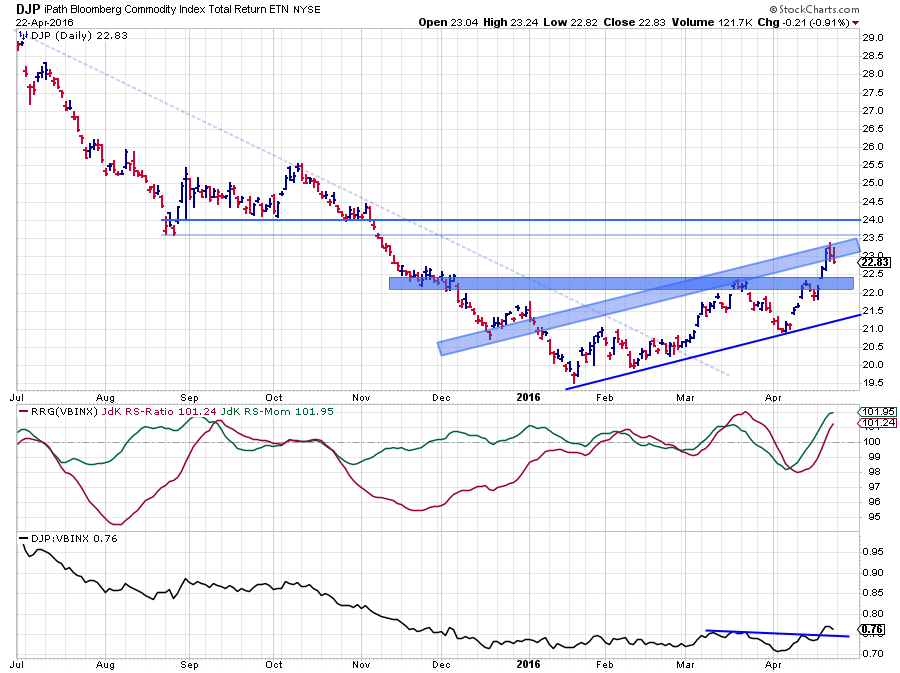 On this chart, a new series of higher highs and higher lows already started when DJP broke above its Jan/Feb highs near $ 21 and then tested this $ 21 level as support in the next decline. Reading from this chart it looks like the area between $ 23.50 - $ 24.00 is now the next resistance level to watch while $ 22.00 - $ 22.50 should act as support.
On the daily chart, DJP has already convincingly entered the leading quadrant and is pushing deeper into this positive area with the RRG-Lines increasing on both axes.
Given the magnitude of the previous decline, the gradual bottoming process and the improving relative strength against other asset classes. Commodities are likely to be one of the stronger, if not the strongest, asset classes in coming months.
Real Estate - VNQ
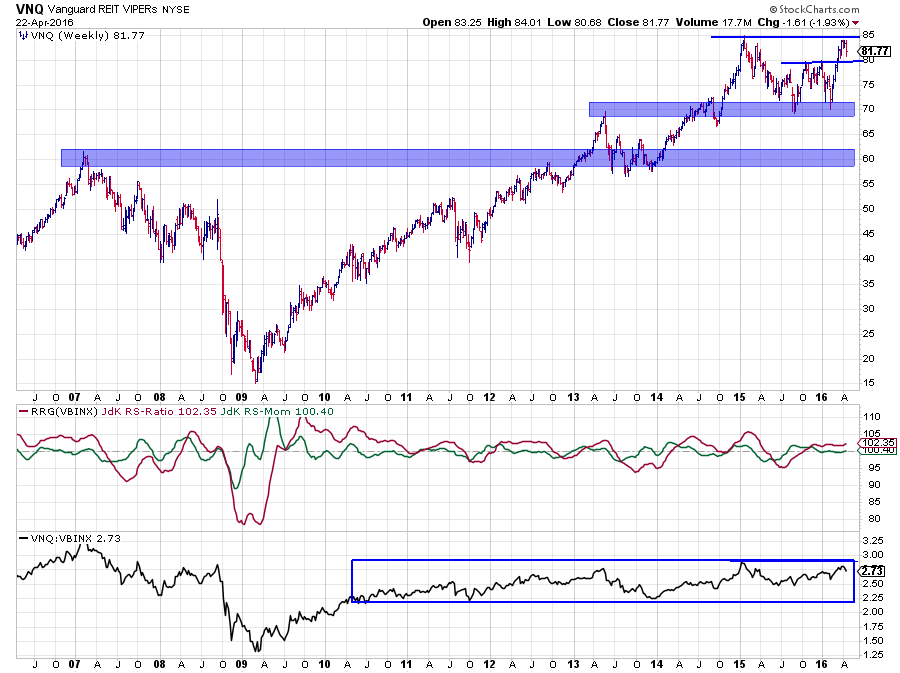 The chart of VNQ shows a very strong uptrend that started out of the 2009 bottom and managed to stay on course until the beginning of 2015. After setting a high near $ 85 at that time, it took more than a year to once again reach that level and in the past few weeks the 2016 rally in Real Estate stalled against this $ 85 level which is becoming a serious resistance level.
On the weekly Relative Rotation Graph, VNQ shows up as the strongest asset class, measured by JdK RS-Ratio. Its relative momentum, however, is very low and that means that the current trend is not very strong which causes the short tail for VNQ on the RRG.
During the whole period of up trending prices, the oscillation of the JdK RS-Ratio around 100 shows alternating periods of relative up- and downtrends versus VBINX but, apart from the first move in 2009-2010, no prolonged relative trend in either direction. This can also be seen in the sideways move of the raw RS-Line which is moving inside the boundaries of a relatively narrow range since early 2010.
The daily chart of VNQ shows the recent developments in a bit more detail and will probably give us a clue about future direction for coming weeks.
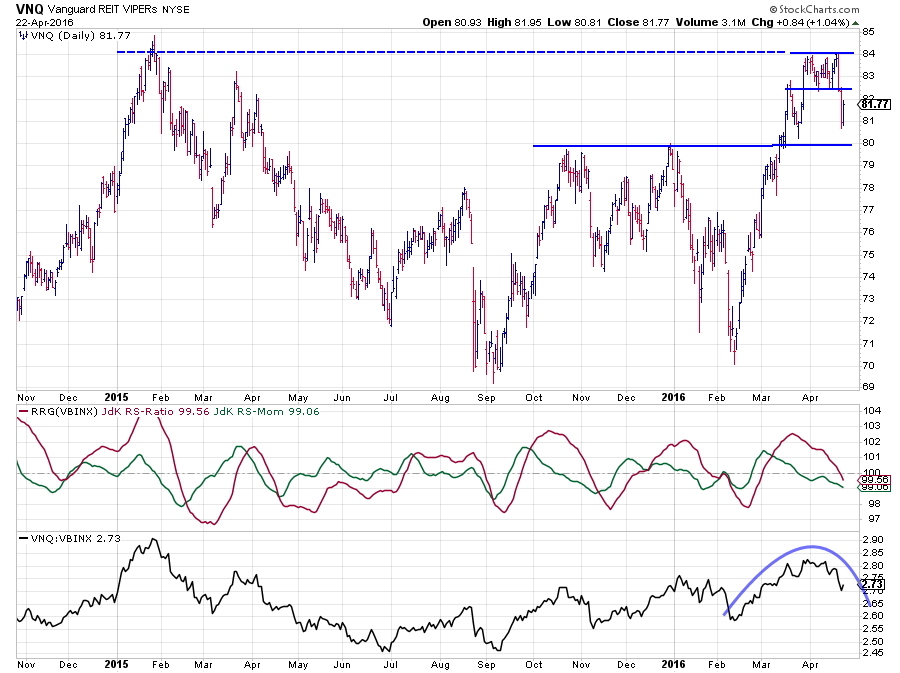 The daily chart reveals that the test of resistance near $ 85 took the shape of a double top formation, a well-defined reversal pattern calling an end to the move that started from $ 70. The next support level to watch is now coming off of the two peaks near $ 80, that were set in Q4 of 2015.
Looking at the relative strength structure, accompanying the recent price movement of VNQ, shows that the raw RS-Line is rolling over and starting a new series of lower highs and lower lows while the JdK RS-Ratio line has dropped below 100, signalling/confirming a new relative downtrend.
Comparing the power of the VNQ move on the weekly RRG with the move on the daily RRG shows that the tail on the daily RRG is long and strong into the lagging quadrant while the tail on the weekly RRG is short and only just inside leading at low momentum.
Given the sharp turn against resistance and the power of the relative downtrend that seems to be developing on the daily (RRG) chart, I prefer a cautious stance towards Real Estate.
Equity / Bond ratio - SPY:IEF
When I first looked at the position of SPY on the (weekly) Relative Rotation Graph, I was a bit surprised as the current state of the general equity market does not "feel" particularly strong to me. But yet there it is, just crossing into the leading quadrant on both the weekly and the daily RRG.. What's going on?
To get a better handle on the rotation of SPY versus IEF (equities vs. bonds), I isolated these two on a Relative Rotation Graph using VBINX as the benchmark and played an animation since the beginning of 2015. At first, I did not immediately see it but after running that animation for a number of times I started to notice that IEF, over this period, went through much larger rotations than SPY. As a matter of fact, SPY remained pretty close to the VBINX benchmark all the time. I have added the animation below for review.
 Now, what does it tell us? First of all, we have to realize that VBINX composition is roughly 60% in US equities and 40% in US (aggregate) bonds. So it is expected that SPY will rotate a bit closer to the benchmark simply because of its heavier weight. Nevertheless, over the past year and a half equities remained very close to VBINX while bonds are showing significant deviations periodically, both positively and negatively. To me, this suggests that alpha over VBINX is generated through IEF much more than through SPY.
Also, because of the composition of VBINX, when bonds are weak(ening) equities will show up as in a relative uptrend by definition.
In other words; Equities can show up inside the leading quadrant not only because of equity strength but certainly also because of bond weakness. And this may exactly be what is going on at the moment (short term).
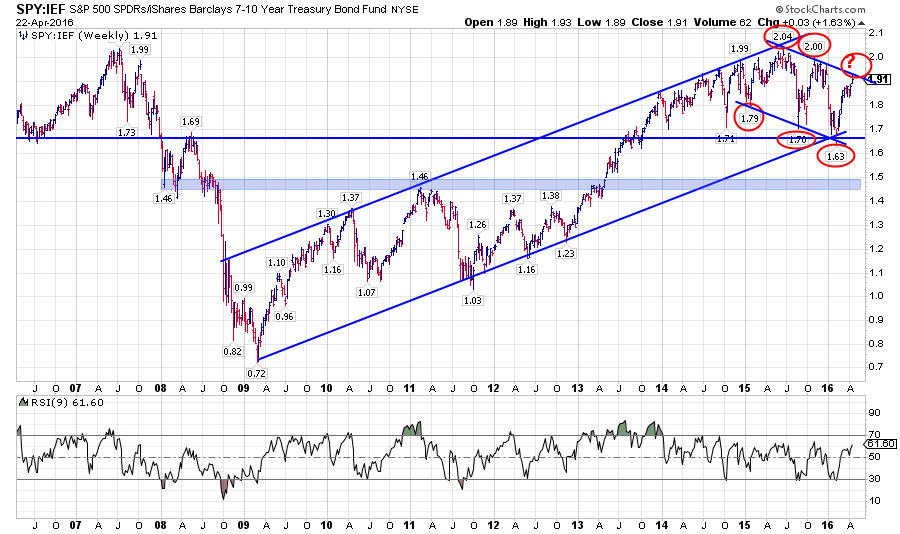 The chart above shows the equity/bond ratio (SPY:IEF). Despite the recent up-move, the trend in play since early 2015 is down! Each subsequent high in this ratio is lower than the previous high, and every subsequent low is lower than its predecessor. A downtrend by definition.
On their individual price charts, SPY is currently close to testing or is already testing some major resistance levels while IEF already seems to be on its way down from such a test.
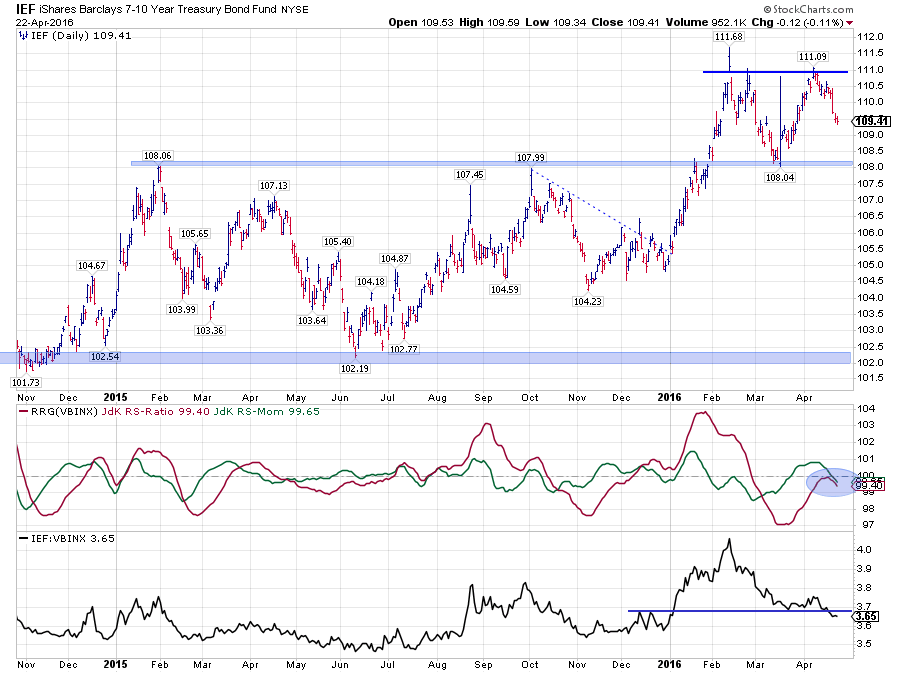 This chart shows that IEF failed to break beyond its previous peak near $ 111 and started to work its way down. The next support level is found near $ 108, and a break lower means the completion of a pretty big double top formation which provides us with a target around $ 105 ( 111 - 108 = 3 points height of the pattern, subtracted from break level at 108 = 105 ).
Given the current weakness in bonds the SPY:IEF ratio is therefore now at an important level as it needs to either cross its resistance upward or set a new high around current levels and start a new down-leg down in the current trend.
If the ratio crosses higher, equities will once again be the preferred asset class, not necessarily because of their own strength but more because of the weakness in bonds. However, IF SPY:IEF sets a new high and starts to move its way down we may have a bigger move at hand...
In that case, equities will have to drop faster than bonds in order to keep the ratio going down, the only way that this can materialize will be through a sharp drop in equities. Reason enough, for me at least, to remain very cautious with equity investments (or overweights) at the moment.
Julius de Kempenaer | RRG Research
RRG, Relative Rotation Graphs, JdK RS-Ratio and JdK RS_Momentum are registered TradeMarks by RRG Research
Follow RRG Research on social media:
LinkedIn Facebook Twitter


