Currencies or Forex are a strange beast in financial markets. The FX market is the biggest in the world with trillions of dollars (worth) traded around the clock but no central marketplace. There is no such thing as the 'New York Currency Exchange' or the 'European Currency Exchange'.
If you trade in FX, you always trade 'over the counter' with your bank or a broker, etc. It is very well possible that at the exact same time someone else trades the same currency through another bank at a different price...
Because of the massiveness of the market and the fact that a lot of banks and specialized brokers are publishing quotes on various currencies 24/7, the effect or arbitrage causes all the quotes of these banks and brokers to remain very close to each other which makes it fairly safe to trade on these prices.
Because of their deep liquidity, Forex markets are 'willing victims' for chartists as they truly reflect the general psychology of the (trading) public. Therefore, the price moves on FX charts are the result of the buying and selling of millions of traders around the world. It takes a lot more power (money) to change the direction of a currency than it takes to change the direction of a small cap stock traded on the US (or any other) stock exchange.
It takes two to tango
When we talk about 'the Euro' or 'the US dollar' or 'the Yen', in reality, we only talk about half of the equation because a currency is always expressed IN another currency. So to make a proper reference, we should also state the other half of the currency pair as well, EUR/USD for example or USD/JPY. Obviously, you could talk about or look at a chart of USD/EUR or JPY/USD as well; they are simply the reverse.
Essentially, curency pairs are already relative (strength) lines in themselves!
Hold this thought! As we will need it later when we are going to run a Relative Rotation Graph holding some currencies.
To avoid confusion, over the years, the market has come to some sort of a convention to reference various FX pairs. The most important pairs that are generally accepted and referenced as the "majors" all have the USD on one side. The majors generally have the lowest spread and are the most liquid:
- EUR / USD
- USD / JPY
- GBP / USD (Cable)
- USD / CAD
- USD / CHF (Swissy)
- AUD / USD (Ozzie)
- NZD / USD (Kiwi)
When we add the Swedish and Norwegian Krone to this list, we have the currencies of the G-10 countries.
Apples and oranges
Although it is a good thing that the market has come to an understanding, it can, at times, be confusing when trying to make comparisons. The reason is that in some pairs the USD is the numerator while in their pairs it is the denominator.
For example, when both the EUR and JPY are appreciating against the USD, the EUR/USD graph will show a rising line while USD/JPY will show a falling line as you can see in the chart below.
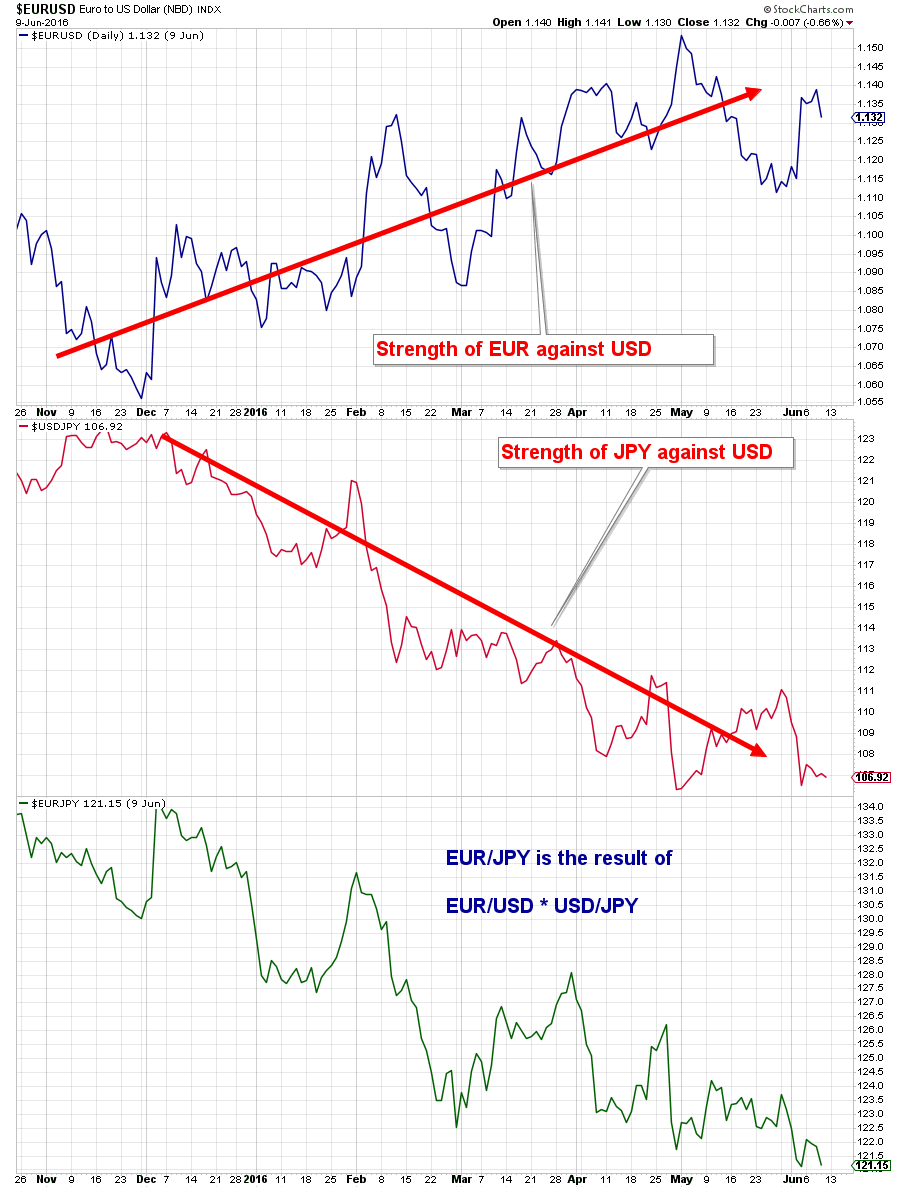 The third pane shows the price of the EUR/JPY cross rate (currency pairs that do not contain the USD on either side are often referred to as 'crosses' or 'cross-rates'. The $EURJPY cross rate can be calculated using a technique which is known as triangular calculation.
EUR /JPY = EUR/USD * USD/JPY
121.15 =~ 1.132 * 106.92
The result is that you will sometimes find commentaries like 'the Yen rose from 120 to 110.' I am not sure about you but for me, that still sounds "strange."
The fact that some these 'market conventions' are like apples and oranges and thus difficult to compare is one of the problems that we have to deal with when we want to show a group of currencies on a Relative Rotation Graph.
The good news is that there is a fairly easy solution to work around this problem. For a Relative Rotation Graph to show the proper relative (strength) rotation, all elements on the chart need to have the same denominator. This can be achieved to create a list of, let's stick to, the G-10 currencies using the USD as the common denominator.
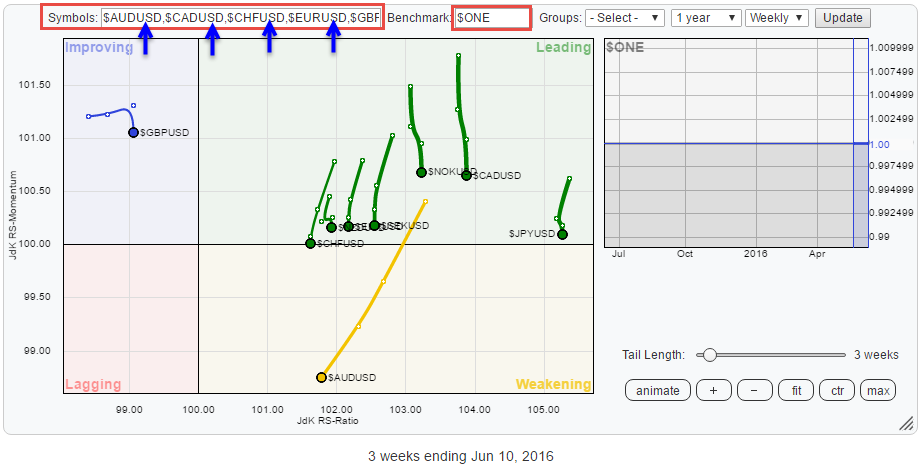
Here are the tickers on StockCharts.com
$AUDUSD,$CADUSD,$CHFUSD,$EURUSD,$GBPUSD,$JPYUSD,$NOKUSD,$NZDUSD,$SEKUSD
The keen observer will notice that these are 'only' nine tickers... Obviously, the USD in the denominator is the tenth currency to complete the group of ten.
But what about the "benchmark?"
As you know, a Relative Rotation Graph needs a "benchmark" to calculate the relative strength numbers and momentum values across the universe and then plot them on the RRG canvas.
This is the second hurdle that needs to be dealt with.
Ever since I created Relative Rotation Graphs, I used a slightly different approach to creating them for currencies. Mainly I adapted the code, in my own applications, in order to deal with the fact that each currency pair is a relative strength line in itself and that the common denominator of all the currencies in the universe, in this example the USD, acts as the benchmark.
The problem is that most implementations of RRG, also on StockCharts.com, are geared towards equity markets, and they require a ticker symbol in the benchmark field to run the calculations. Since the first introduction of RRGs to a bigger audience, back in January 2011, I received a lot of questions and requests about how to create a Relative Rotation Graph for currencies.
The "Ahaaa moment."
My guesstimate is that I have answered maybe 50-100 of those messages and requests, coming from users from different systems that have implemented RRG, by explaining that currencies are different from other financially traded instruments in a number of ways. And that they, therefore, require a slightly different approach/algorithm to plot them on an RRG and that this was not taken care of yet...
Until two weeks ago....
On the forum that we have on our own RRG website, someone asked me how he could create the currency RRG that we have on the RRG site on StockCharts.com. I was already halfway through typing a response along the lines described above when I had one of these "Ahaaa moments". And sometimes solutions are soooooo simple :)
I sat down and had a good look at the code and the algorithms that we use for both the regular implementations of RRGs and the currency version and came to the conclusion that my "hunch" was correct. The way to "fix" the benchmark problem for currencies is to simply put in a static benchmark. A time-series that just holds the value "1."
Doing this will skip the relative strength calculations or better said it will not change the relative strength values that the various currency pairs already are. And StockCharts.com has such a symbol in its database; it is the ticker: $ONE
The result is a Relative Rotation Graph for currencies that shows the rotation of the various currencies around the USD (in this example) as the benchmark.
 Eureka! ... Well at least for me :)
The chart is a permalink, so when you click it, you will be able to open the live version (you have to have a valid StockCharts.com subscription).
What if you are a non-USD based investor?
Once you have the RRG chart setup, you can use all the controls to play around and for example change to a daily view to get a better handle on the shorter term moves.
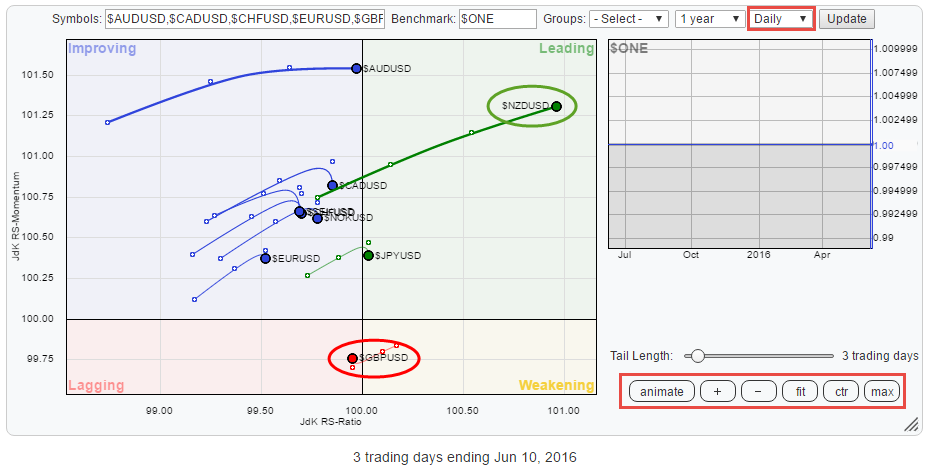 Click on the animation button of the live version to see that those currencies actually do rotate around their common denominator (USD).
This setup shows the currency rotation from the point of view of a USD based investor. In order to change the view to a GBP based investor for example simply change the ticker symbols to have GBP as the base.
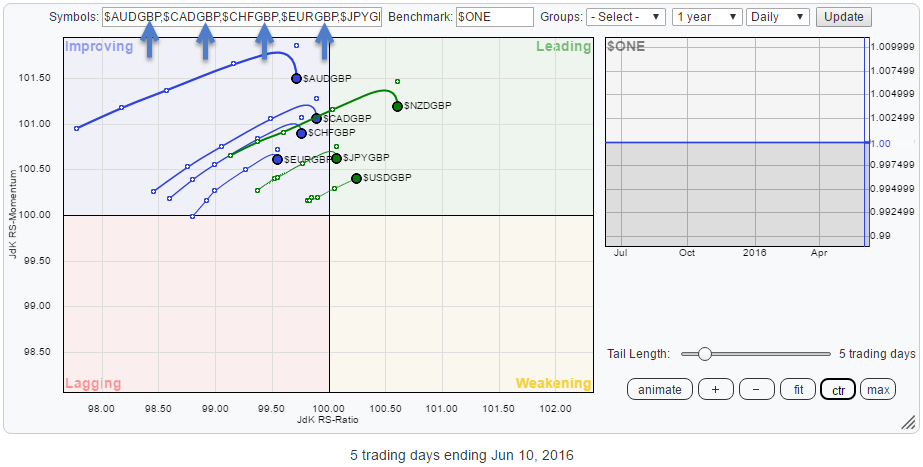 I am sure you will be able to figure out how to adapt the inputs for your specific currency of choice!
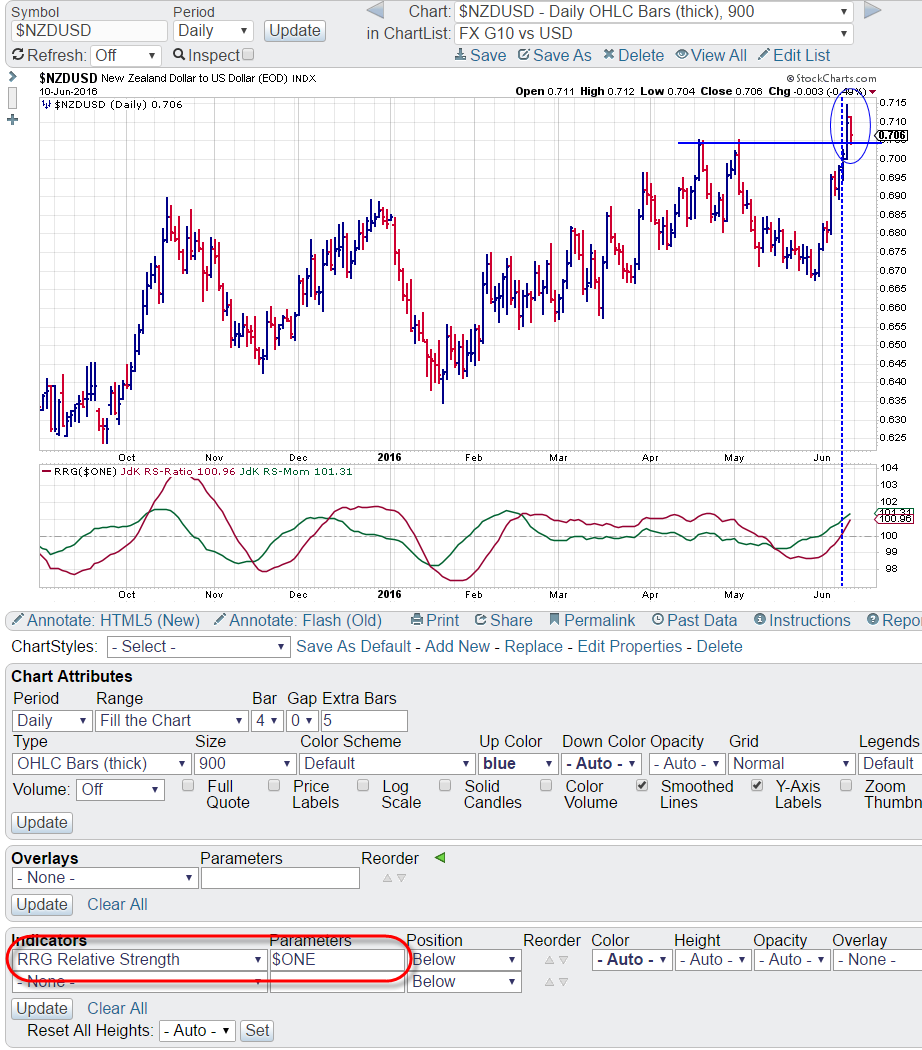
From the RRG you can work back and use the RRG-Lines on your regular charts using the same benchmark ($ONE). I have picked the chart of $NZDUSD as it really stands out on the daily RRG as the strongest currency against the USD.
Your thoughts?
As you may have been able to pick up, I am really excited about this new way to use RRGs on StockCharts.com, but I'd love to hear your thoughts and ideas in the comment section below to know whether you share my excitement or think "Yeahhh, whatever ....".
Julius de Kempenaer | RRG Research
RRG, Relative Rotation Graphs, JdK RS-Ratio and JdK RS-Momentum are registered TradeMarks by RRG Research
Follow RRG Research on social media:
LinkedIn Facebook Twitter


