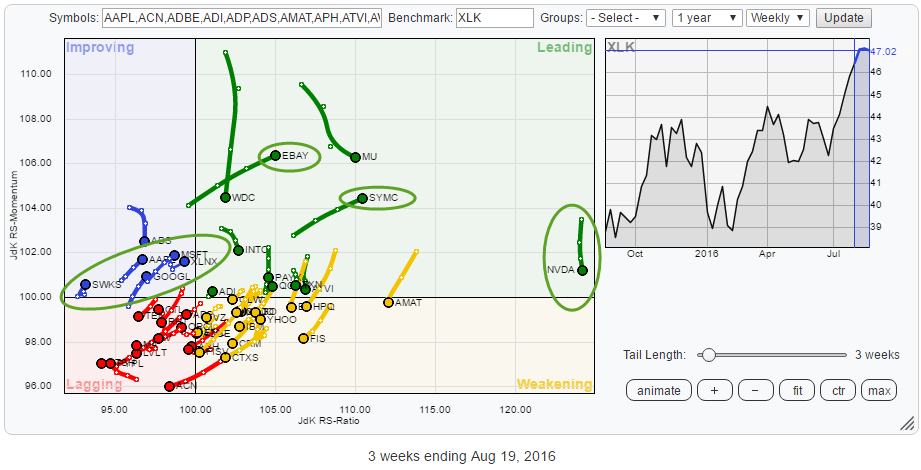
The technology sector, as represented by XLK, started to show some positive sector rotation over the past month and last week managed to crossover from the improving quadrant to the leading quadrant on the weekly Relative Rotation Graph.
Reason enough to check out the relative technical conditions for the stocks that make up XLK as shown on the Relative Rotation Graph below.
Summary
- Positive sector rotation for XLK
- Mature relative uptrends for EBAY, SYMC, and NVDA
- NVDA probably too risky at the moment
- EBAY expected to push higher
- SYMC all set for further rally but needs to clear resistance at $ 25
- Potential emerging for AAPL, GOOGL, and MSFT
- Improvement for AAPL starting to show, break above $ 110 will provide fuel
- GOOGL improving on relative but needs to break out of range
- MSFT cleared resistance and is now free to move higher
- FB starting to lag behind.
Quick scan
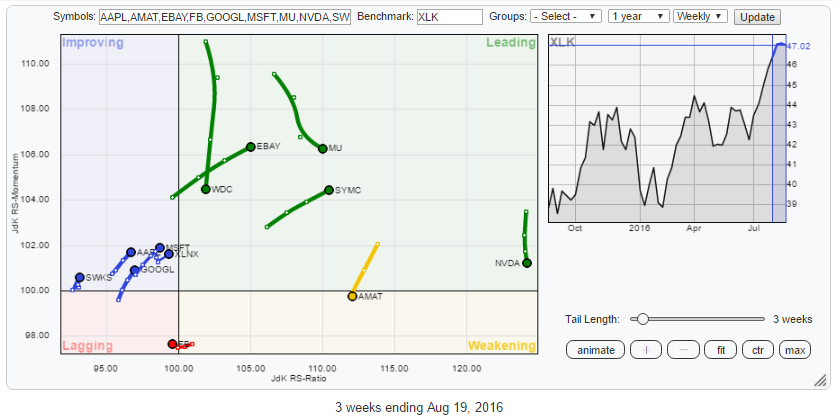
What catches my attention upon the first scan of the RRG above, is that the outliers, the stocks that are rotating far away from the benchmark, the center of the chart, are all inside the leading quadrant. Especially EBAY, SYMC and most definitely NVDA. Together with WDC, MU, and AMAT, these are the names that recently have been leading the way up for the technology sector and are now in mature relative uptrends against XLK.
Closer to the benchmark but still inside the improving quadrant are a few stocks that are heading NorthEast which means that they have the potential to be leading the next relative rally for XLK. They are highlighted inside the green oval, MSFT, XLNX, AAPL, GOOGL and to a lesser extend SWKS.
With big names like AAPL, MSFT, and GOOGL, seemingly on the move I was wondering where FB is positioned on the RRG. It appeared to be in the lower half of the graph just crossing over from weakening into lagging showing a very short tail.
The Relative Rotation Graph below only holds the mentioned stocks so their rotation can be seen in more detail.
The mature trends
NVIDIA Corp. - NVDA
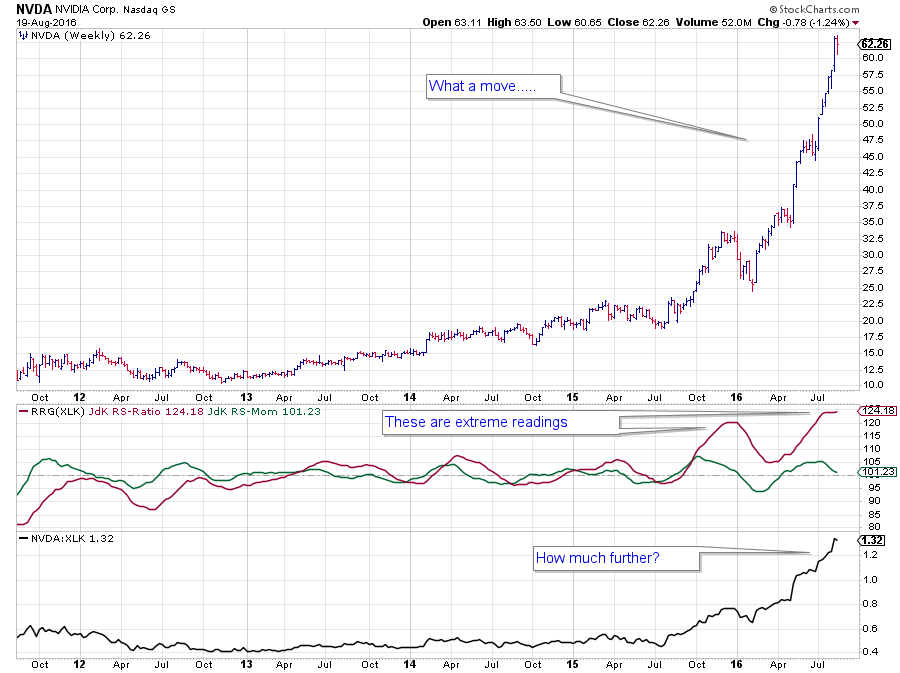 With a share price that doubled over the past few months, it is no surprise that NVDA is one of the strong (out-)performers inside XLK, but also inside the S&P 500.
The rice chart is moving up in an almost straight line out of the February low and is over stretched at any possible level. This makes it a high-risk investment to get into for the time being but a great position to hold on to for those who already own it as there may be more in store.
With trends like this, the downside risk is equally big as even a drop down to $ 45 will still keep the uptrend, higher highs, and higher lows, intact.
From a relative point of view, the RRG Lines picked up the relative uptrend back in September last year when the JdK RS-Ratio crossed above 100. The first months of 2016 were characterized by a pause in the RS-Lines itself, causing the RRG-Lines to come off and make NVDA rotate through the weakening quadrant from mid-January to mid-April, only to come back with a vengeance!
At the moment NVDA is coming off fast on the JdK RS-Momentum scale but still manages to keep its JdK RS-Ratio levels which makes this move look like a (temporary) setback within the longer-term uptrend.
Chasing NVDA higher from current levels looks to be too risky, but interesting buying opportunities may arise at lower levels, both relative and price.
eBay Inc. - EBAY
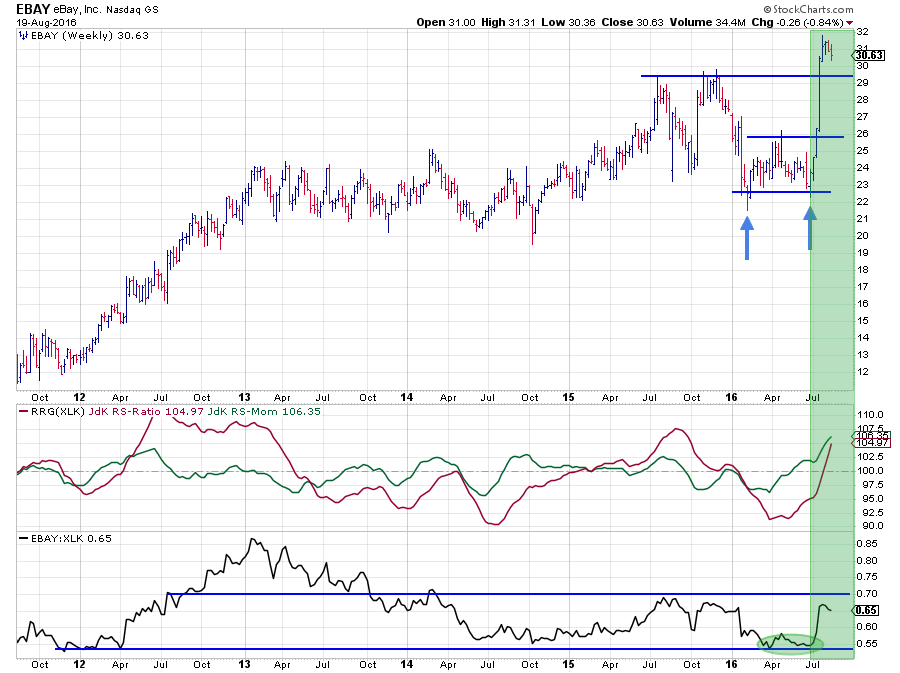 eBay's chart was not very exciting from 2013 onwards. On the price chart, the stock more or less traded sideways in a range between $ 20 - $ 25 until mid-2015 and then between $ 22 - 29 from mid-2015 until now. Over a few weeks time, EBAY rallied sharply. First completing a double bottom low in the $ 22 area and then shooting higher and breaking to new all-time highs by taking out the late 2015 peak just above $ 29.
On the relative chart that translated into a downtrend from early 2013 until mid-2014 and a sideways range ever since.
However, since a few weeks, the rotation of EBAY on the RRG is starting to grab some attention as the stock crossed into the leading quadrant and is now heading NE and pushing further into positive territory.
Symantec Corp. - SYMC
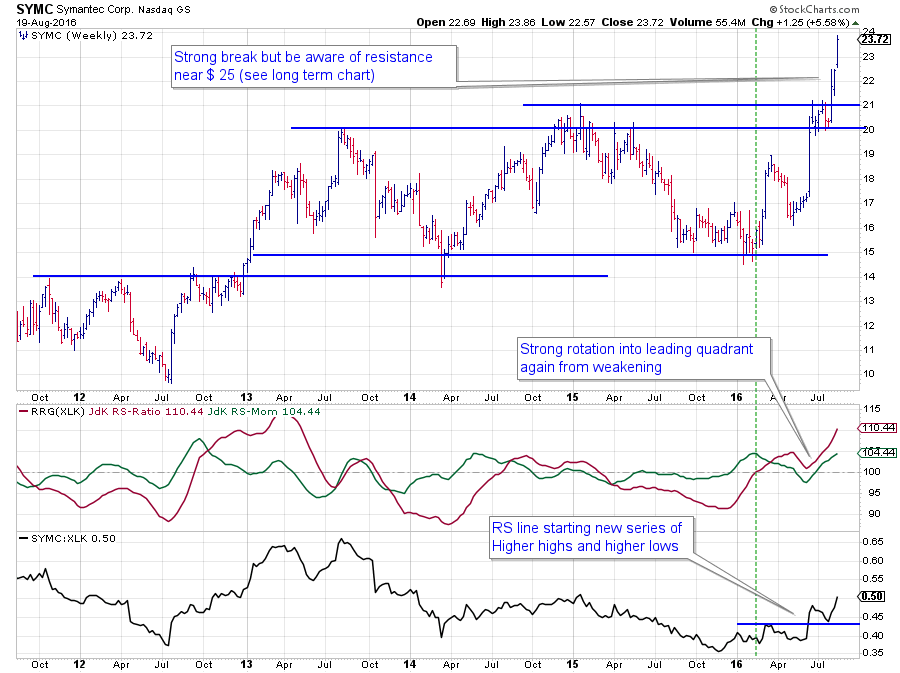 On the RRG, Symantec is positioned very well, inside the leading quadrant, and heading higher on both axes.
The improvement in relative strength was picked up y the RRG Lines back in February when the RS-Ratio line crossed above 100. After a short pause in the rally of relative strength during May-June, the rally continued. This pause caused SYMC to rotate through the weakening quadrant on the Relative Rotation Graph which is usually a strong sign.
The relative move started to accelerate when price broke out of its three-year range.
For the time being SYMC is all set for a further rally, the only caveat being resistance coming off an old price peak back in November 2004 around $ 25
The Emerging Trends
Apple Inc. - AAPL
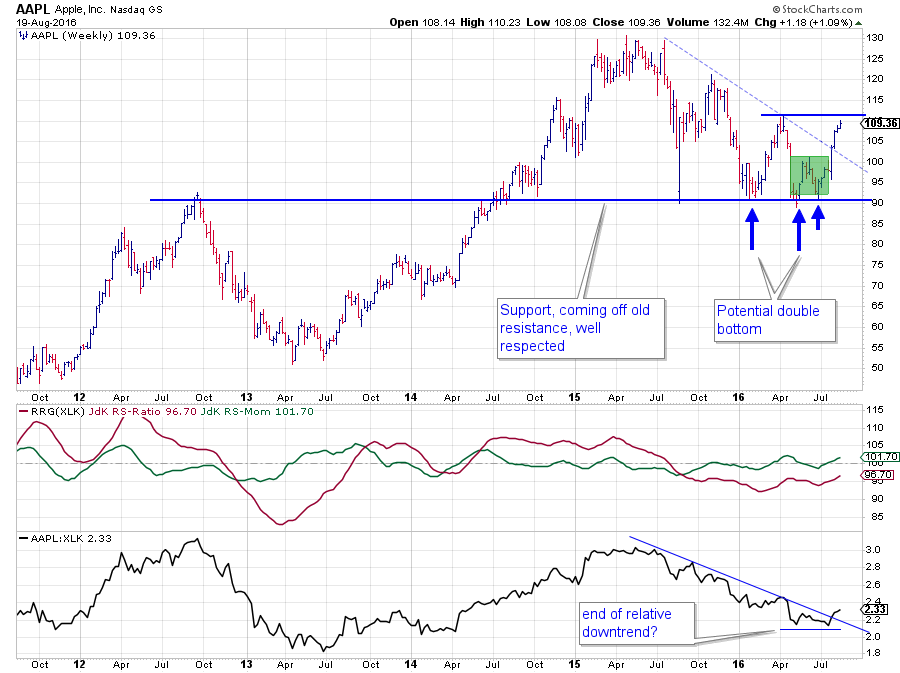 Since setting its peak(s) near $ 130 in the first half of 2015, the market has not been very friendly for AAPL. The chart is showing three lower highs which characterized the price pressure on AAPL. The first sign of improvement became visible in May when a second low was formed near $ 90. This seems to be an important price level for Apple as it has been touched six times over the past five years and continues to be respected, at the moment as support.
The second sign of improvement was the completion of the small double bottom at $ 90, highlighted in the green box and the second and third blue arrows. The stock is now moving higher to the price target, based on that small double bottom, near $ 110. In this move, the falling support line has been taken out which is the third sign of improvement.
From a relative perspective, things look almost similar. A double bottom has been completed on the RS-Line, and the falling resistance line has been broken upwardly. The JdK RS-Momentum line has already crossed above 100, pushing AAPL higher into the improving quadrant.
Especially a break above $ 110 on the price chart, completing the larger double bottom formation, is expected to push AAPL higher on both the price and the relative charts.
Alphabet Inc. - GOOGL
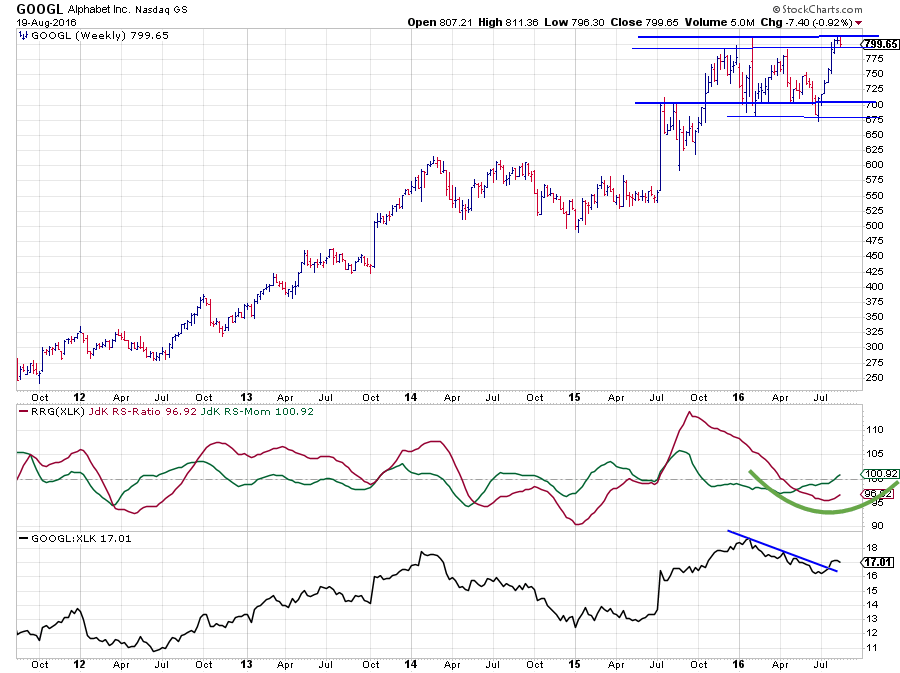
On the RRG, Alphabet is positioned close to AAPL and moving in the same direction. On the chart, however, things look a little different.
Alphabet set its highs at the end of last year and, one spike, early in this year but never really started a downtrend. GOOGL managed to stay in a sideways range between $ 675- $ 800 and currently price is pushing against the upper boundary.
During a period where the general market and XLK gained, the sideways move caused the relative strength line to drop and show a downtrend, pulling the JdK RS-Ratio below 100 which made GOOGL rotate through the weakening nd lagging quadrant.
The recent improvement of relative momentum has pushed JdK RS-Momentum back above 100 and rotate Alphabet into the improving quadrant.
The relative position for Alphabet inside the technology sector is definitely improving, but the risk here is the possibility that resistance around $ 800 will NOT be broken upwardly, and the price starts to drop again within the boundaries of the range causing the relative improvement to stall.
Microsoft Corp. - MSFT
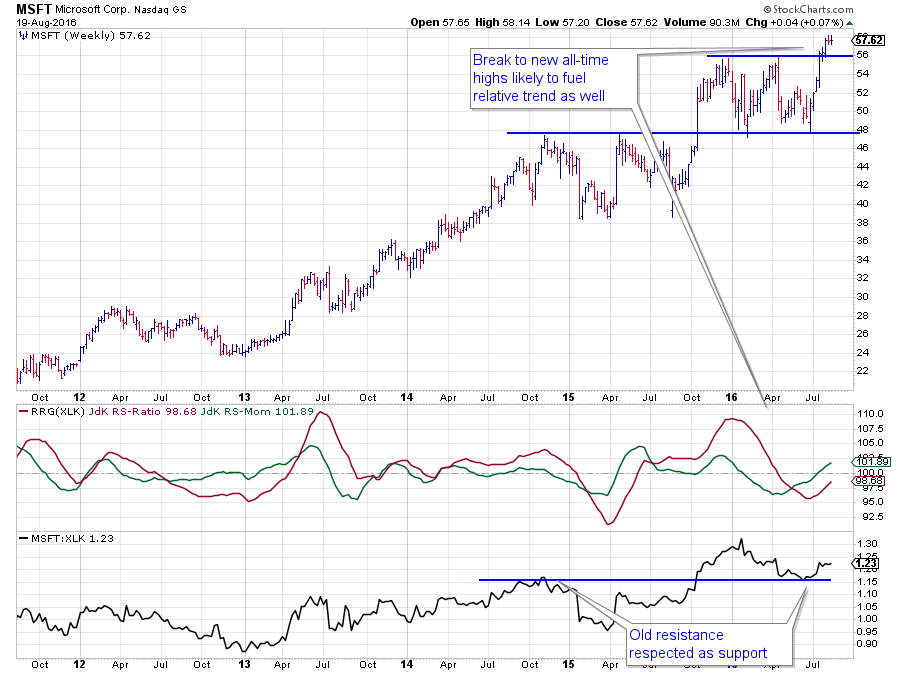 Microsoft is another stock very close to AAPL and GOOGL on the Relative Rotation Graph and moving in the same direction. Again with a slightly different chart.
Microsoft is showing a chart fairly similar to GOOGL. High set at the end of 2015 and then a sideways move in a trading range, $ 48 - $ 56 in this case.
The big difference is that MSFT already managed to break out of this range, which gives it a big advantage and a head-start over GOOGL and AAPL. This break mitigates the downward risk for MSFT to its former resistance level near $ 56 for the time being.
Hence from a risk/reward point of view, out of these three stocks, I would prefer MSFT as it already managed to clear its overhead resistance and is now free to move higher.
The odd one out
Facebook Inc. - FB
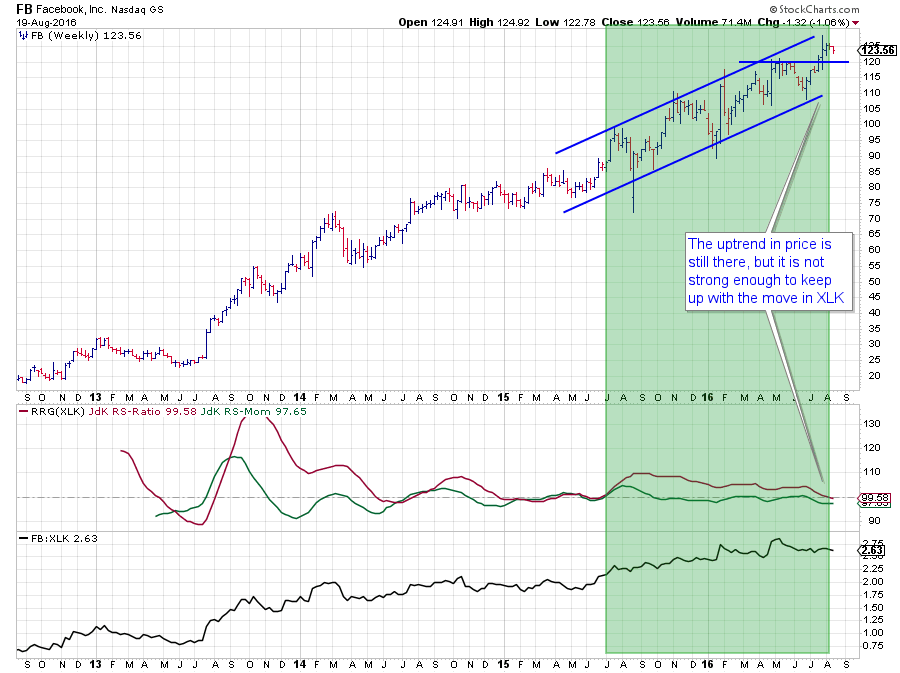 Where AAPL, GOOGL, and MSFT, moved lower or in trading ranges over the past six to nine months, Facebook kept on moving higher inside a very well-defined trend channel. And this trend channel is still intact and recently confirmed when FB broke above $ 120.
After a move in line with XLK from roughly mid-2014 to mid-2015 FB started to outperform the sector in July 2015 at a very steady pace. The JdK RS-Ratio remained well above the 100 level (indicating a relative uptrend), and the JdK RS-Ratio moved around 100 which indicates a very stable, not accelerating nor decelerating, trend.
Because of the acceleration in the price of XLK (the sector) the steady pace in FB is now not enough anymore to keep the stock in the leading quadrant or on the right-hand side of the plot. This is a good example of a stock which continues to go up in price but simply cannot keep up with its benchmark.
The simple conclusion is that, after a nice period of outperformance of FB inside the Technology sector, there are now other stocks taking the lead.
Julius de Kempenaer | RRG Research
RRG, Relative Rotation Graphs, JdK RS-Ratio and JdK RS-Momentum are registered TradeMarks by RRG Research
Follow RRG Research on social media:

