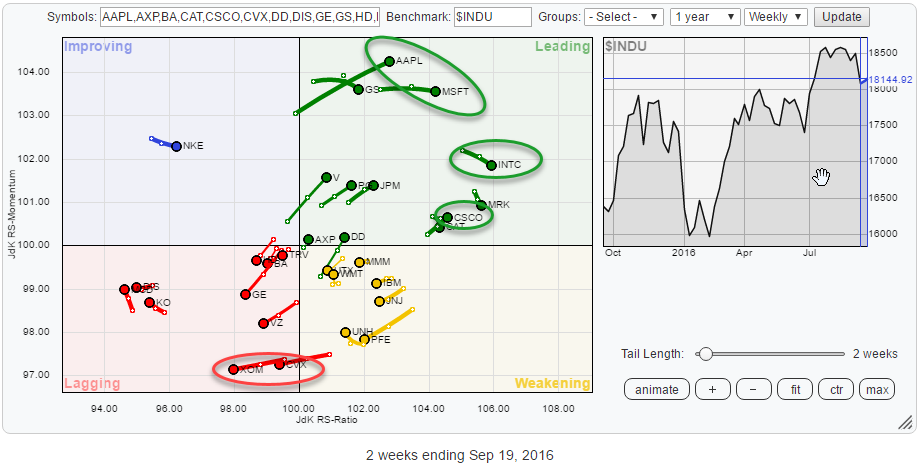
The Relative Rotation Graph below holds the components of the Dow Jones Industrials index vis-à-vis the $INDU index.
The one observation that immediately stands out to me is the domination of technology stocks inside the leading quadrant. AAPL, MSFT, INTC, and CSCO are all positioned well inside the top right-hand quadrant, indicating that they are in (mature) relative uptrends against $INDU.
Summary
- Energy sector lagging
- XOM in downtrend on price- and relative charts
- CVX about to complete H&S top formation
- Cyclicals weak(ening)
- HD completes rising wedge and rotates back into lagging quadrant
- Financials improved, four out of five stocks (in Dow universe) inside leading quadrant
- V set for strong rotation further into the leading quadrant
- Tech stocks dominate the leading quadrant
- AAPL on the move after weak 12-month period
- CSCO breaking to new highs, offering good potential
- Volume pattern and divergences are not backing up a general market rally
Quick scan
After the initial observation on the positive domination of technology stocks inside the Dow Jones Industrials index the second thing that catches my eye is the improvement of financials over the past couple of weeks and the fact that they now seem well positioned for some more outperformance.
GS entered the leading quadrant at a high JdK RS-Momentum level while V and JPM are moving higher on both axes at a positive heading (around 45 degrees) suggesting that there is more to come.
On the negative side, energy stocks XOM, and CVX have just crossed over into the lagging quadrant suggesting that new relative downtrends are underway. Also, the stocks in the Cyclicals / Consumer Discretionary sector are not looking too strong at the moment.
Energy sector
XOM and CVX are the two energy stocks inside the Dow Jones Industrials universe. They both just crossed over into the lagging quadrant and are showing weak(ening) charts.
Exxon Mobil Corp. - XOM
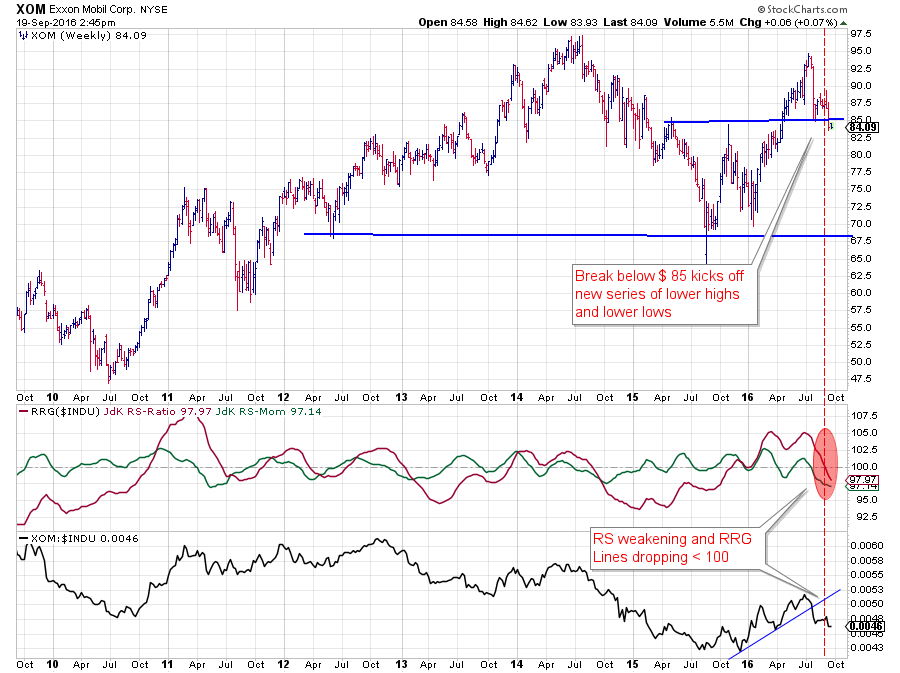
The relative improvement of XOM since the beginning of the year seems to have come to an end. During the transition from 2015 into 2016 RS of XOM against $INDU turned for the better causing the RRG-Lines to cross above 100 and signal a relative uptrend. In April price followed by breaking above the important $ 85 resistance level.
After peaking around $ 95 things started to weaken for XOM. The price dropped back to $ 85 which acted as support now and managed to catch the decline but only for a short period. The recent break back below $ 85 caused the start of a new series of lower highs and lower lows with plenty of room to drop further now.
The raw RS line already broke below its rising support line a few weeks ago, and now the RS-Ratio line has also dropped below 100 signaling that a new relative downtrend is underway against $INDU.
XOM is now in a downtrend on both the price- and the relative charts and has very limited upward potential due to the horizontal barrier around $ 85 which is likely to cap any rallies.
Chevron Corp - CVX
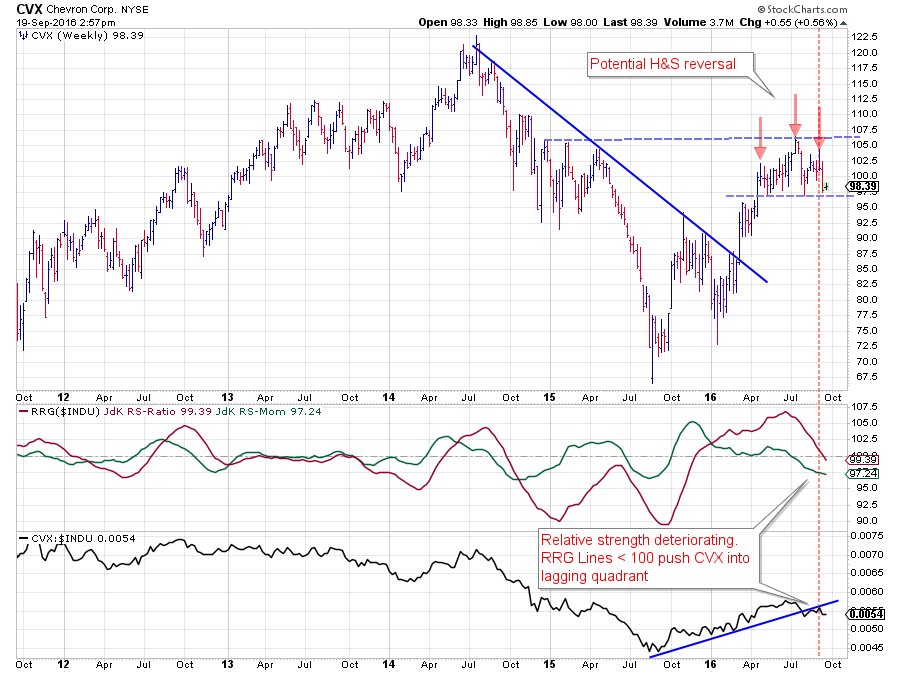
CVX was a bit earlier in its improvement, compared to XOM, at the end of 2015 but in line with the sector went through a strong positive rotation during the first half of 2016.
After rallying to a high near $ 105, CVX seems to be tracing out a small H&S reversal pattern on the price chart with the neckline near $ 97.50. A break of this neckline completes the pattern and will likely trigger a move down towards the $ 90 area.
From a relative perspective, the raw RS-Line broke its rising support line a few weeks ago, and just recently the RS-Ratio line has fallen back below 100, indicating that a new relative downtrend may be underway.
The relative weakness is clear for CVX, a break below the neckline will be the catalyst for a drop in price as well.
Cyclicals / Consumer Discretionary sector
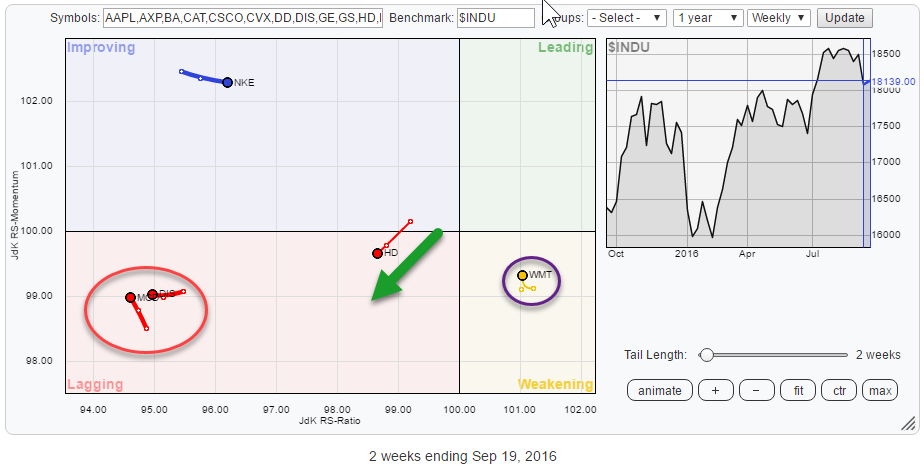 There are five Consumer Discretionary stocks in $INDU which I have singled out on the RRG above. MCD and DIS are deep inside the lagging quadrant and therefore in mature relative downtrends against their benchmark. NKE went through a recovery rotation but is already starting to loose relative momentum again. WMT seems to be the only cyclical stock that can escape the general weakness for this sector.
The stock with the weakest outlook, i.e., the highest risk for the moment, seems to be HD as it briefly rotated through improving but is now crossing back into the lagging quadrant at a negative (Southwest) heading.
Home Depot, Inc - HD
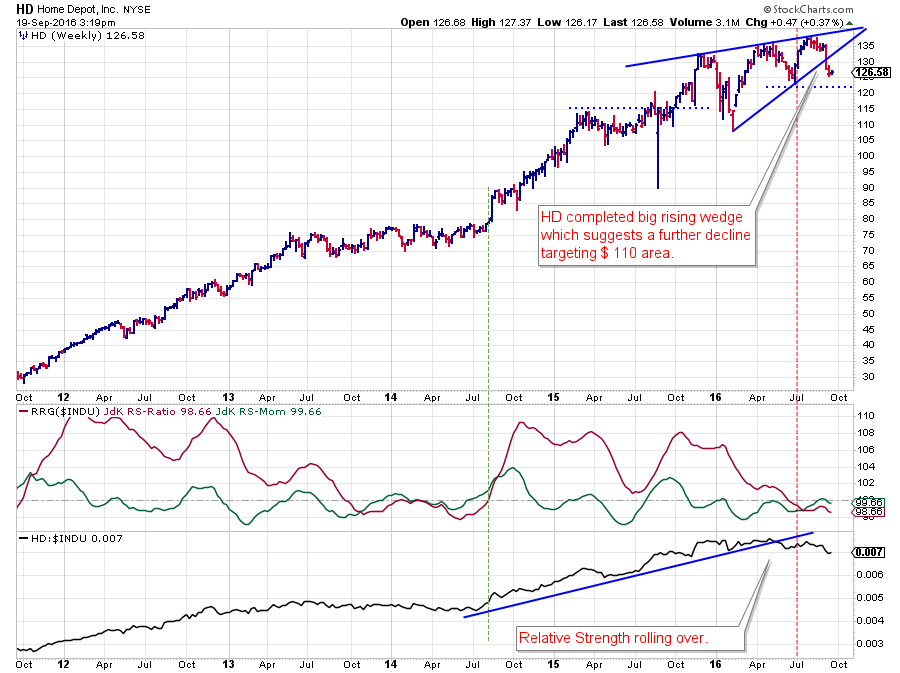
The pattern that has been formed on the price chart of HD since the beginning of the year looks to be a large rising wedge which has recently been broken to the downside.
Following the rules of this pattern, a further drop in price may now be expected to target the base of the formation which is near $ 110.
The relative strength of HD versus $INDU had started to weaken a few months earlier already. Back in May, the raw RS-Line dropped below its rising support line while the JdK RS-Ratio line dropped below 100 at the start of July.
This means that the downward acceleration in price, following the completion of the wedge pattern, is likely to fuel the relative downtrend that is already underway.
Financials sector
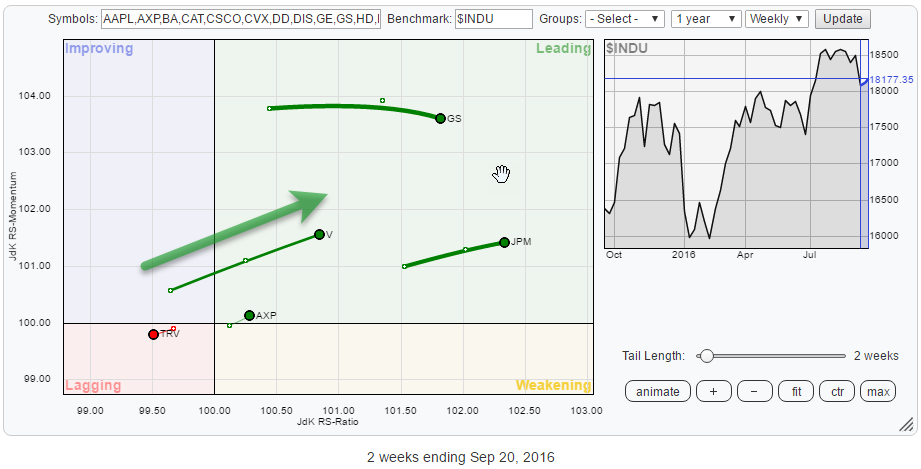 The recent improvement of the financial stocks inside the Dow Industrials index can clearly be seen on the RRG above. Four out of the five financials are inside the leading quadrant and pushing higher on the JdK RS-Ratio axis which means that they are still gaining relative strength. The only stock lagging this development is TRV.
Out of the four stocks in the leading quadrant, I have picked V as the stock which currently seems to have the best potential.
Visa Inc. - V
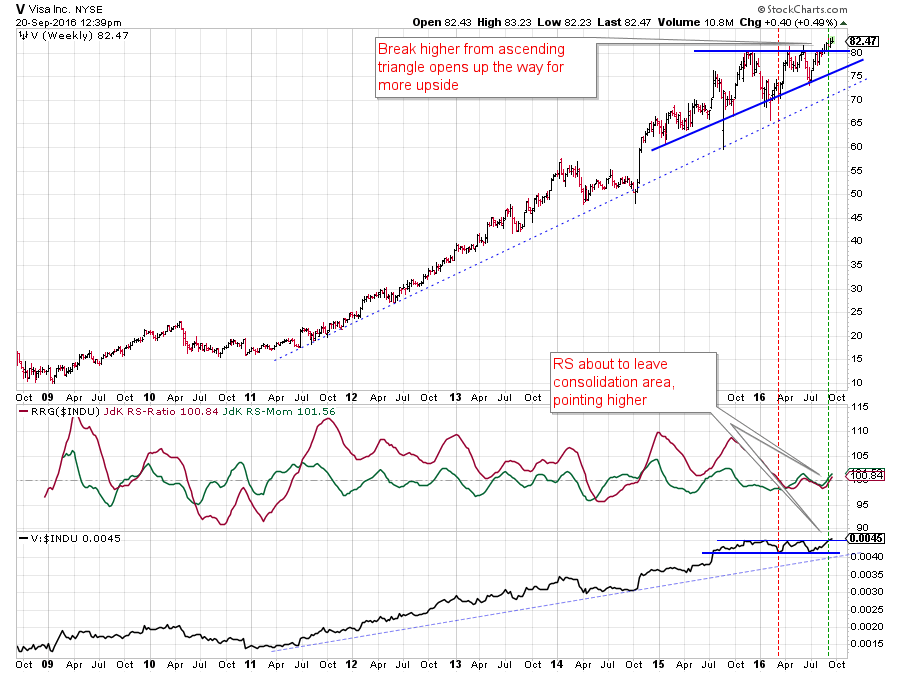
The overall trend for Visa, in general, is positive since 2011. This goes for both the price and the relative charts. There has been a little hiccup in the first half of 2014 and a sideways move in price that started in Q4-2015 causing relative strength to move sideways in a narrow band as well.
The sideways move in RS has caused the RRG-Lines to come back and hover around the 100-level for a few months.
During the consolidation, a large ascending triangle has formed on the price chart with a rising support line connecting the important lows since early 2015 as the lower boundary and a horizontal resistance line running over the peaks around $ 80 since November 2015.
The recent break above this barrier near $ 80 completed the triangle and triggered a continuation of the longer-term uptrend.
At this moment the improvement on the price chart is starting to impact the relative strength as well. Both RRG-Lines are back above 100 again and the raw RS-Line is pushing against its horizontal resistance level, making Visa one of the more interesting, financial, stocks inside this universe.
Technology sector
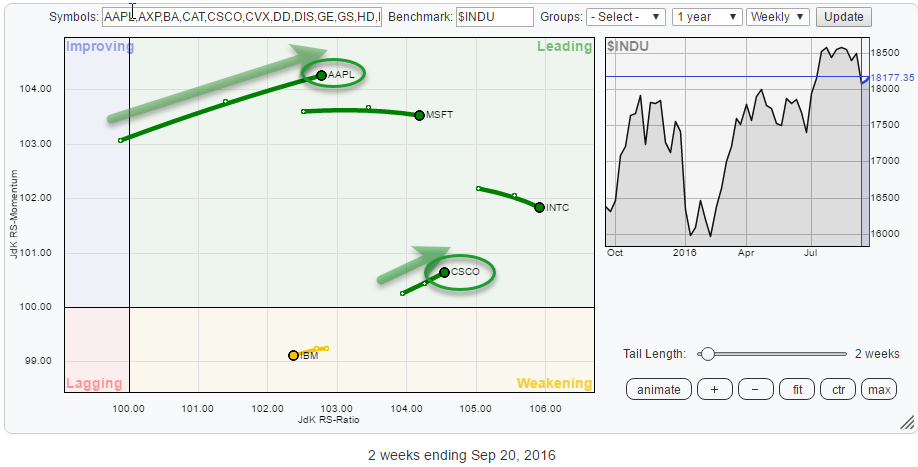 As the title of this blog says, tech stocks are dominating the leading quadrant. Four out of the five tech stock inside the Dow Industrials are, deep, inside the leading quadrant, and they are all pushing higher on the JdK RS-ratio axis. MSFT and INTC have started to lose a bit of relative momentum but nothing to worry about yet. AAPL and CSCO are still on a positive heading and gaining on both axes.
The only stock lagging this positive development inside the tech sector is IBM although it is still at a relatively high RS-Ratio reading but inside the weakening quadrant.
Apple, Inc. - AAPL
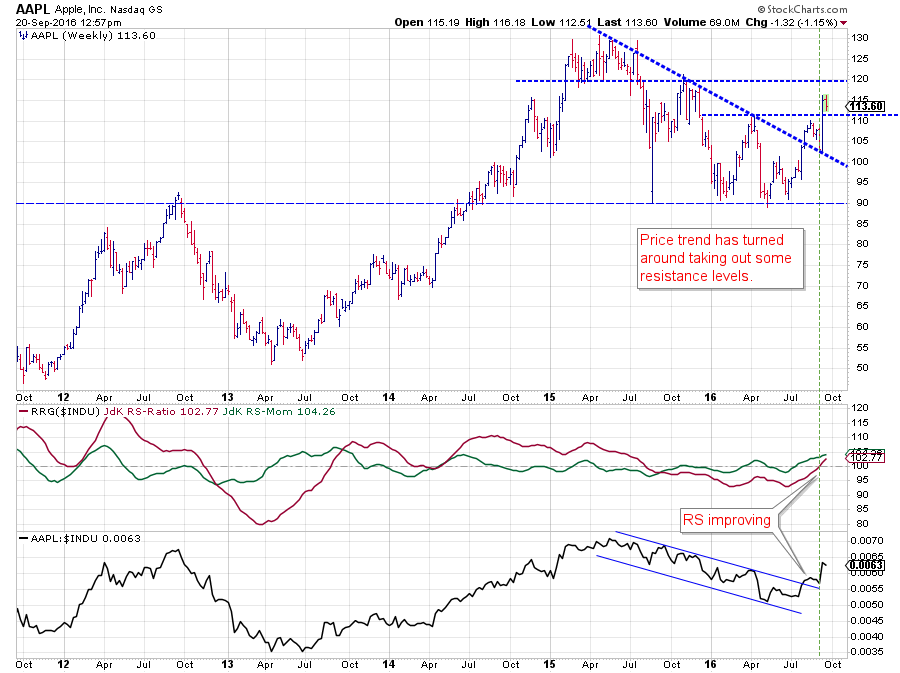
All eyes on AAPL again. Since setting a peak near $ 130 in the first half of 2015 AAPL worked its way lower on the price chart and tested the horizontal support level near $ 90 (coming off 2012 peak). During this whole period, the stock underperformed the Dow Jones Industrials index causing the RS-Line to move in a downtrend (see lower panel in the graph above).
A few weeks ago things started to turn around for AAPL. The falling resistance line on the price chart was taken out and after a short pull-back, the intermediate resistance level near $ 110 was broken as well. This means that the downside for AAPL is now well protected around $ 110, and next resistance is coming in around $ 120.
The improvement in price is impacting relative strength as well. The downtrend in the raw RS-Line has been reversed, and the RS-Ratio line just followed the RS-Momentum line above the 100 level, positioning AAPL well inside the leading quadrant.
Especially when resistance near $ 120 can also be taken out things are starting to look good again for AAPL.
Cisco Systems, Inc. - CSCO
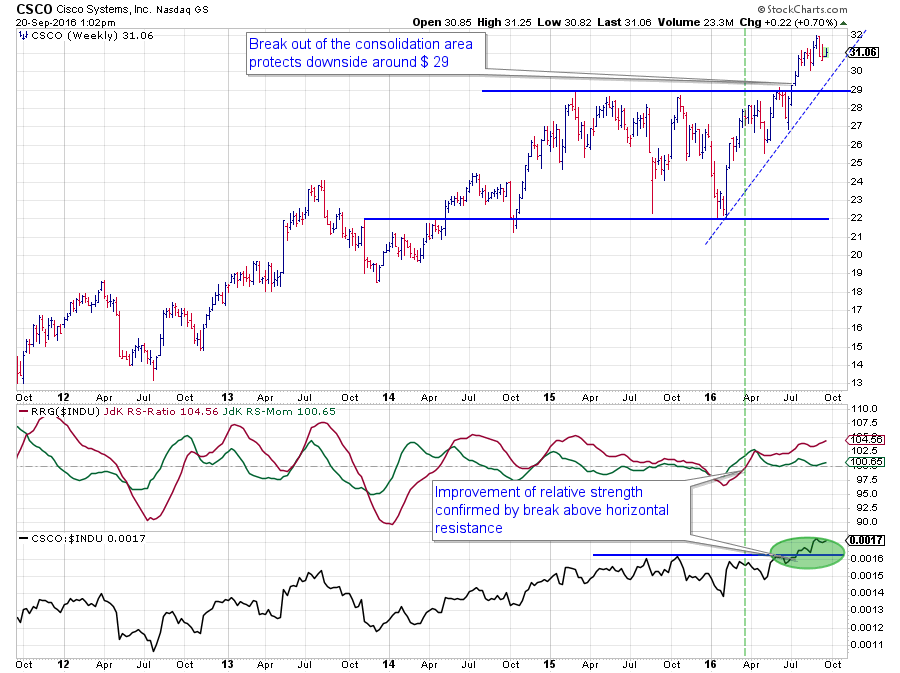 Out of the five tech stocks in this universe, CSCO has a very interesting chart to watch.
The improvement in relative strength started already back in March when the JdK RS-ratio crossed above the 100 level. Due to a lack of relative momentum at that time CSCO remained inside the leading quadrant but did not really take off.
This changed in July when price managed to break above the $ 29 resistance level and relative strength, at the same time, broke above its horizontal resistance.
The break above $ 29 is especially important as this is a resistance level that comes off the late 2007 peak which served as resistance four times in the past year.
The combination of breaking to new highs on price- as well as relative charts, probably makes CSCO the tech stock with the best potential for the time being within the $INDU universe.
Dow Jones Industrials - $INDU
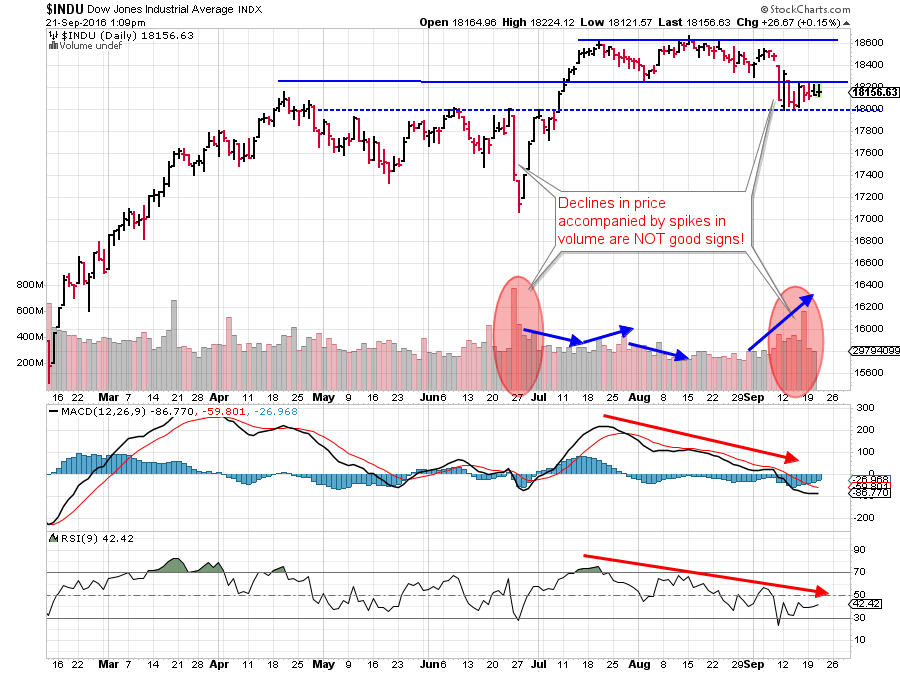 Despite the strong rotational patterns for technology and financials, the outlook for the overall market, in this case, the Dow Jones Industrials index, still worries me.
After the break to new highs, the rally stalled near 18.600 and never got the follow through that would be expected following such a move. Over the past two months, the RSI and MACD indicators are showing a very strong negative divergence with the price chart which is not supportive for a further rally.
But above all, the break in July took place at low volumes while the recent spikes in volume (June and September) occurred in conjunction with price declines while the general volume pattern is falling on rallies and rising on declines.
All in all, for me, there are too many red flags at the moment to justify a broad market rally while downside risk seems to outweigh the current upside potential for the broader market indices.
ChartCon 2016
Only a day and a half before ChartCon 2016 kicks off. I am already in San Francisco and just finished writing this article tucked away in the lobby of the Hilton Union Square. This afternoon I will make my way to Napa to join the StockCharts crew and the other commentators to prepare for the big event.
If you have not done so yet, there is still time to register and attend all the presentations on our live stream on Friday and Saturday 23/24 September.
I am looking forward to "see you" online. My presentation on RRG is scheduled on Saturday 24th at 10:30am ET
Julius de Kempenaer | RRG Research
RRG, Relative Rotation Graphs, JdK RS-Ratio and JdK RS-Momentum are registered TradeMarks by RRG Research
Follow RRG Research on social media:

