 From a 100 degrees in beautiful Napa, via 70 degrees in Boston and New Hampshire, back to 50 and dropping in Amsterdam.
 That pretty much sums up the excitement level that surrounds my ChartCon 2016 experience of last month!
Btw. In case you are wondering, the stop-over in Boston was because one of my daughters lives there. We went on a road trip to the White mountains in New Hampshire and drove along the Kancamagus highway which provided us with some stunning views of the trees changing their colors. Almost as stunning a visual as a Relative Rotation Graph ;)
During my talk at this online event, which all of you who attended can still replay on Livestream, I encouraged you to send in any questions and/or remarks using any of the social media channels or the special ChartCon Guidebook app ....
And so you did ..... In this post, I will try to address most of your questions and remarks. A promise is a promise you know.
Q: I often hear on CNBC, money is rotating out of one sector and into another. Will RRG help spot the rotations that CNBC talks about.
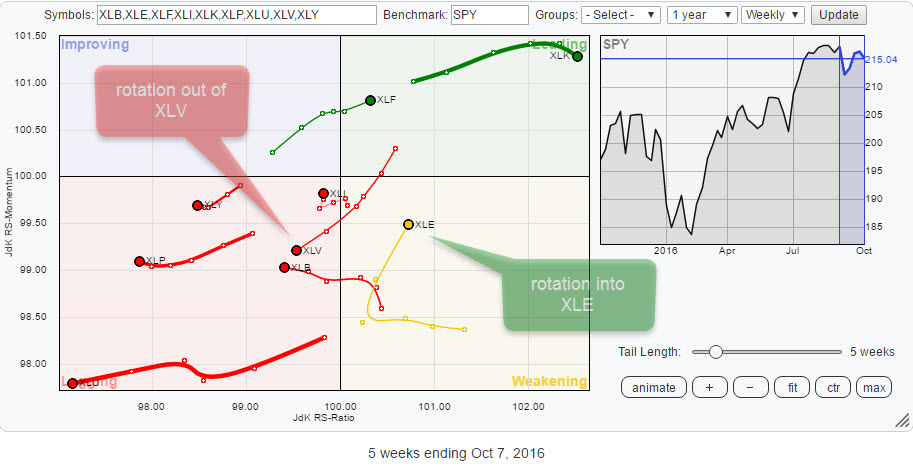
A: Yes, most definitely. Relative Rotation Graphs are the visualization of the money rotating from sector to sector over time. The RRG below shows the current state of affairs and clearly visualizes, for example, the current rotation of money (=relative strength) out of the Health Care sector (XLV) into the Energy sector (XLE).
Q: How do you think about using RRG for swing trades?
A: I think RRG can be very well used to help you spot swing trading opportunities.
To elaborate a bit further on this topic I first looked up the definition of a swing-trade. Although I do know the term and what it implies I had never actually written it out in words, so here you go. This definition comes from Wikipedia but it closely matches numerous other definitions of the same term.
Swing trading; is a speculative activity in financial markets where a tradable asset is held for between one and several days in an effort to profit from price changes or 'swings'. A swing trading position is typically held longer than a day trading position, but shorter than Buy and hold investment strategies that can be held for months or years. Profits can be sought by either buying an asset or short selling.
As swing trading typically concerns shorter term trades I would suggest using the daily time frame on RRGs as it will give more granular and therefore faster 'signals'. Obviously with a shorter shelf-life for the ensuing move, but that is what we are looking for in this case.
Based on the research with regards to RRG-headings as I presented it during ChartCon I would be on the lookout for securities that are turning into the 0-90 degrees area for long positions and for short positions into the securities that move into the 180-270 area.
These could be stand alone trades or pair-trades against each other. Please make sure that you follow your (own) workflow with regards to the instrument selection and the final trade-implementation including the risk parameters etc. as you would do with any other trades. Always keep in mind that RRG, like any other chart, is a tool, it is not a guarantee... Just saying ;)
Q: Is RRG available on shorter time frames like hourly? If not, will it become available in the future?
A: RRGs can definitely be used on intraday time frames like hourly and add value to the process of short(er) term traders. Will it become available in the future? ..... Stay tuned!
Q : If I want to use RRG for commodities would you recommend it vs SPY or vs the USD as the benchmark?
A : Neither .....
Let me first address the "USD". As I explained in my ChartCon talk when I discussed running RRGs on currency universes, there is no such a thing as "The" USD.... It is always expressed in another currency or another currency is expressed un USD. So would it be commodities against EUR/USD or commodities against USD/JPY ....
Anyway, neither of those would make much sense IMHO. Along the same line comparing a universe of commodities with an equity index would be comparing apples and oranges.
The proper way to look at commodities on RRGs, at least in my view, would be to compile a list of commodities and compare those to a general or broad(er) based commodity index.
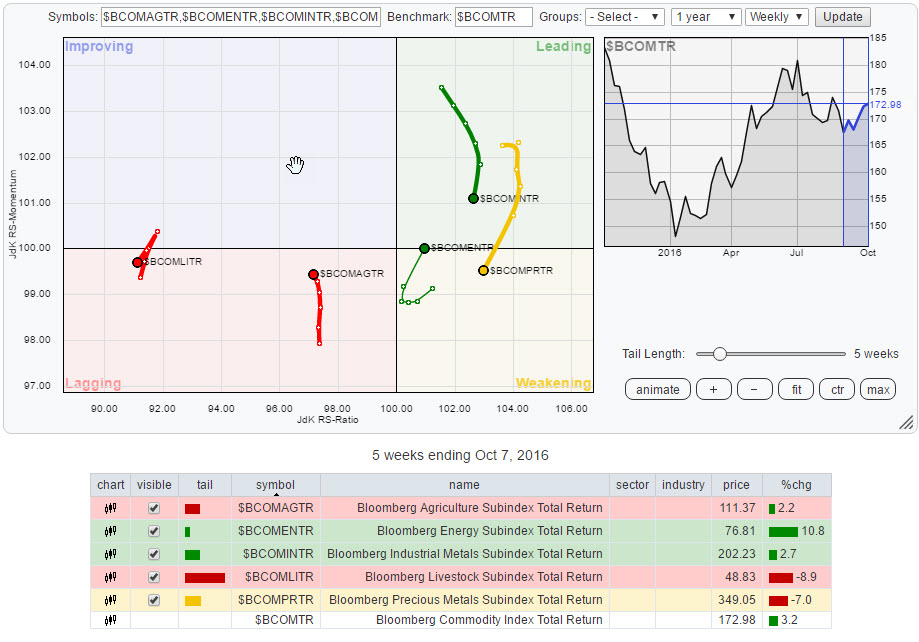
The first RRG below shows a number of Bloomberg commodity sub-indices and uses the general Bloomberg commodity index as ts benchmark.
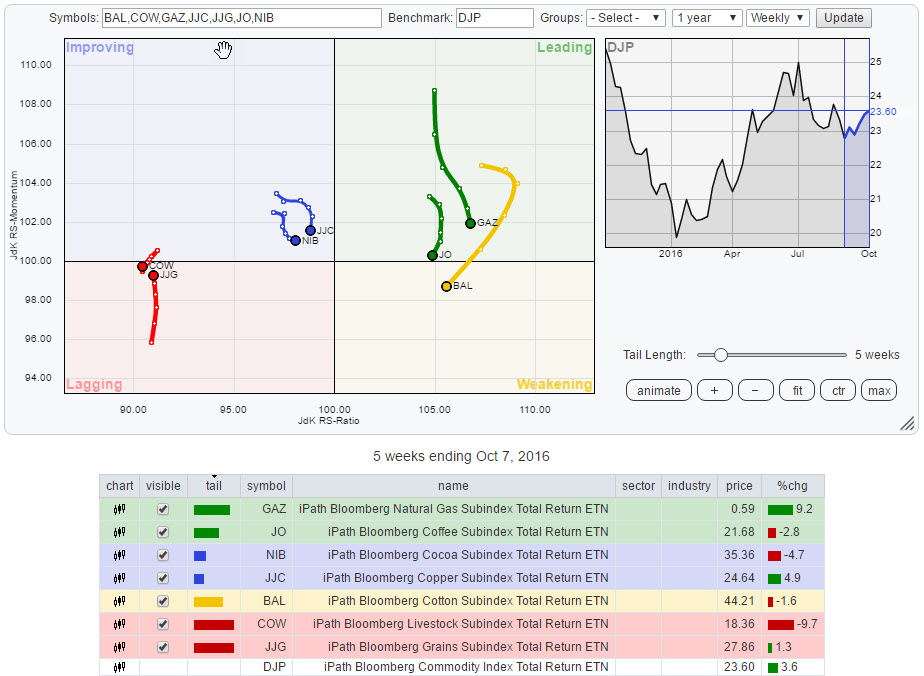
The second RRG below uses a universe of commodity ETFs based on these Bloomberg commodity indices
I am working with the StockCharts team.com to re-organize the drop-down menu with pre-populated universes for RRG to include a good setup for commodities.
Q : Is the size of the trail on a sector or a stock related to the magnitude? in other words, is a tighter formation stronger and a larger formation weaker or the opposite?
A : Long tails indicate a strong move, short(er) tails indicate a more stable move. As such the tail length can also be used as a gauge for volatility. This ChartSchool article addresses this issue and this blog post illustrates the meaning of tail lengths using some, actual at that time, graphs.
Q : Regarding the weekly and the daily questions: to understand better the time frame. Which momentum period and which ROC period do yu use for your indicators. I learned to understand that it's important to use right time frames for different stocks.
A : There is no straightforward "numeric" answer to this question as the RRG algorithms are trying to pick up and digest relative trends in various stages and the parameters "under the hood" are closely related and depending on each other.
The "rule of thumb" that I have always used in my communication to the institutional investors that I am working with is that a "change of trend", very roughly described as a move from the left side of the RRG to the right and vice versa, is likely to remain in force at least 3 months when using a weekly time frame. Translating that to daily would come down to 12 days or just shy of 3 (trading) weeks.
The questions above, some taken verbose, some in an aggregated format address the most important ones coming from ChartCon 2016. As usual, if you have any questions of your own, or when you have any other remarks, please drop them in a comment below this post or reach out via mail or one of the social media channels and I'll try to answer as fast and as good as I can.
Julius de Kempenaer | RRG Research
RRG, Relative Rotation Graphs, JdK RS-Ratio and JdK RS-Momentum are registered TradeMarks by RRG Research
Follow RRG Research on social media:


