Quick scan
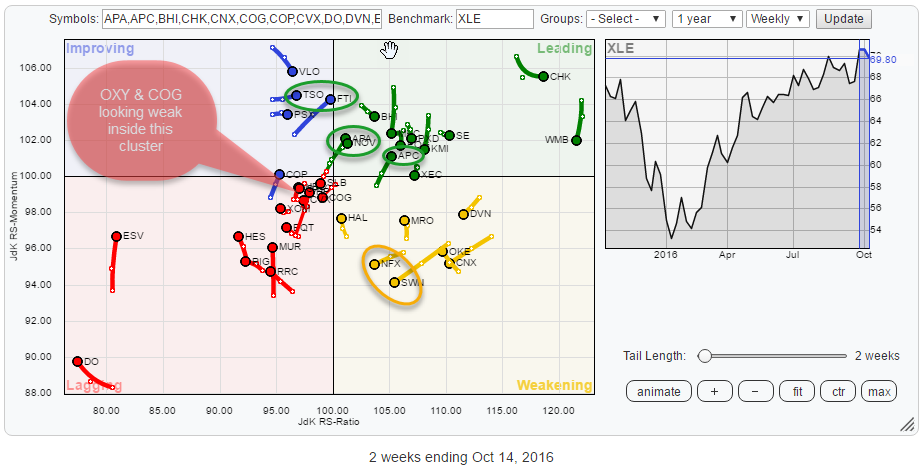
The Relative Rotation Graph above shows the rotation of the various members of the S&P Energy sector against XLE as a benchmark.
As usual, there are some good and some not so good names found on the plot. Inside the weakening quadrant, NFX and SWN are heading for the lagging quadrant. Already inside this lagging quadrant, we find OXY and COG showing less favorable tails, suggesting a further move into negative territory.
On the positive side, we find TSO and FTI, still inside the improving quadrant but, close to crossing over into leading.
Already inside leading, APA, NOV, and APC seem positioned for (further) outperformance of XLE in coming weeks.
Summary
- Energy sector improving rapidly
- General market (SPY) remains vulnerable (risk-off)
- OXY and COG heading deepr into lagging quadrant, facing further underperformance vs XLE
- NFX and SWN heading rapidly towards lagging quadrant.
- FTI is turning relative trend around and pushing into leading quadrant
- APA and APC ready to move higher against XLE in coming weeks
At sector level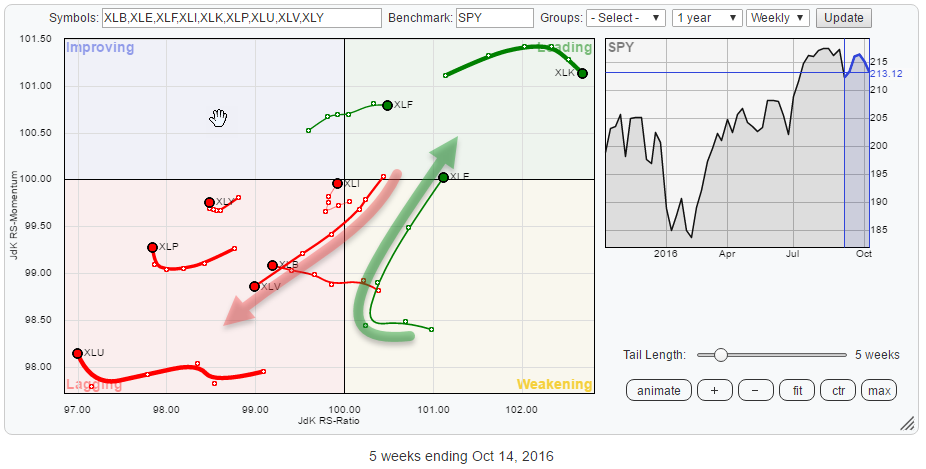
At a sector level, XLE is one of the sectors that catches the attention at the moment. Following a positive rotation inside the weakening quadrant, the tail started to accelerate and is now close to crossing over into the leading quadrant (again).
Usually this is a strong sign, and this time seems to be no different.
The sector probably most opposite of the positive rotation in Energy is Health Care. Following a seven-week rotation through leading, XLV accelerated into the lagging quadrant at increasing velocity, looking poised for more weakness in coming weeks.
The situation with only a few sectors in the leading quadrant, XLK and XLF now joined by XLE, continues to worry me. It means that "the market" is only backed by these sectors wth XLK (the biggest sector in the S&P) already starting to roll-over, albeit at very strong JdK RS-Ratio levels.
Another issue that continues to keep me in a, more or less, "risk-off" mode is the lack of volume on the upside while "elevated" volume occurs on down-days.
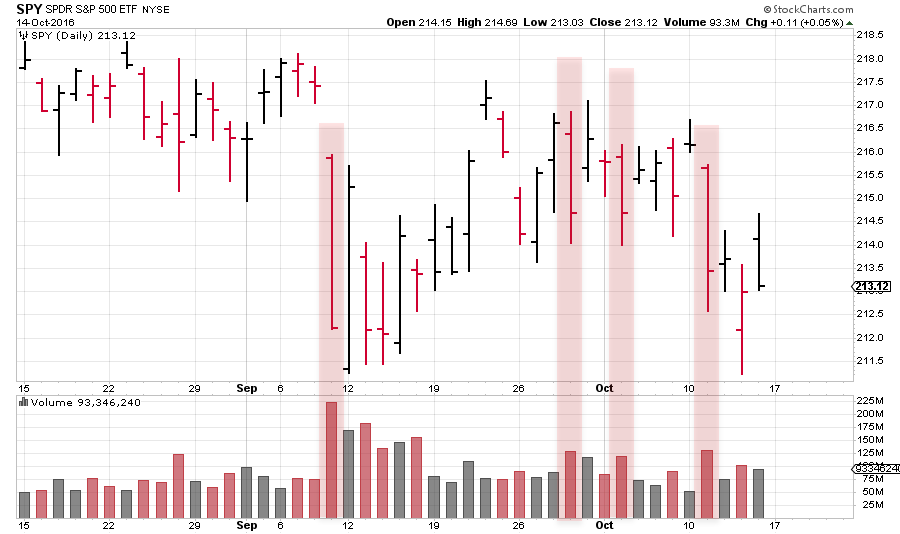 Reason enough to explore the Energy sector in more detail to find out which stocks are likely to outperform the Energy sector as well as the market as a whole.
The LAGGING quadrant
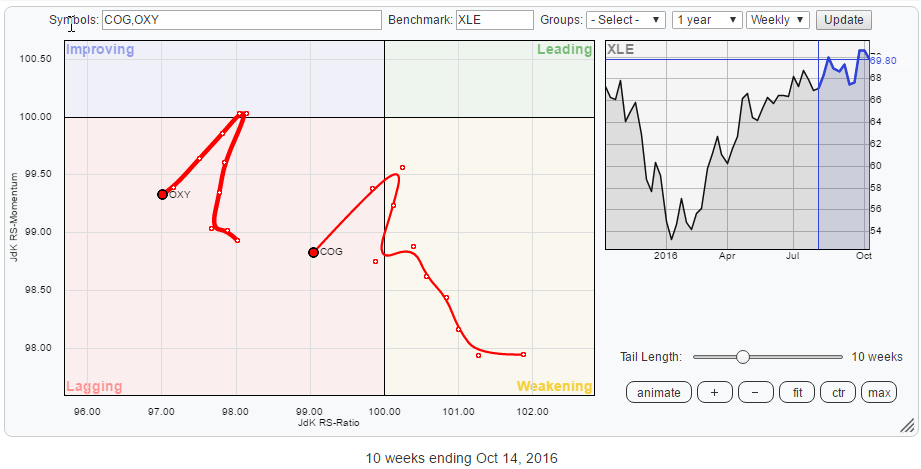
The RRG below shows the recent rotational pattern for OXY and COG in more detail. Both went through a quick turn back down. It looks counter-clockwise on the weekly RRG, but it is definitely a clockwise rotation when you zoom into a daily version of the chart.
Occidental Petroleum Corp. - OXY
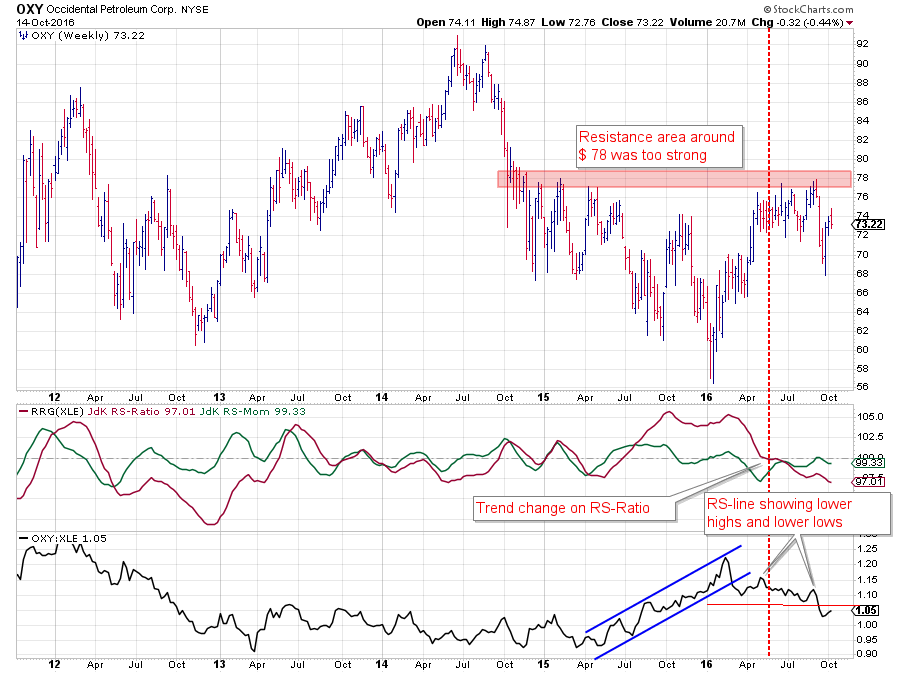 While the market dipped in 2015, OXY dropped less causing the Relative Strength line to move higher. This uptrend in RS was picked up by the RS-Ratio line which moved above 100 at the start of July.
At the beginning of 2016 the rising support line in the RS chart was broken, followed by a cross below 100 of the RS-Ratio line, picking up a new downtrend in relative strength.
For a while price struggled with the resistance zone around $ 78, but the stock seems to have lost this battle recently with a sharp move lower which pushed below its most recent lows.
It looks as if this drop in price was what was needed to push the RS-Line below its recent lows as well, confirming the relative downtrend. In the RRG-Lines the RS-Momentum line just topped out against 100 and RS-Ratio started to head lower as well, pushing OXY further into the lagging quadrant.
More relative weakness seems to lie ahead for OXY
Cabot Oil & Gas Corp. - COG
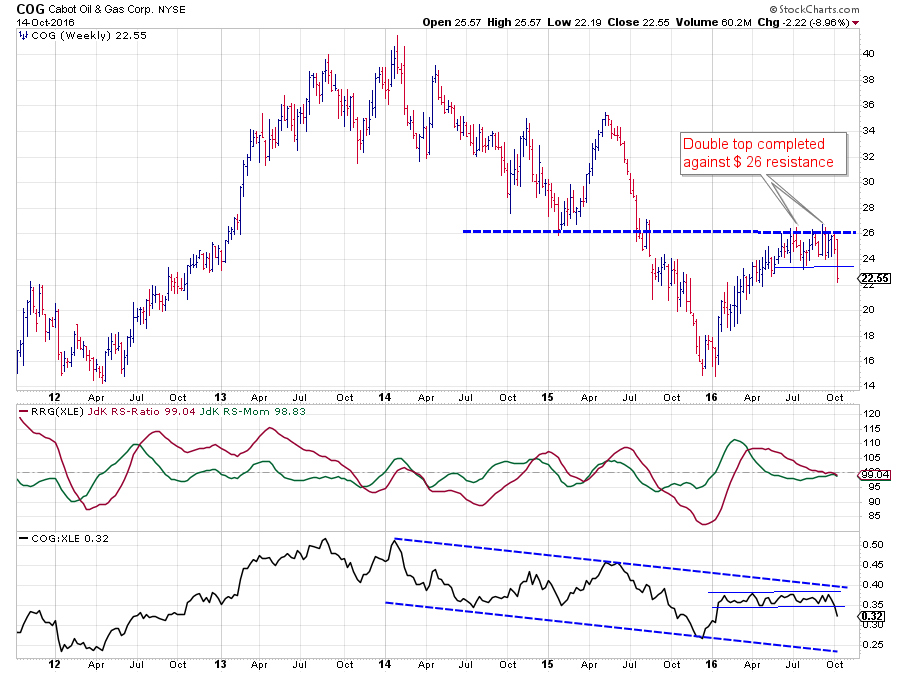 COG is in a (relative) downtrend, more or less, since early 2014.
In the bigger scheme of things, the rally out of the double bottom low at the end of 2015 has to be seen as a counter-trend move, especially as it has now ended with the completion of a double top against the resistance level ($ 26) offered by the, early, 2015 low.
Last week's decline provided a clean break from this double top, signaling that more price weakness can be expected going forward.
With the relative strength line in a long-term downtrend as well, these recent developments in price are not going to help.
The counter-trend rally caused RS to move higher initially but that up-move was quickly followed by a narrow trading range which lasted several months.
Last week's break in price has also caused RS to drop out of that narrow range which very likely triggers a continuation of the relative downtrend within the boundaries of the longer-term channel.
The WEAKENING quadrant
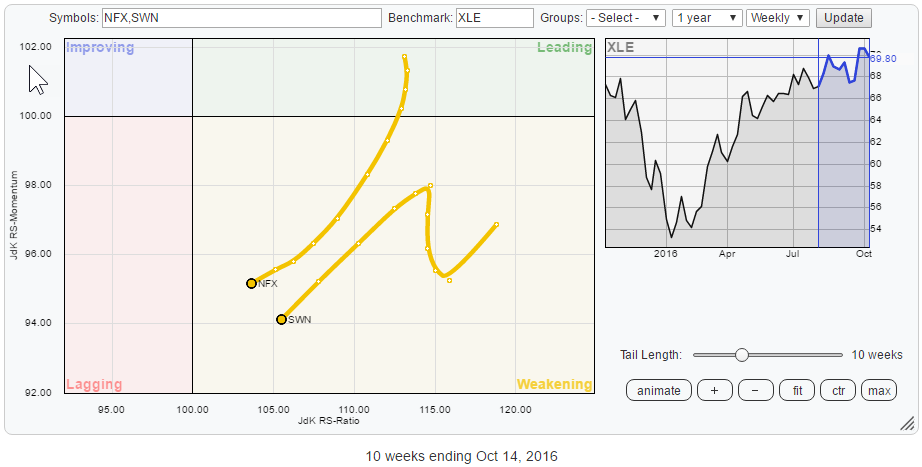
The RRG below shows the, zoomed in, rotation of NFX and SWN. Both are now heading towards the lagging quadrant, but their rotational paths and the accompanying charts are entirely different.
Newfield Exploration Co. - NFX
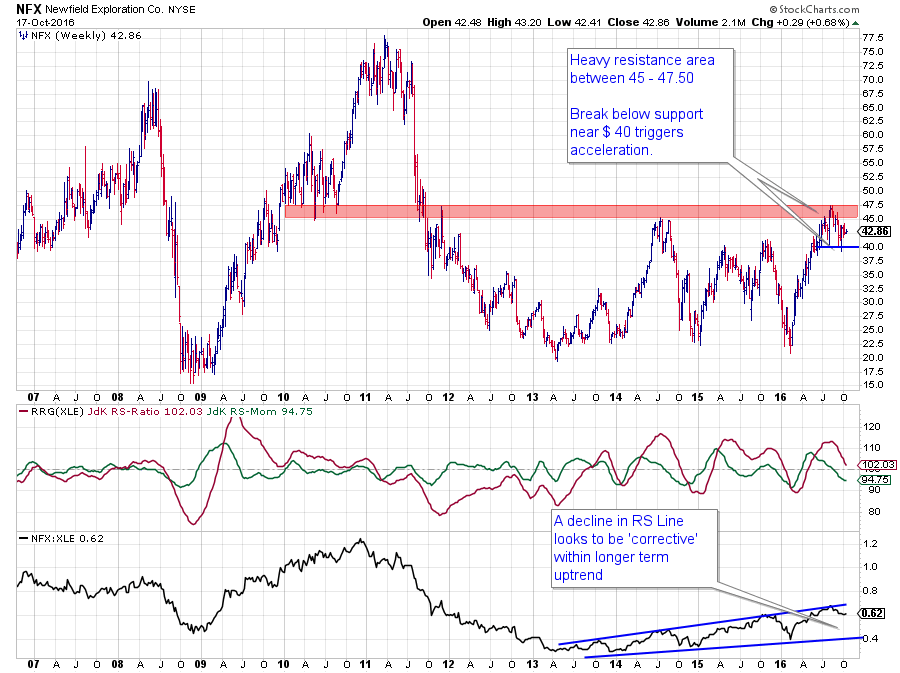
On the price chart, NFX started to move in a wide range between $ 20 - $ 47.50 after the initial drop from the 2011 highs.
This year's rally once again failed in the $ 45 - $ 47.50 resistance zone, and a small top-formation seems to be in the making. At the moment a break below support near $ 40 appears to be the trigger for an acceleration downward.
The relative picture is a bit mixed. The raw RS-Line traces a pattern of higher highs and higher lows which is positive. This relative uptrend, however, is not contained within the boundaries of a nice channel but the rising support and resistance lines are diverging wider apart over time.
This means that 'corrections' within this uptrend can become bigger without harming the trend, i.e. violate the higher highs, higher lows rhythm but that also increases the relative risk.
At this point, relative strength looks to be coming off its upper boundary while RS-Ratio has peaked and is now rapidly heading for the 100-level and possibly break below it.
All in all the relative odds are now for a period of underperformance vis-a-vis XLE in coming weeks. The speed of the rotation will eventually clarify whether this is a corrective move within the long-term uptrend or a change in LT (relative) trend.
Southwestern Energy Co. - SWN
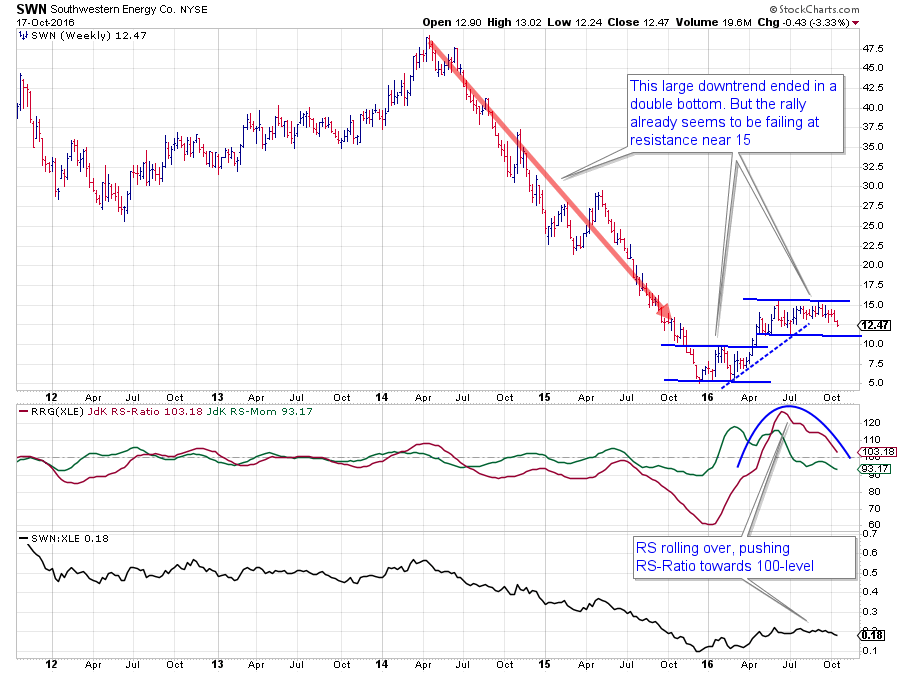
SWN is showing a very different price chart. A strong downtrend in price took the stock from $ 47.50 in 2014 down to $ 5.00 (this is not a typo) at the end of 2015 and the beginning of 2016.
In the transition from 2015 into 2016, SWN completed a double bottom pattern and started a rally which fulfilled its price target a few weeks after the completion. Admitted, this was a 50% rally but in the bigger scheme of things it is not more than a hiccup.
Around $ 15 SWN already ran out of fuel and this level has now become a resistance level while the short improvement of relative strength (both RRG-Lines moved above 100) has already started to roll over.
It seems only a matter of time before the JdK RS-Ratio line drops below 100 again, signaling a new relative downtrend. A break below support on the price chart will only accelerate such a move.
Improving and Leading
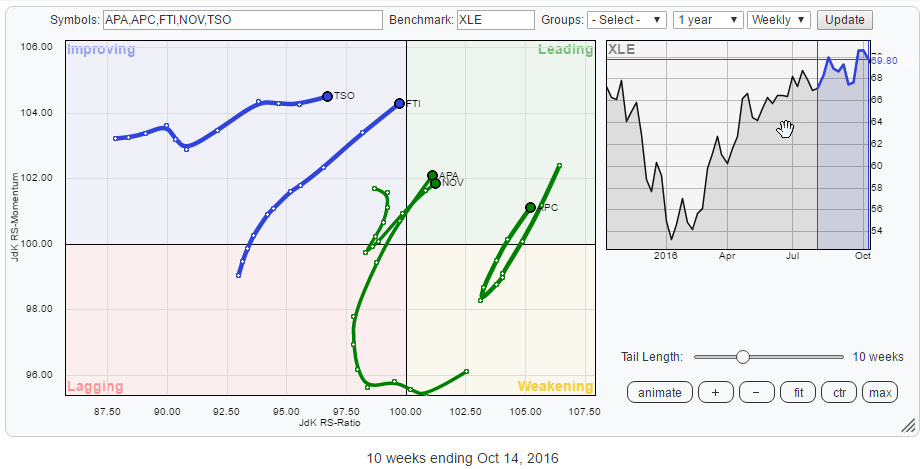
The RRG below zooms in on the rotations of some stocks inside the improving and the leading quadrants.
Both TSO and FTI are inside the improving quadrant and heading towards leading. Reading the heading from the tails of both stocks I prefer FTI as it is still gaining on both axes (heading around 45 degrees) while TSO, at the moment, is not backed by relative momentum.
Inside the leading quadrant, APA, NOV, and APC are showing strong rotations. Based on their rotational patterns in combination with their price charts, I will look at APA and APC in more detail.
FMC Technologies, Inc. - FTI
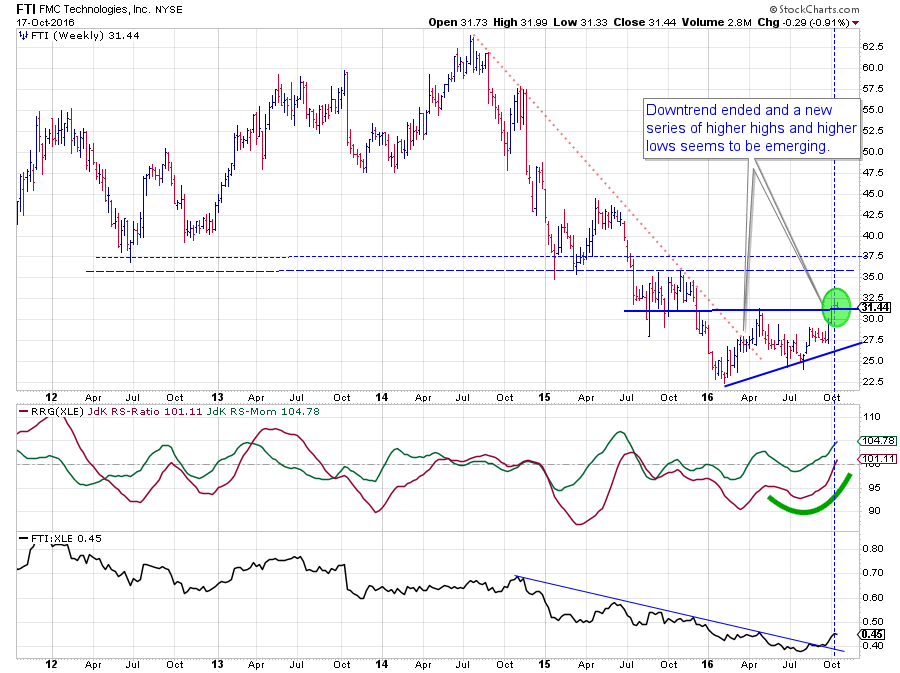
FMC is turning upwards from two long-term downtrends.
On the price chart, the stock more than halved in price since its peak in 2014. The bottoming process took nearly all of this year so far, taking the shape of an ascending triangle, and seems to be on the verge of completing itself now by breaking above horizontal resistance near $ 31.
A similar turnaround is seen in the relative strength line where the falling resistance has been taken out recently. This improvement shows up in more detail in the RRG-Lines where relative momentum (JdK RS-Momentum line) is pulling RS-Ratio upwards and above the 100-level.
This pushes FMC into the leading quadrant for the first time since mid-2015.
Based on the upside potential, that is now available on the price chart (next resistance level near $ 35-37.50) as well as the relative chart FMC seems set for a period of outperformance inside the Energy sector.
Apache Corp. - APA
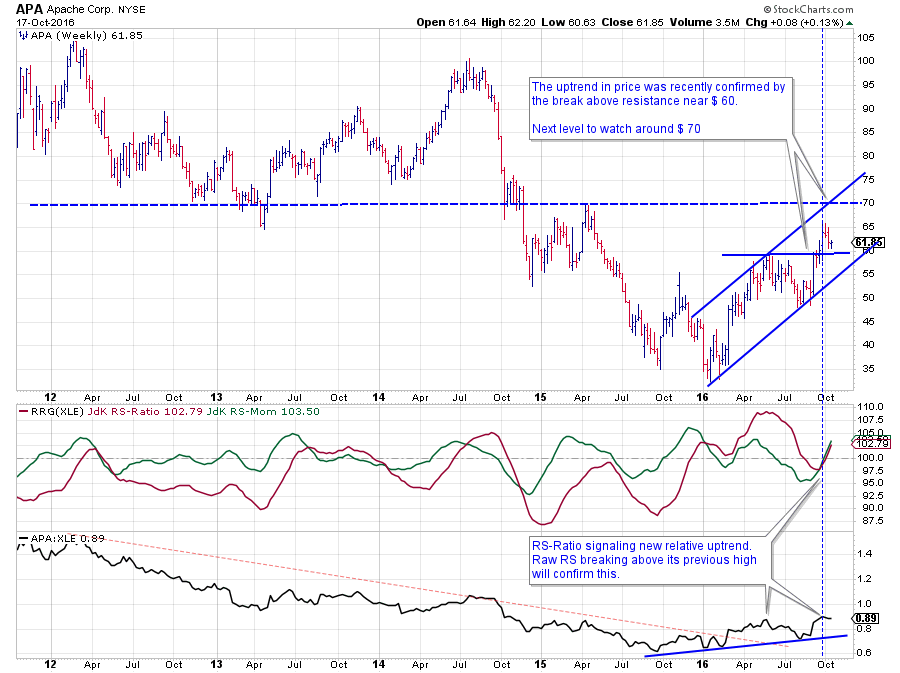 APA started to improve, from a relative point of view, towards the end of 2015 when the JdK RS-Ratio line pushed above the 100-level for the first time since 2014.
This improvement was soon followed by the raw RS-Line breaking its falling resistance line. Improvement on the price chart followed in the first few months of 2016.
Just recently APA lost some relative strength causing a quick rotation through the weakening and lagging quadrants, and it took only one weekly observation inside improving before returning to the leading quadrant.
This follows the steep angle, currently seen on both RRG-Lines.
Especially when the raw RS-Line manages to, convincingly, break above its previous highs, APA loos set for a nice relative run against XLE.
Anadarko Petroleum Corp. - APC
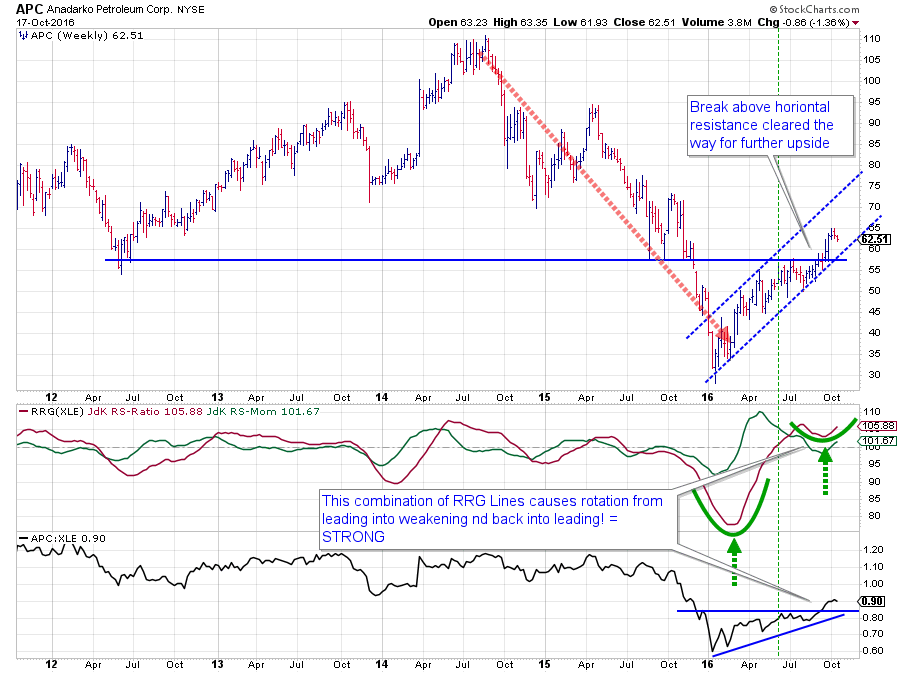
APC is probably the stock showing the nicest rotation inside the Energy universe.
On the RRG we see the stock coming down from the leading quadrant into weakening at high RS-Ratio levels and then sharply turning back up at a steep angle in the 0-90 degree range which usually is a strong sign for future outperformance.
Looking at the price chart, we see a very regular rhythm of higher highs and higher lows emerging from the early 2016 low which just broke above horizontal resistance near $ 57.50.
Within the boundaries of that rising channel, there is plenty of room for APC to move higher unobstructed.
The relative perspective is where the real positive signs are coming from.
On the raw RS-line an ascending triangle has been completed, freeing up the way for further relative improvement.
Finally, the interaction of the RRG-Lines is one of the strongest we can get. An initial move higher from low RS-Ratio levels moving into the leading quadrant, followed by a rotation from leading into weakening and then back up. This is caused by the low in the RS-Ratio line forming above the 100-level and then moving higher again in concert with the RS-Momentum line. Firing on all(two) cylinders so to say.
Julius de Kempenaer | RRG Research
RRG, Relative Rotation Graphs, JdK RS-Ratio and JdK RS-Momentum are registered TradeMarks by RRG Research
Follow RRG Research on social media:

