Last weeks RRG blog looked at the sector ETFs that make up the S&P 500 index. Materials, the XLB ETF, came out as one of the, more promising, sectors on its way to the leading quadrant.
In this post, I will look into the individual stocks that make up that materials sector.
Summary
- High number of stocks inside leading quadrant indicate broad participation
- FCX, NUE, and FMC showing strong rotation into leading quadrant, backed by long tails
- CF, strong but at a flat tail
- Within the weakening quadrant, WRK, IP, and BLL need a closer look
- short tails on WRK and IP suggest rotation in positive territory
- BLL looks to be heading further down
- Some long-tails in the lagging quadrant
- NEM has more room to move lower
- AVY and IFF expected to rotate deeper into lagging quadrant
Quick scan
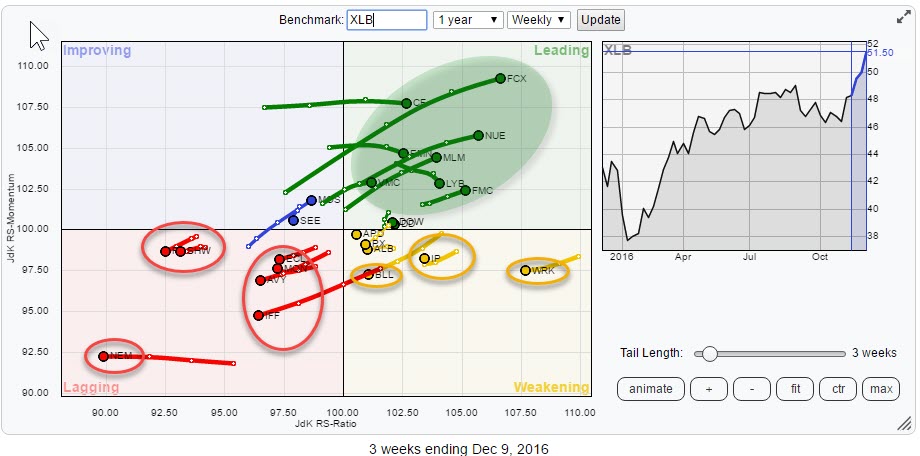
The first look over this Relative Rotation Graph reveals a high number of stocks inside the leading quadrant that are also backed by long tails. Although the tail length is set to just three weeks (to make the RRG better readable) some of these tails span a long distance.
Look at the distance traveled by stocks like FCX, CF, and NUE for example. These have moved significantly over this three week period.
The high number of stocks inside the leading quadrant also indicates that it is a broad-based move that not leans on the performance of only a few names.
The improving quadrant is thinly populated with just two stocks in it, and both are also very close to the benchmark.
A bit more companies move inside the weakening quadrant of which three names, WRK, IP and BLL deserve a bit more attention.
Finally, in the lagging quadrant, we find some stocks that are heading opposite of the long tails that are seen on the opposite side (leading).
From a sector perspective
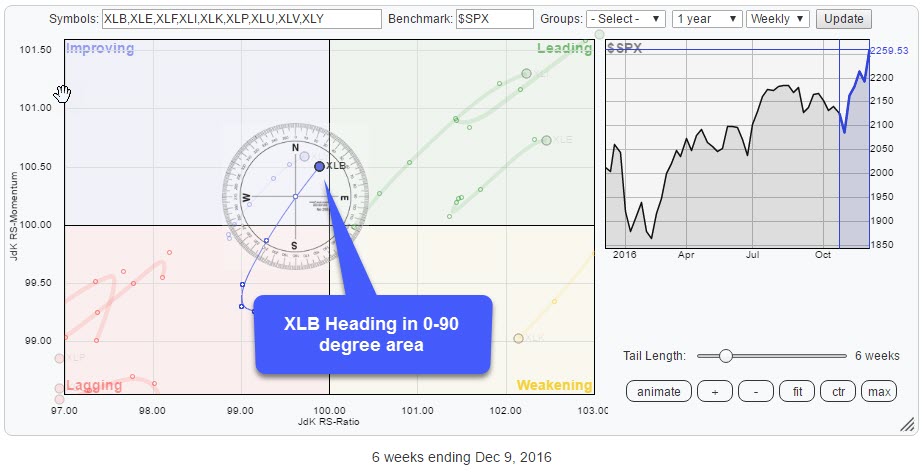
On the sector RRG, XLB is inside the improving quadrant and moving at a 35-40 degree heading which is considered positive. As the sector is positioned very close to the 100 level on the JdK RS-Ratio axis, it seems just a matter of time before Materials will rotate into the leading quadrant confirming its relative strength against the S&P 500.
A deeper analysis of the current state of sector rotation in the US is found in last week's blog.
The leading quadrant
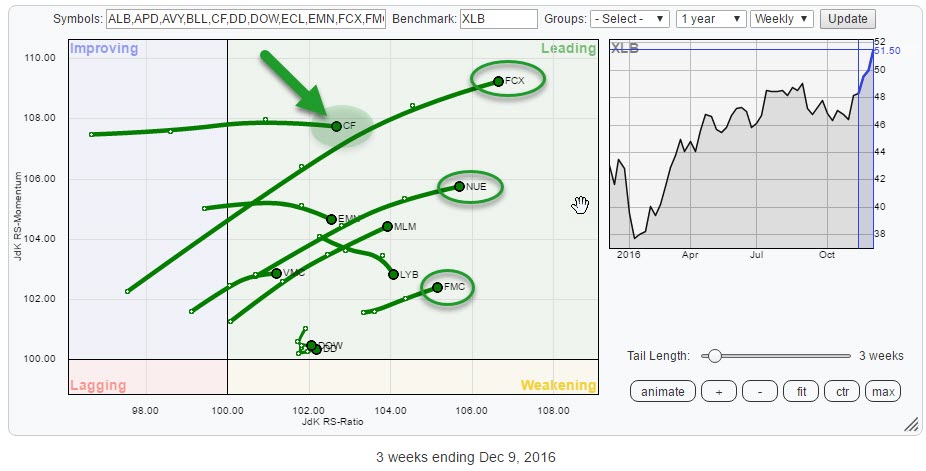 The leading quadrant for this universe of stocks in the materials sector is pretty crowded. The first ticker symbol that caught my eye was CF as it was recently highlighted by Greg Schnell in the "Don't Ignore This Chart" Blog here.
Other tails worth a further inspection are, for example, FCX, NUE, and FMC. These three are clearly leading the sector higher, and they are all still pushing higher on both axis.
CF Industries Holdings Inc. - CF
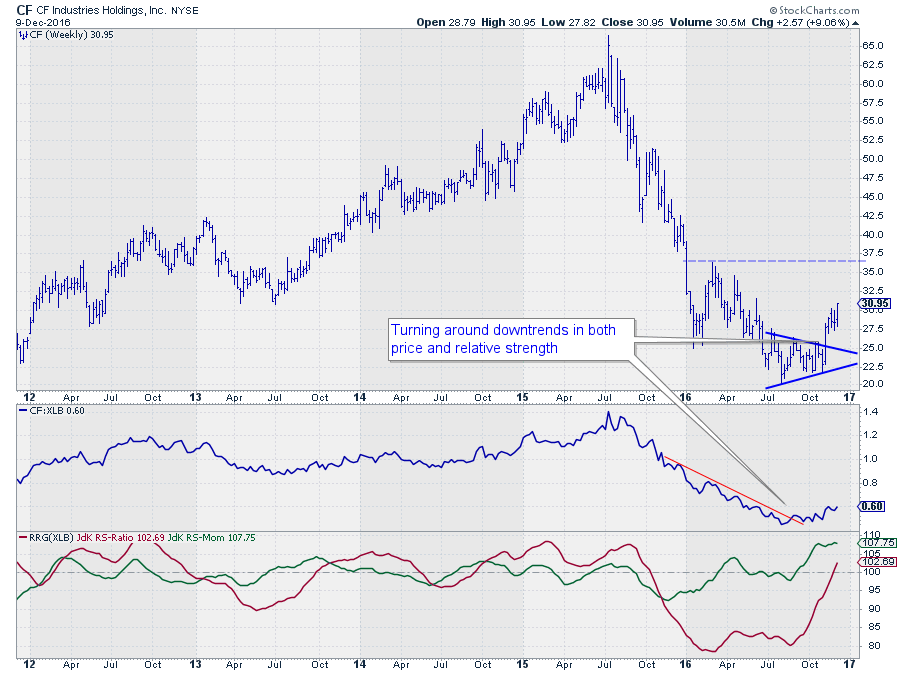 Over the past 12 months, CF more than halved in price, causing relative strength against XLB drop like a stone as well. This process started to reverse itself during the summer of 2016 when price consolidated inside a triangle formation and relative strength managed to break the falling resistance line and slowly started a new uptrend in RS.
Both these new trends are in their early stages which means that there is a lot of upward potential left on the table. On the price chart, the first real resistance level is not expected until the $ 35 - 37.50 area.
The only caveat here is that the tail on the RRG chart is moving almost horizontally at the moment, which means that there is not a lot of relative momentum to back the move at the moment. In the RRG-Lines this can be seen by the flat trajectory of the JdK RS-Momentum line over the past few weeks.
Given the steep rise in RS-Ratio, coming from very low levels, some pause is very well possible. Potentially offering a good opportunity to board on this move at slightly lower levels.
Freeport-McMoRan, Inc.
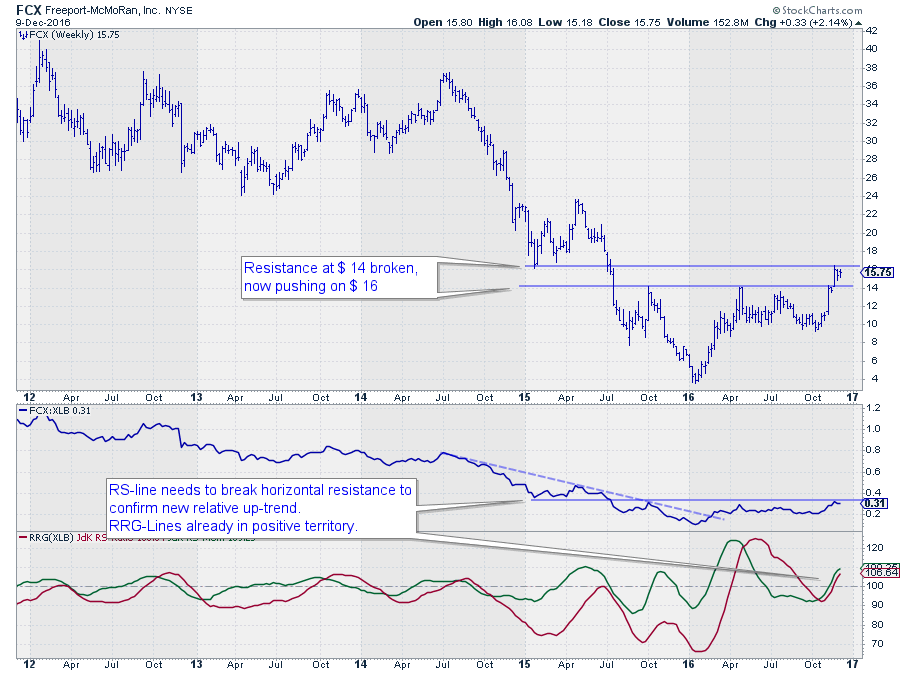 FCX also reversed a big downtrend in price, just like CF, but seems to be a bit further into the process.
On the price chart, a new series of higher highs and higher lows is now clearly visible, and the downside is well protected by the former resistance level at $ 14. The next hurdle to take out is the horizontal barrier at $ 16, which will unlock further upward potential towards $ 24.
The relative strength line started to move sideways after ending the relative downtrend. The recent rise of both RRG-Lines back above 100 pushed FCX into the leading quadrant suggesting that the new trend is picking up steam and there is more to follow.
Nucor Corp. - NUE
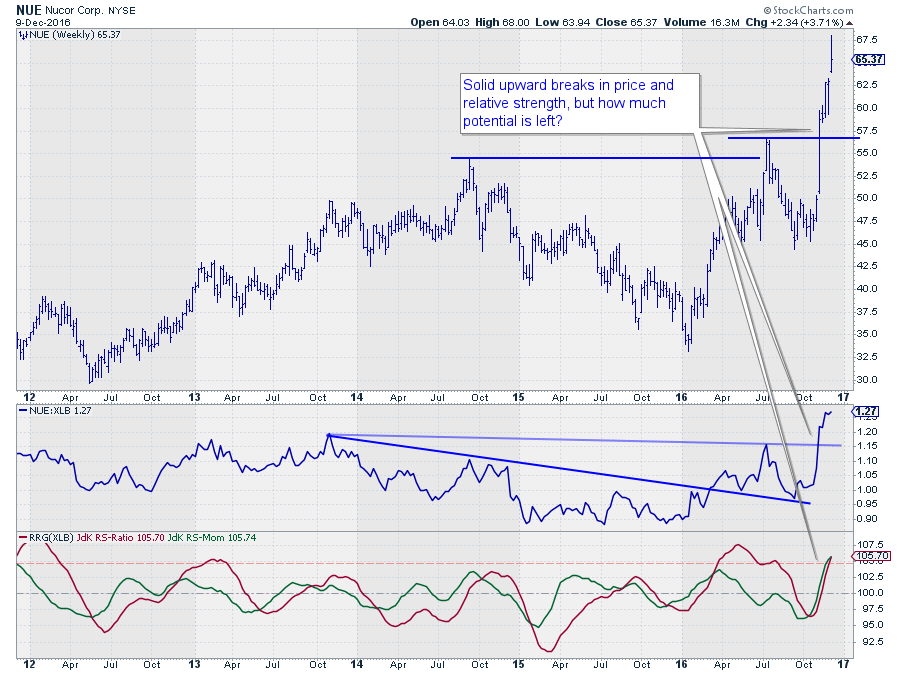 Nucor is showing a lot of strength recently but a 50% move in roughly two months time raises the question of how much more is left in store for the time being
This is where the historical oscillation of the RRG-Lines and especially the JdK RS-Ratio line comes into play as they can be used to gauge what can be considered a "normal" move, or oscillation from the benchmark, for relative strength/trend. At the moment the RS-Ratio line of NUE vs. XLB is reaching levels that can be considered "high" which increases the odds of, at least a temporary, loss of relative momentum.
Be careful, by no means, this means that NUE is a weak stock it just means that it should be watched a bit more carefully for loss of momentum. Given the high reading on the RS-Ratio axis, this could be a very good candidate for a rotation on the right-hand side of the plot offering opportunities to participate in a new move higher after a correction.
FMC Corp - FMC
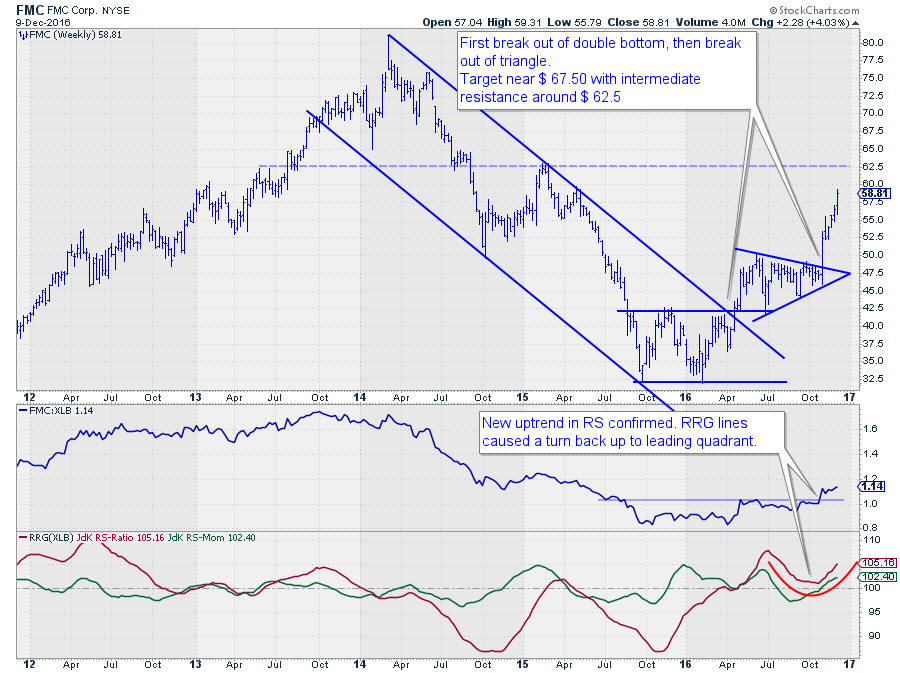 The FMC chart shows some very clear signals pointing to higher prices and strong relative strength ahead.
The stock moved in a well-pronounced downtrend during 2014 and 2015. At the end of 2015, a textbook double-bottom formation marked the end of the downtrend and the upward break, and completion of the double bottom coincided with the break of the falling resistance that served as the upper boundary for that downtrend.
The next hurdle is the horizontal resistance level around $ 62.50.
After the upward break and initial rally, FMC started a consolidation into a, again textbook, symmetrical triangle. A few weeks ago this consolidation was left to the upside, confirming the current strength for this stock.
The relative strength charts are painting a positive picture as well. The raw RS-Lines went through a year long consolidation / bottoming process before breaking out to the upside recently. The underlying improvement in relative strength was picked up by the RRG-Lines in April-May when FMC rotated into the leading quadrant on the RRG chart. During the summer, one more rotation through weakening took place before FMX started to move away from the benchmark.
The stock is now solidly heading further into the leading quadrant with enough upside potential left.
The weakening quadrant
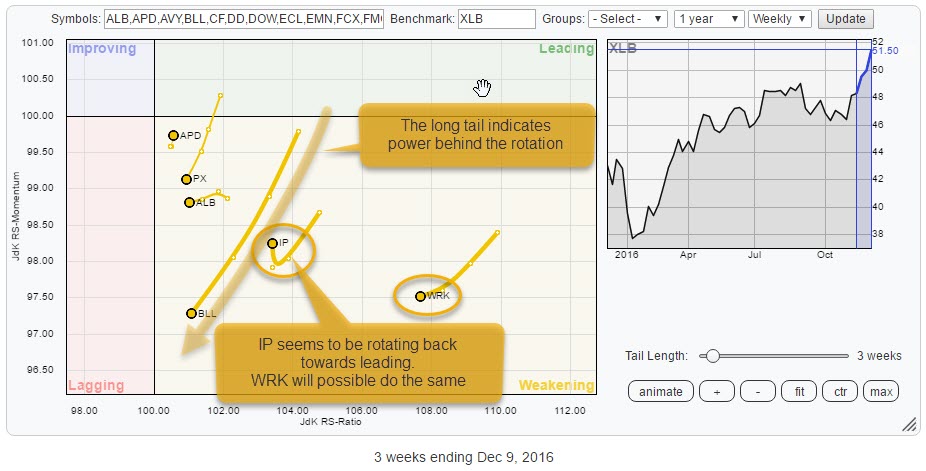 Inside the weakening quadrant, there is one stock that stands out negatively. That is BLL, showing a long tail that indicates strength behind the rotation that will very likely push the stock into the lagging quadrant in coming weeks.
A bit further to the right, higher up on the RS-Ratio scale, are IP and WRK. They have been coming down from the leading quadrant but are still strong on relative strength. The upward move that started to emerge in IP last week is, therefore, a positive sign as it suggests that a rotation back up to the leading quadrant is emerging.
Given the high reading of RS-Ratio for WRK, a similar move could be in the making here as well.
Ball Corp. - BLL
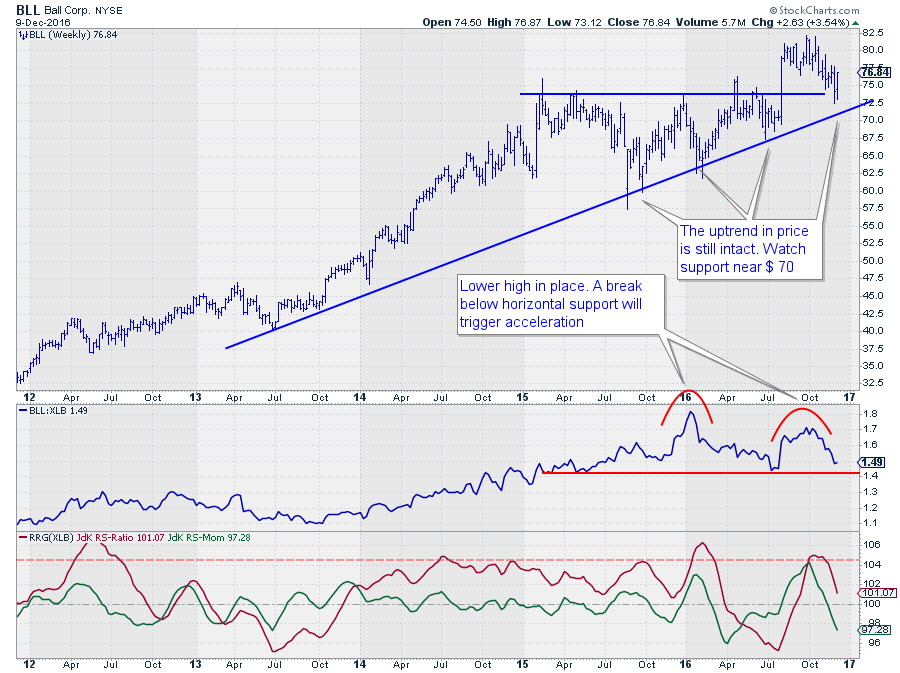 Ball Corp. was a very strong stock, and outperforming the sector from mid-2013 all the way to early 2016. The JdK RS-Ratio line picked up this relative uptrend at the end of 2013 and remained above the 100 level until April of this year. That was well over two years.
Although the uptrend on the price chart is still intact, BLL has not managed to push to new relative highs since the beginning of 2016 and, as a matter of fact even put in a major lower high a few weeks ago. A horizontal support level has now started to show up on the RS-line. Once broken, the relative picture will weaken even further.
The recent relative weakness has pushed the JdK RS-Momentum line below 100, and it is starting to drag the RS-Ratio line down from its recent high levels. Given the steepness of the decline, which causes the long tail on the RRG, a further rotation into the lagging quadrant may is anticipated.
International Paper Co. - IP
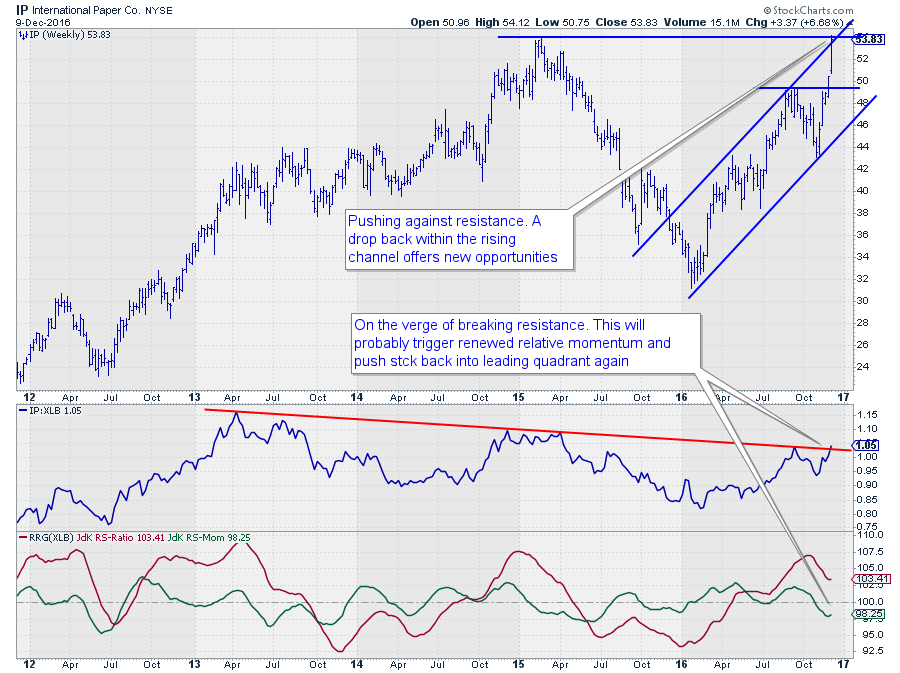 Despite being inside the same weakening quadrant as BLL, International Paper is showing a different picture. This RS line is moving higher since early 2016 and is now pushing against the falling resistance line, which more or less coincides with the level of the previous high in RS.
A break beyond this previous top will, at the same time, take out the falling resistance line and open up more relative upside.
The RS-Ratio line had already moved above 100 in April and is still there, indicating an uptrend for IP against XLB. The rotation on the RRG, moving into the 0-90 degree heading while inside the weakening quadrant, suggests that a new period of outperforming XLB is around the corner. This could be an interesting stock to keep an eye on in coming weeks.
The lagging quadrant
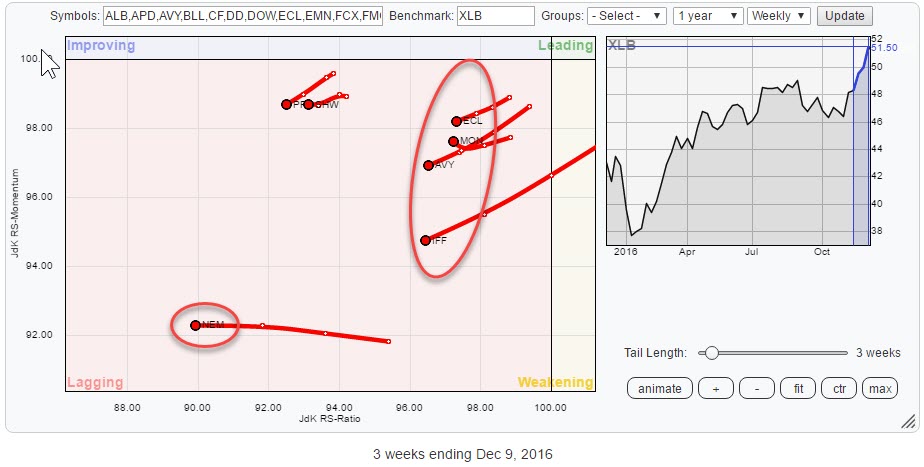 There is a decent number of stocks inside the lagging quadrant, i.e. in a relative downtrend against XLB. One of them, NEM, stands out with a long, but flat, tail and tucked away in the lower left corner, indicating a solid relative downtrend that is neither losing nor gaining momentum.
Inside the red oval, we find some stocks that have recently rotated into the lagging quadrant and are still pushing lower on both axes. Based on their rotation and level on the RS-Ratio axes, these stocks inhibit plenty of downside risk from a relative perspective. Watch ECL, AVY, and IFF
Newmont Mining Corp. - NEM
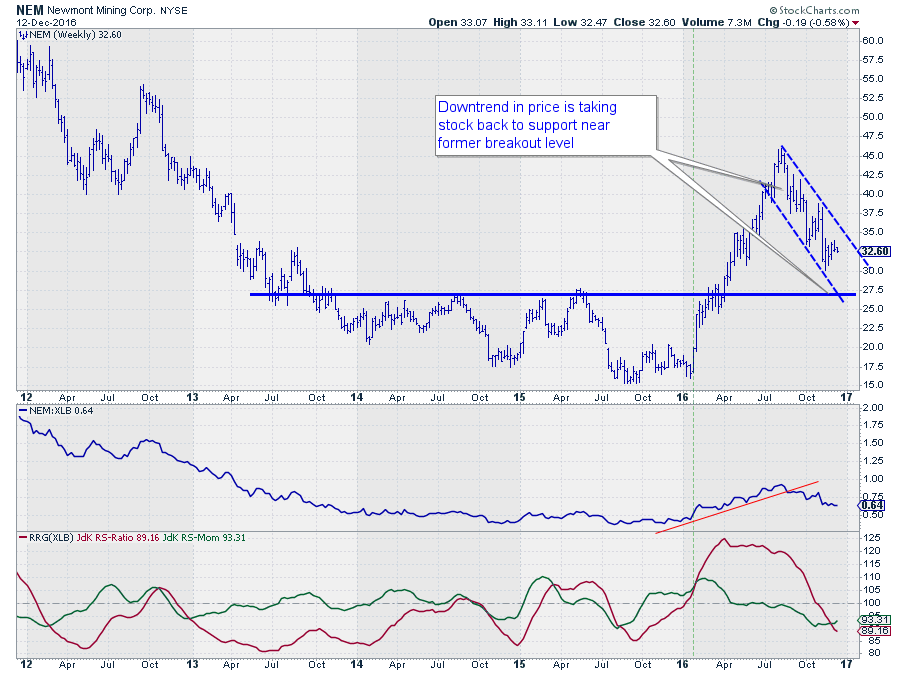 NEM is at the lowest RS-Ratio level of this whole universe. But as you can see in the chart above it has been at even lower levels in the past five years. After a run higher since late 2015, RS has started to roll over in August and seems to be picking up steam to the downside now.
On the price chart, a clear downtrend has emerged over the past months, and it seems to be on track to take NEM back to its former breakout level around $ 27.50
Based on the available downside risk in both price- and relative charts the odds remain for a further decline and rotation deeper into the lagging quadrant. Given the low reading on the RS-Ratio scale, a temporary pickup in momentum could cause a complete rotation on the left-hand side of the RRG.
Avery Dennison Corp - AVY
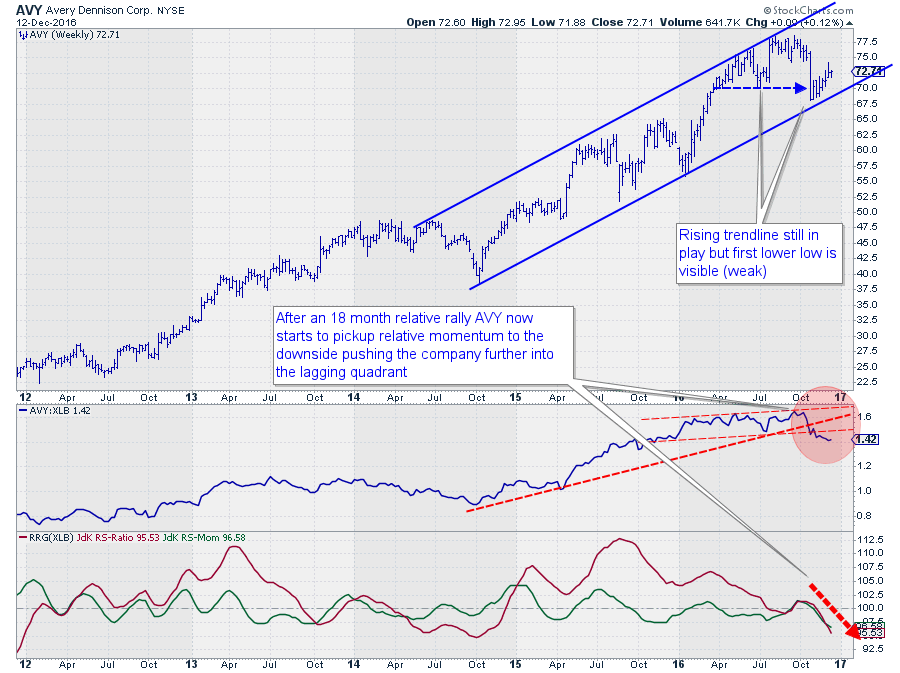
Avery Dennison is still trading in an uptrend on the price chart. However, a first lower low is now visible, which is a sign of weakness as the buyers at the previous low (around $ 70), apparently were not willing to buy again at that level a few weeks ago. Only at $ 67.50 some buyers came in.
A break below the recent low at $ 67.50 will break the channel and at the same time trigger a new series of lower highs and lower lows.
Weakness is also already visible on the relative charts. The RS-Lines has broken two rising trendlines and dropped below its previous low. The RRG-Lines are now moving lower in tandem and pushing AVY deeper into the lagging quadrant with no signs for a turn visible at the moment.
Intl Flavors & Fragrances - IFF
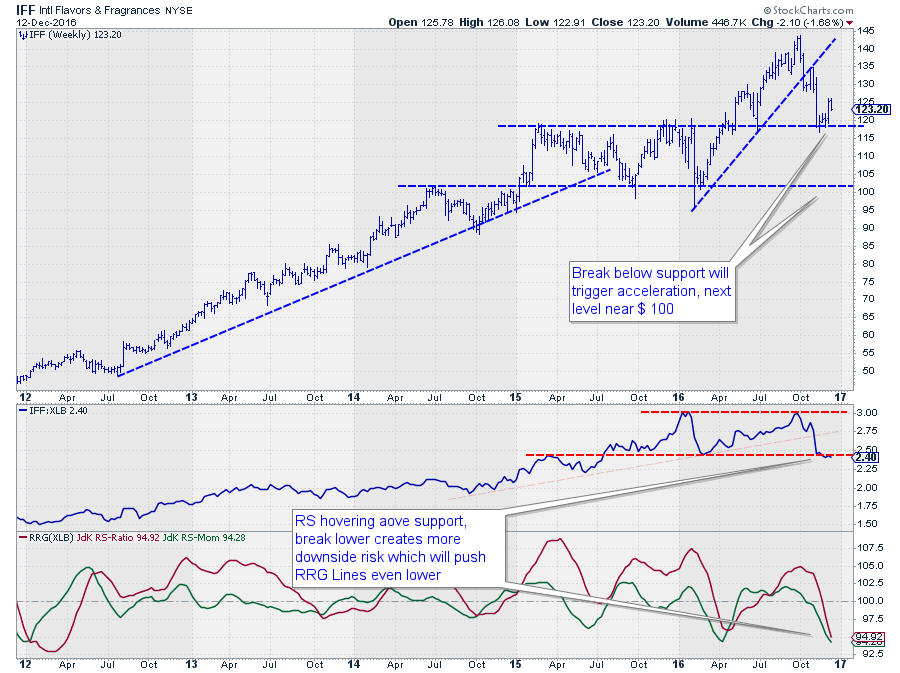 IFF is the stock at the lowest RS-Momentum level inside the oval on the RRG. This means that it has the strongest downside momentum of that cluster, causing a long tail.
The relative strength line has peaked around 3 in January and has tested that level again in October, mainly creating a broad trading range in relative strength.
At the moment relative strength is hovering above the lower boundary of that range. A break lower will most likely trigger a further acceleration down which will push the stock even deeper into the lagging quadrant.
A catalyst for such a move could come from a break below $ 118 in the price chart. This is a horizontal level that has been tested a few times over the past years as both support and resistance.
Julius de Kempenaer | RRG Research
RRG, Relative Rotation Graphs, JdK RS-Ratio and JdK RS-Momentum are registered TradeMarks by RRG Research
Follow RRG Research on social media:

