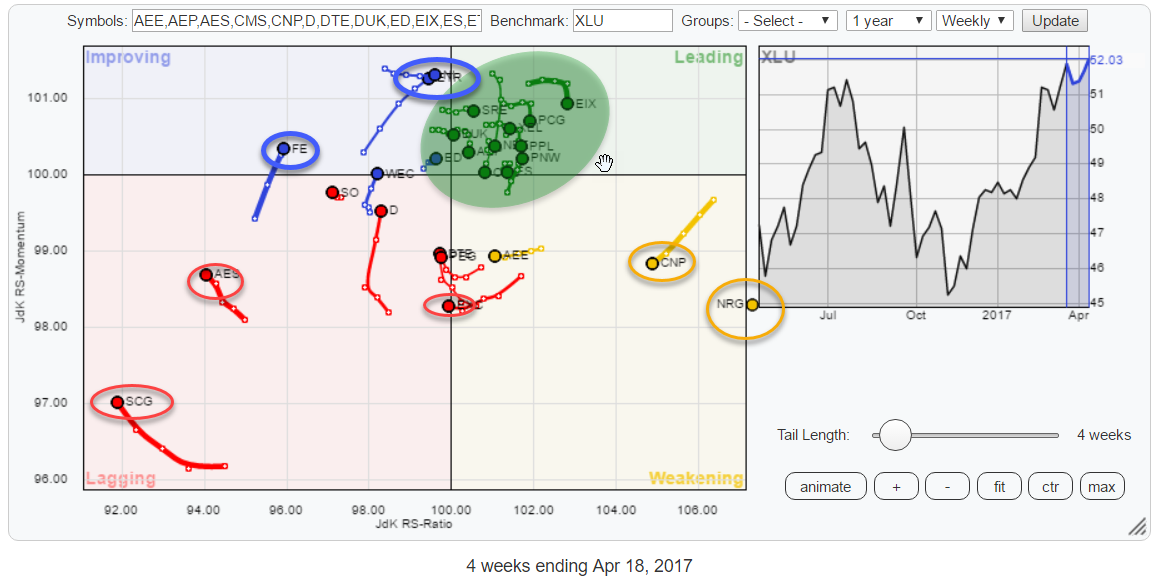
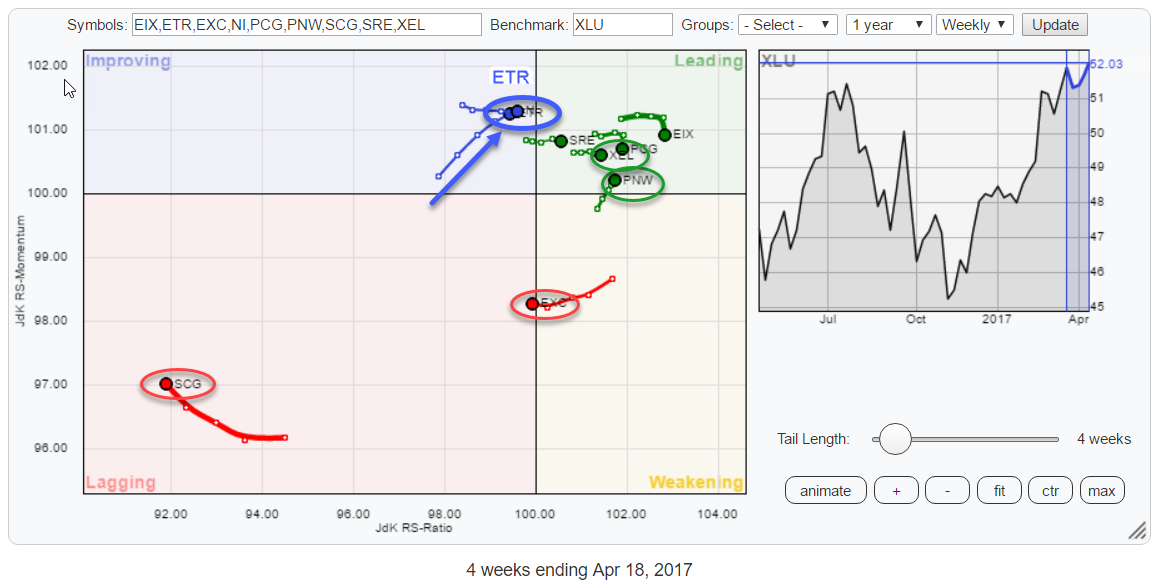
 The Relative Rotation Graph above holds the stocks that, together, make up the Utilities sector index (XLU).
The keen observer may notice that there is one stock, NRG, positioned in the "gutter" of the chart. This is done on purpose as NRG is so far out to the right of the graph that it compresses all other stocks if I would include it, properly positioned, on the RRG.
I will have a look at NRG further down in this post.
The stocks inside the weakening and the lagging quadrant can fairly easily be identified. Same for improving. The leading quadrant is a bit more cluttered which makes it hard(er) to determine the individual ticker symbols. The best way to analyze an RRG like this is to click on one of the ticker symbols in the table below the chart and then "step" through the universe. This will "highlight" the selected stock while the others are dimmed so you can quickly identify the rotation of that single stock among its peers.
Summary
- Utilities sector pushing into leading quadrant
- NRG rotation detached from other utility stocks
- EXC not able to break resistance, rotating into lagging quadrant
- SCG already snapped lower on RS, waiting fro a break in price now
- XEL breaking higher on both price- and relative graphs, solidly moving inside leading quadrant
- PNW confirming strong relative trend by rotating back into leading quadrant from weakening
- ETR inside improving quadrant but heading towards leading; needs to take out overhead resistance.
From a sector perspective
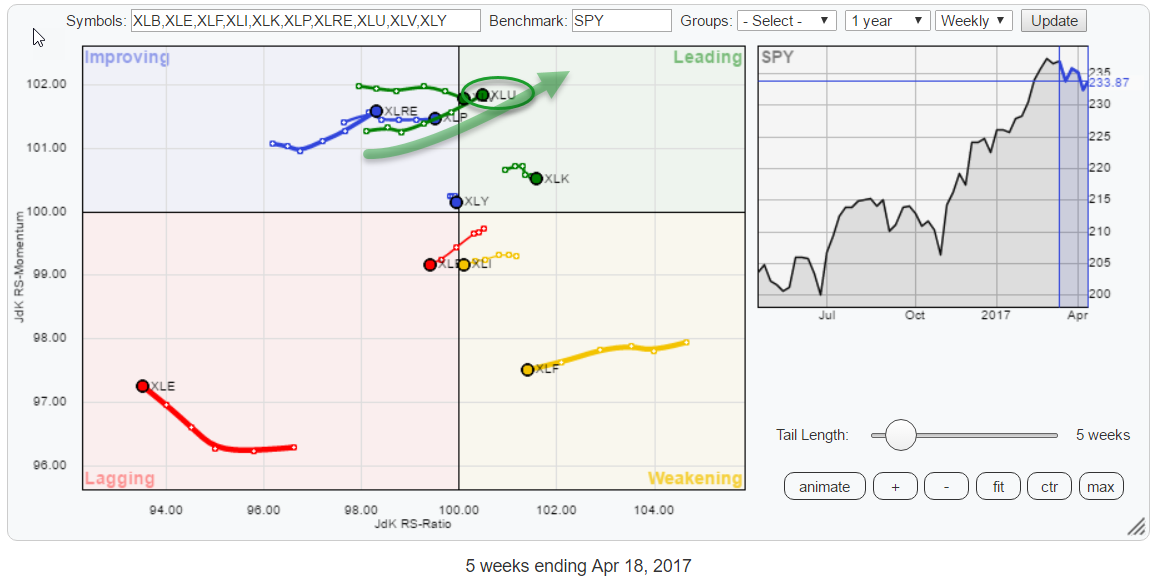 Before diving into the components of the Utilities sector, I would like to take a quick look at the sector as a whole on the Relative Rotation Graph holding all S&P sectors.
It is clearly visible that XLU is leading a group of four sectors that is currently still inside the improving quadrant but rapidly heading East towards the leading quadrant.
XLU (Utilities) and XLV (Health Care) are leading this group, closely followed by Consumer Staples (XLP) and Real-Estate (XLRE). All four sectors can be classified as "Defensive" which builds a case for a "risk-off" approach to the market as a whole.
The one that stands out
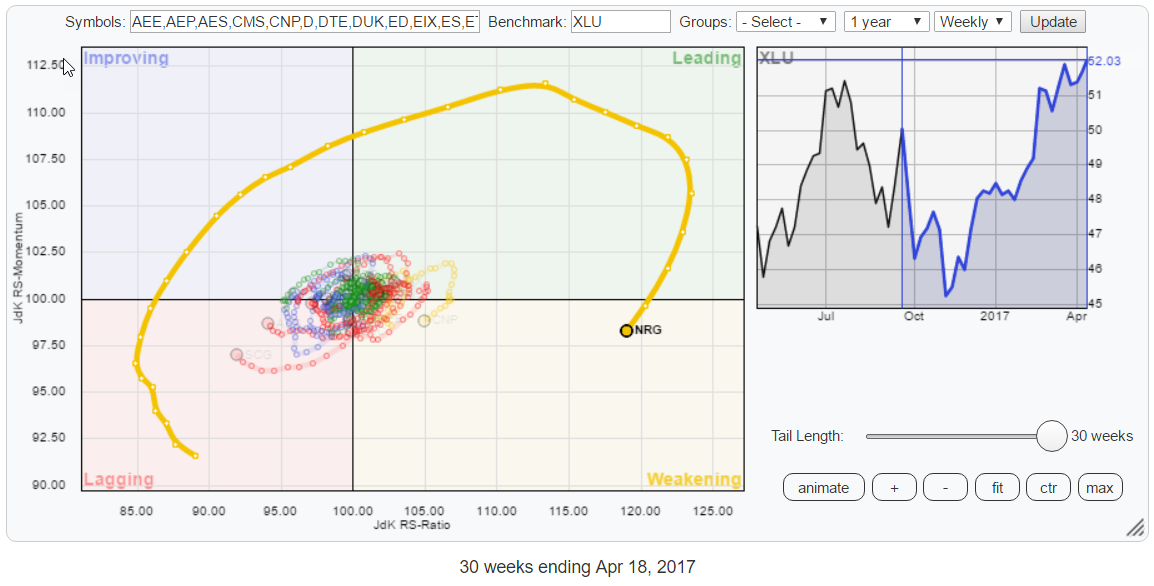 In the above RRG, I have set the zoom to fit which makes sure the graph includes all securities and their rotation on the plot. I have also set the tail length to 30 to show longer rotational patterns clearly, and finally, I have selected the NRG line in the table to highlight the NRG rotation while dimming all others.
As you can see, NRG made a very wide rotation around all other members of this universe, meaning that it can be a great source for alpha. One of the reasons why NRG can make such wide moves (=deviate far away from the benchmark) is because it is the smallest stock in the sector at 0.89%
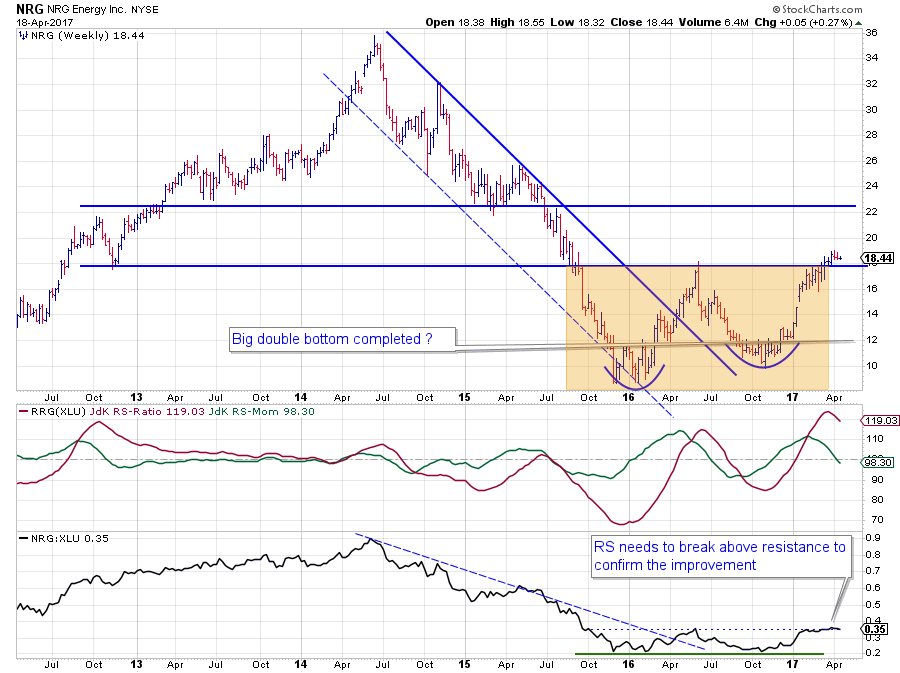 The price chart reveals that NRG dropped to less than 1/3 of its value from its mid-2014 high at $ 35 to a low of almost $ 8 at the beginning of 2016.
The first big leg up, out of that low, broke the falling trend channel and was the first sign of improvement. The second sign of improvement was the first, major, higher low formed around $ 10 towards the end of 2016.
At the beginning of this year, NRG rallied sharply and started pushing against resistance offered by the previous high at $ 18. After a few weeks of struggling the stock now seems to have cleared this barrier which opened up the way for more upside price movement. The next resistance level to watch now is around $ 22 while the downside is protected by support off of the former breakout level at $ 18.
The big swings in price have caused similar big swings, and the accompanying big rotations, in relative strength against XLU.
Despite the recent drop in relative momentum (JdK RS-Momentum), NRG is still, by far, the strongest stock in the Utilities sector at 120 on the JdK RS-Ratio scale. Given the extreme level of RS-Ratio in combination with the strong price chart and the raw RS-Line on the verge of breaking its resistance level, the odds are in favor for NRG to complete a rotation on the right-hand side of the Relative Rotation Graph.
A turn back up into a 0-90 degree heading while inside the weakening quadrant would be a good moment to look at NRG for long/overweight positions again.
Zooming in
 After stepping through all the members of XLU on the Relative Rotation Graph, I found interesting rotational patterns for the stocks shown in the above RRG.
EXC and SCG are the names to avoid in coming weeks. From the improving and leading quadrants, I have picked XEL, PNW, and ETR for further study as potential outperformers for the period ahead.
The weak stocks
Exelon Corp. - EXC
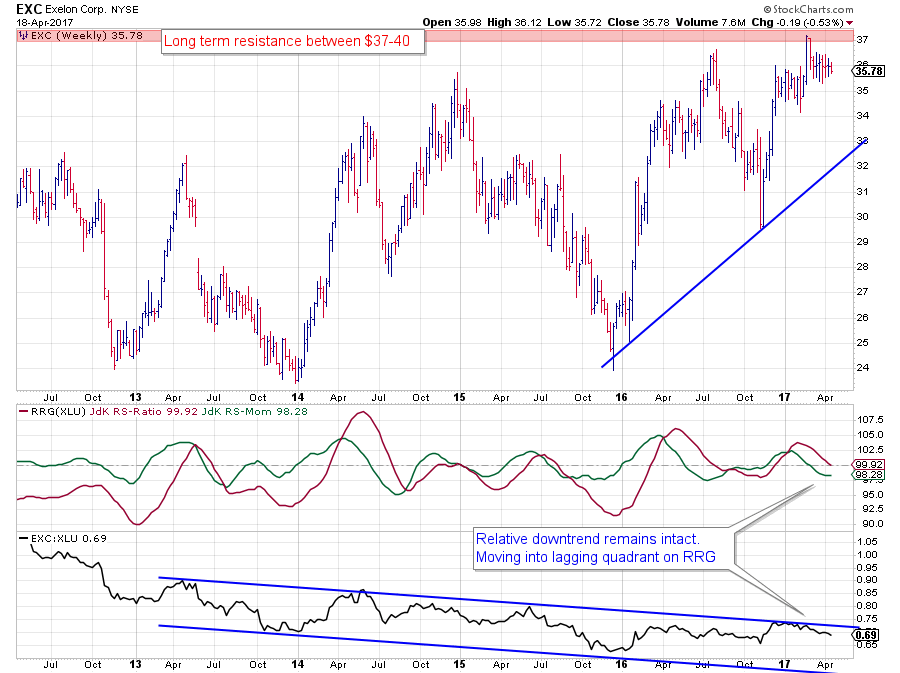 The relative trend for EXC against XLU is still moving down in a channel that started back in 2013. Over the course of the years, there have been a few rotations through all quadrants on the Relative Rotation Graph, but none managed to establish a solid relative (up-)trend.
The most recent rotation through the leading quadrant started at the end of 2016 and into 2017, in February EXC dropped into the weakening quadrant, and at the moment the stock is on the verge of crossing into the lagging quadrant.
Combining this weak relative outlook with the fact that the stock price is just below, and has tested, a heavy overhead resistance area between $ 37 - 40, suggests that not much (out-)performance should be expected from this stock in coming weeks.
Scana Corp. - SCG
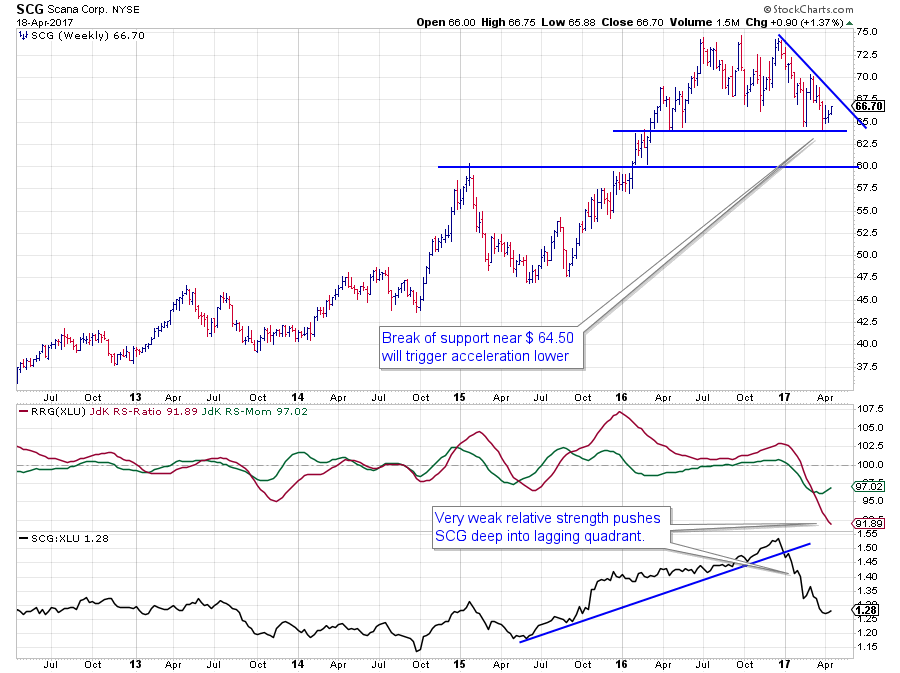 SCG moved into the lagging quadrant in the middle of February. At the moment it is the stock which is deepest inside the lagging quadrant showing the most mature and established relative downtrend against XLU.
Despite the recent uptick in relative momentum, SCG is still losing on the RS-Ratio axis which confirms that the downtrend is still fully intact.
The up move in momentum will very likely cause a pause, and maybe a mild recovery in relative performance against XLU but a turnaround from current relative levels is very unlikely. Another relative move lower, causing a rotation on the left-hand side of the RRG seems more likely.
The strong(er) stocks
Xcel Energy - XEL
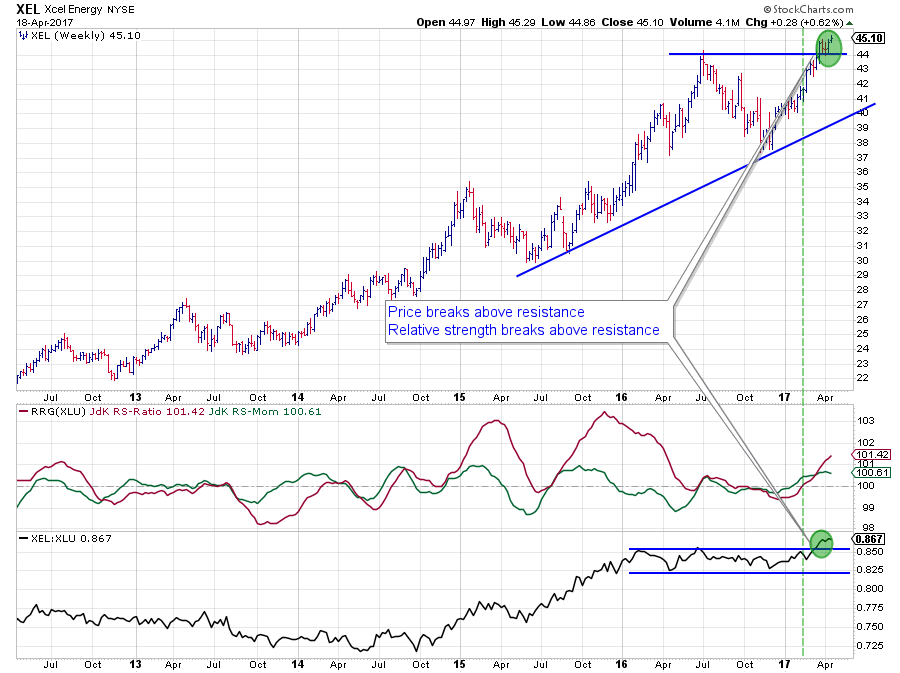 XEL is positioned well inside the leading quadrant and continues to gain on the RS-Ratio axis at a stable reading for RS-Momentum.
The relative charts above are showing this strong relative picture in more detail. The raw RS-Line broke out of a sideways range a few weeks ago and is holding up well above that breakout level.
In the RRG-Lines, RS-Momentum already improved above 100 at the beginning of January, followed by a cross above 100 in RS-Ratio in the middle of February. Despite the leveling off in RS-momentum, XEL is still moving higher on the RS-Ratio scale and pushing deeper into the leading quadrant.
This is a strong and mature relative uptrend which just got a new boost from a break in relative strength and confirmation/support by a break in price.
Pinnacle West Cap Corp. - PNW
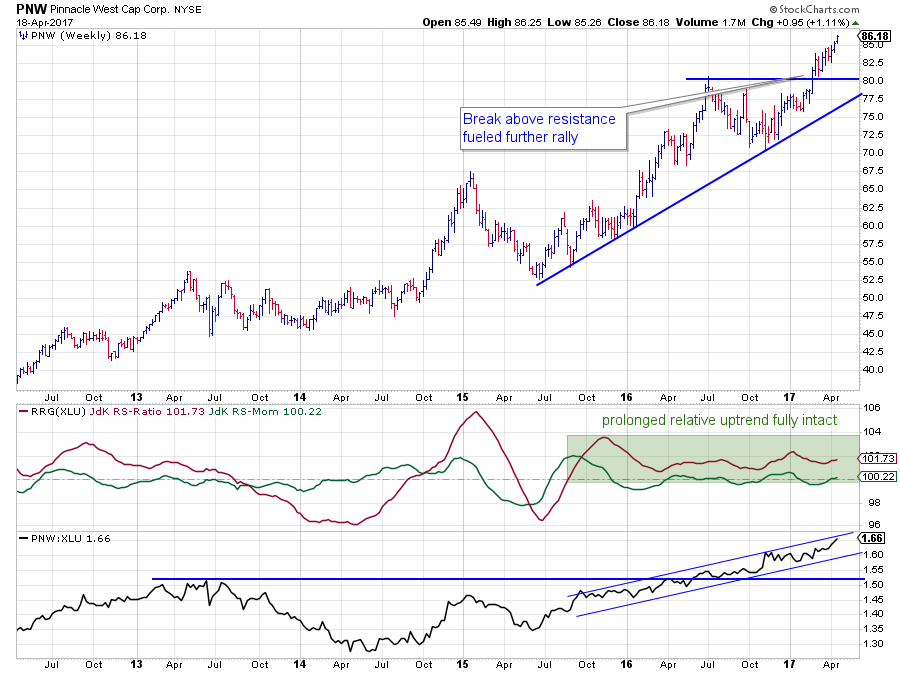
The second stock to watch for upcoming or further outperformance over XLU is PNW. On the Relative Rotation Graph, PNW just rotated back into the leading quadrant coming from weakening which usually is a sign of renewed strength after a corrective move.
The price chart looks strong after breaking above horizontal resistance around $ 80. This former resistance level will now start to act as support and can be expected to catch any corrective moves back towards this area.
The relative charts are showing a very strong picture. The JdK RS-ratio line crossed above the 100-level in August 2015 and managed to stay above that level ever since, indicating a continuing relative uptrend over XLU. This uptrend is quite well visible in the chart of the raw RS-Line in the lower panel of the graph above.
Nor the price graph, nor the relative graphs show any indication of upcoming weakness which makes PNW a very attractive stock for the time being. The current rotation, back up into leading at a heading of 0-90 degrees suggests an attractive new entry moment.
Entergy Corp Hldg Co. - ETR
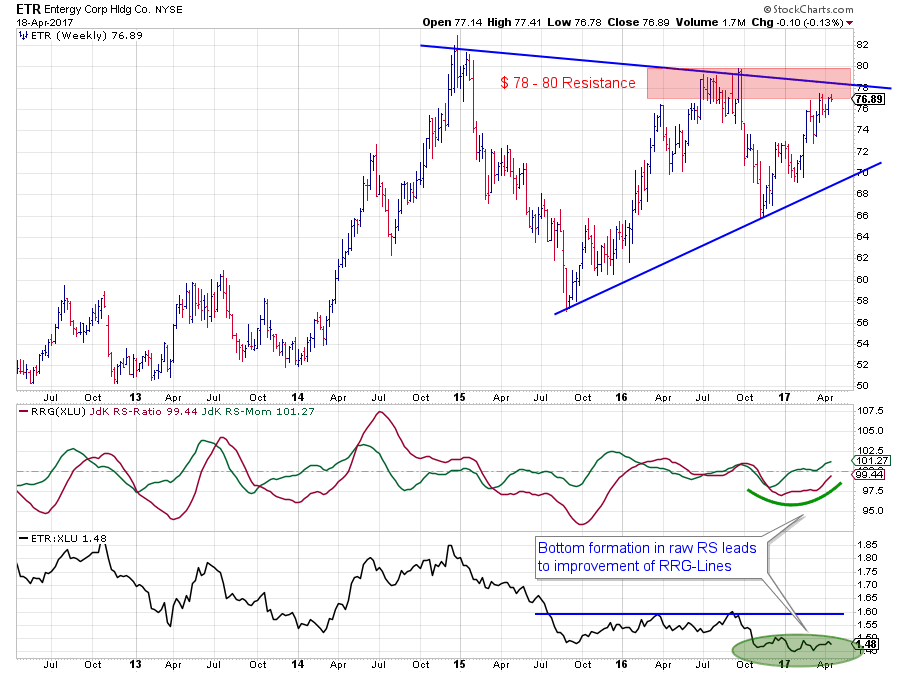
Inside the improving quadrant, I am watching ETR as an attractive candidate for outperformance.
This is primarily based on the strong heading of the tail, pointing N-E while the stock is positioned close to the leading quadrant.
Compare the price and relative charts for ETR above with the price and relative charts for PNW and XEL, and you can see why ETR (inside the improving quadrant) is a bit riskier than those two.
On the price chart, ETR has not broken any meaningful resistance level, yet, and is very close to a resistance area between $ 78 - 80 and shortly after that around $ 82 again. For a proper rally, these are some serious levels that need to be taken out to free new upside potential.
The RS-Line is at low levels but seems to be forming a bottoming formation which is sending the RRG-Lines higher, pushing from improving towards leading on the RRG. But here also a serious overhead resistance level is waiting at higher levels, and a break is needed to set off a relative uptrend.
Analysis vs. Portfolio Construction
In the article above I have given a few suggestions for utility stocks to underweight / sell from your portfolio as well as some ideas for stocks to overweight / buy. I hope I was able to make clear that these suggestions carry different levels of risk and therefore varying levels of potential.
Translating these, or any, suggestions into a position in your personal portfolio is where portfolio construction comes into play. This a completely different skill/craft/process than studying markets.
Adding equal money/percentage amounts of each stock to a portfolio creates a different risk profile for your portfolio than when you weigh each position according to some risk measure for example (volatility, distance to support level, Average True Range, etc..)
A lot of people confuse market analysis with portfolio constructing! Please be aware. They are different animals!
Julius de Kempenaer | RRG Research
RRG, Relative Rotation Graphs, JdK RS-Ratio, and JdK RS-Momentum are registered TradeMarks by RRG Research
Follow RRG Research on social media:


