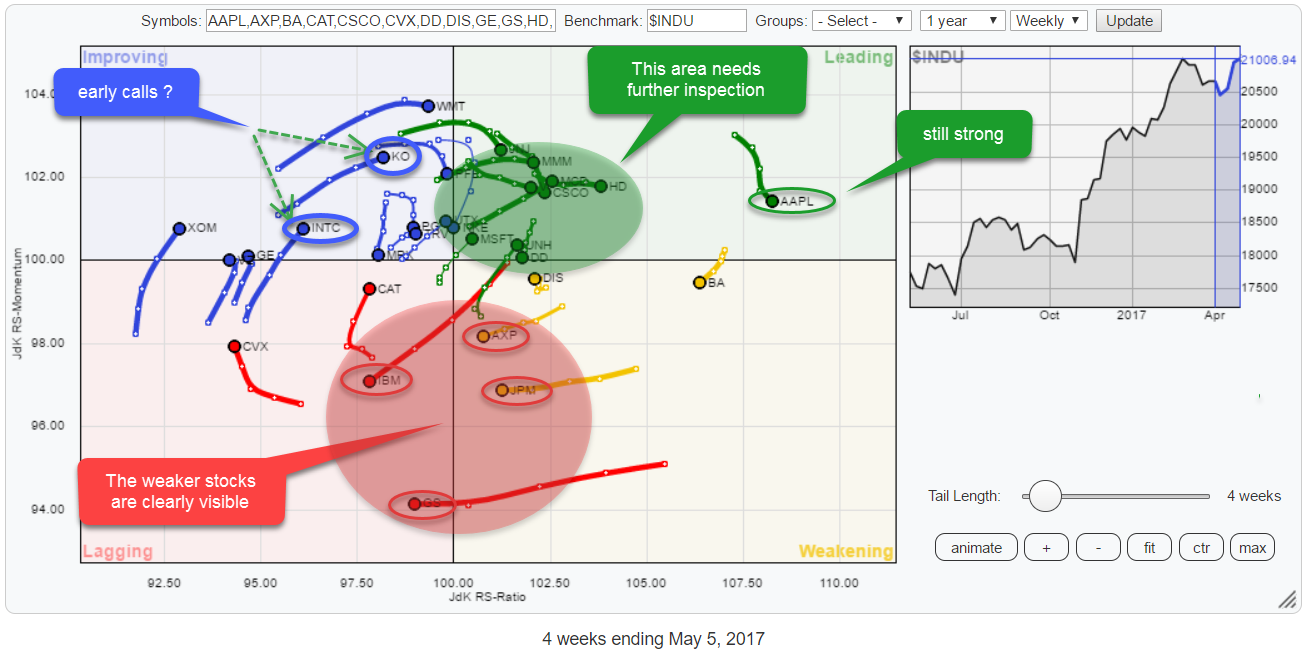
 The Relative Rotation Graph for the 30 DJ Industrials (INDU) stocks once again presents us with some interesting insights.
From the picture above we can read that AAPL is still the strongest stock in this universe with the highest JdK RS-Ratio reading and still inside the leading quadrant. Inside the leading quadrant, but more towards the center of the chart, we find a cluster of stocks that deserve a closer look as they may hold good upward (relative) potential.
Within the top-left, improving, quadrant KO and INTC are on track towards leading at strong RRG headings (0-90 degrees). WMT has just started to curl down which is why I have not included it.
The weak stocks which should be avoided, are more pronounced. These are AXP and JPM still inside the weakening quadrant and IBM and GS already inside the lagging quadrant.
Summary
- Rotation for individual tech stocks in DJ Industrials confirm strength for sector
- Only IBM rotating opposite from sector
- Financials, AXP, JPM, and GS, dominate weak names in DJ Industrials universe
- Opportunities for relative outperformance found in MCD, UNH, MSFT and UTX
- "Early calls" for KO and INTC
From a sector perspective
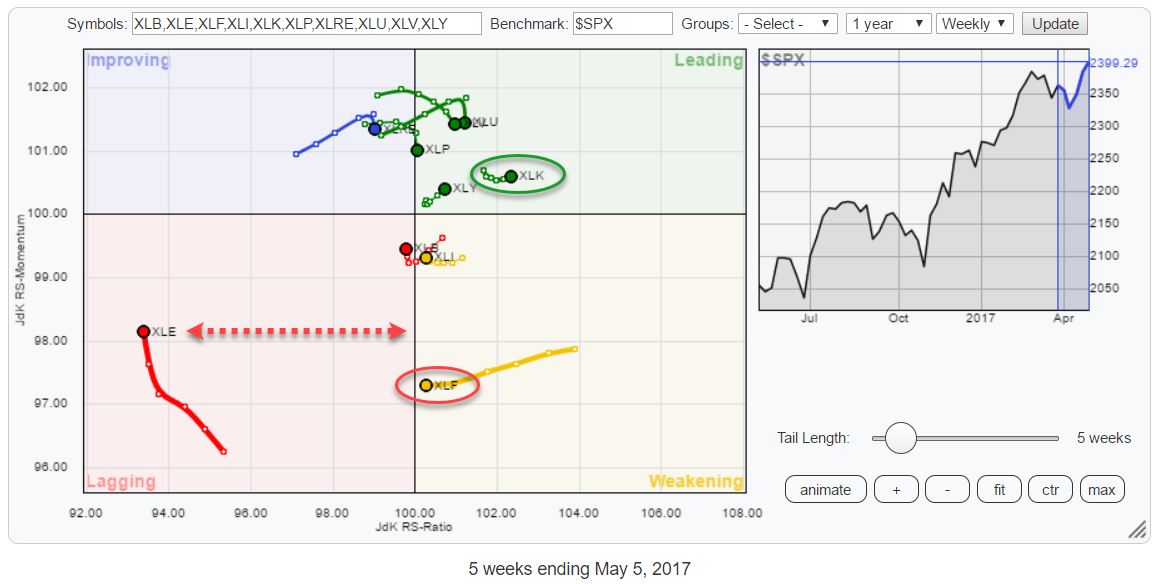 The RRG for US sectors more or less aligns with the rotations found for the individual stocks in the DJ Industrials Index. Technology (XLK) is rotating inside the leading quadrant and has just curled back up again, heading higher on both scales.
Financials are still inside the weakening quadrant but very rapidly heading for lagging, and it is only a matter of time before XLF will cross into the bottom-left quadrant.
Deep inside the lagging quadrant is the Energy sector (XLE). Despite the recent up move on the JdK RS-Momentum scale, this is still by far the weakest sector with a reading on the JdK RS-ratio scale that is detached from the other sector in this universe. Another rotation on the left-hand side of the RRG is most likely.
Stocks to avoid
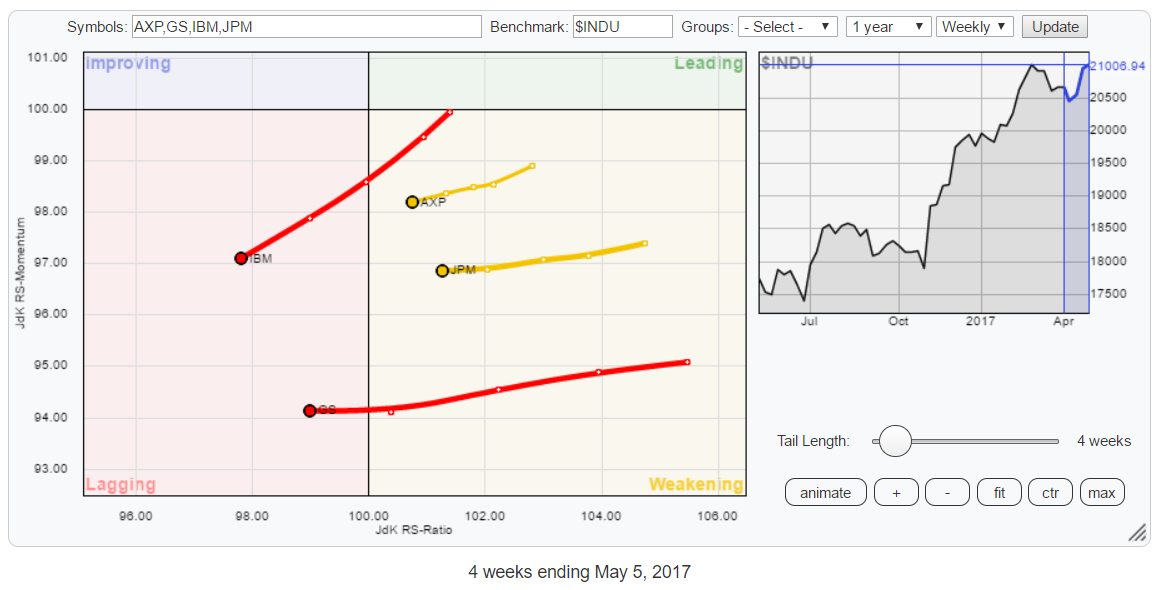 The four stocks that stand out in a negative way on the Relative Rotation Graph for DJ Industrial stocks shown in more detail in the RRG above.
Three out of the four names are financials; AXP, JPM, and GS, underscoring the weak rotational pattern for the Financials sector as a whole. With the Technology sector inside the leading quadrant on the sector RRG, IBM is the odd one out here.
International Business Machines - IBM
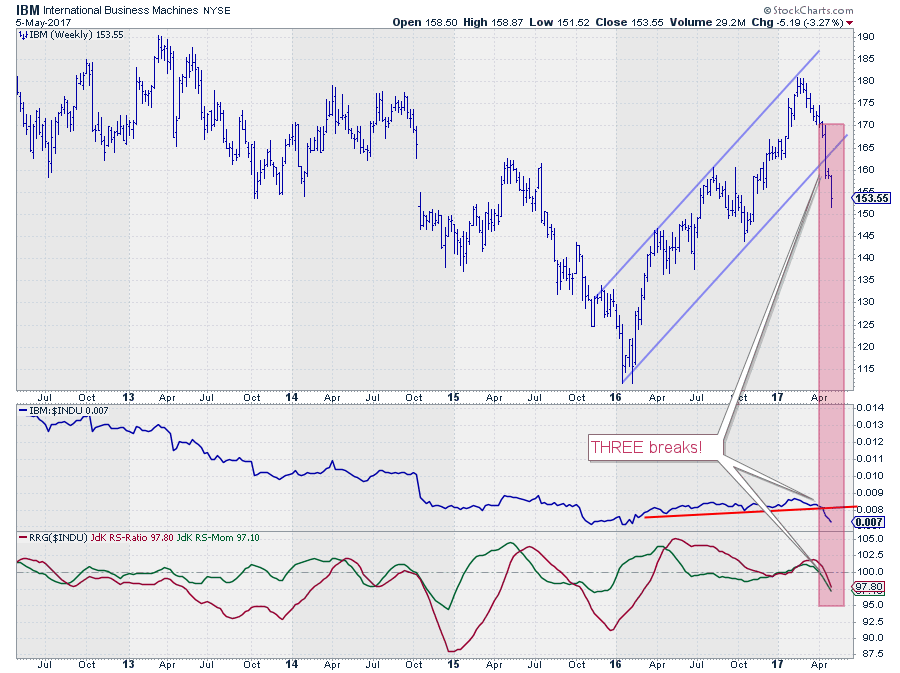
Out of the four technology stocks inside the DJ Industrials Index, IBM is the weakest at the moment. On the Relative Rotation Graph, IBM has one of the longest tails and shows a heading of almost 225 degrees. Meaning it is losing strength and picking up a negative pace at the same rate on both axes.
The price chart of IBM looks pretty horrible at the moment. After a nice run in 2016 which ended in a peak around $ 180 (resistance area from 2014) things started to deteriorate. In the first few months of this year, the decline still fitted well within the boundaries of the rising channel. But the big drop three weeks ago killed this up move and broke the rising support line.
At the same time, the slightly up-sloping support line in relative strength got broken, sending the RRG-Lines below 100 at a steep angle and pushing IBM deep(er) into the lagging quadrant.
All in all, this means that support levels have been broken on both the price- and the relative charts, opening up the way for more (relative) downside, but more importantly capping the potential upside as the old support levels are now expected to come back as resistance.
J.P. Morgan Chase & Co. - JPM
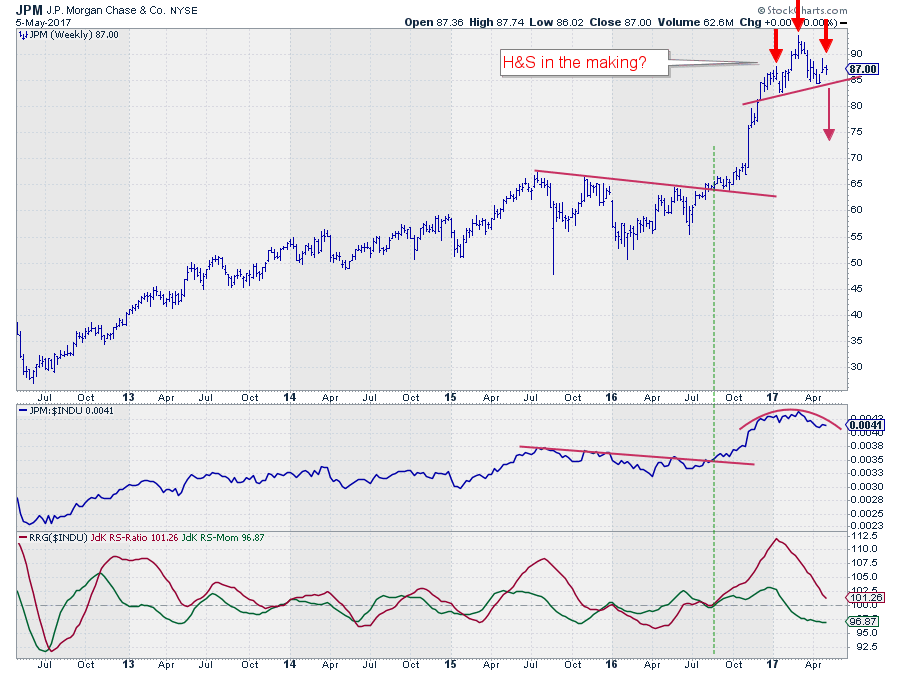
I have picked the JPM chart to inspect in a bit more detail as it looks like an H&S top is in the making.
After the upward break in August of last year, JPM moved firmly higher resulting in a peak above $ 90 early 2017. Looking at the price action in 2017 so far, the outlines of a Head & Shoulders top formation are starting to become visible.
The neckline of the formation slopes slightly upward and is currently running around $ 85. A break of this support level will complete the H&S pattern and very likely cause an acceleration lower, sending JPM back towards the $ 75 area.
On the relative charts, the RS-Ratio line is still above 100, albeit only just, while RS-Momentum moved below 100 a few weeks ago already. This positions JPM inside the weakening quadrant rapidly heading towards lagging.
A break below the neckline is still needed to kick this negative scenario into action, but the odds are stacking up against JPM for now. At least be very careful with any holdings.
American Express - AXP
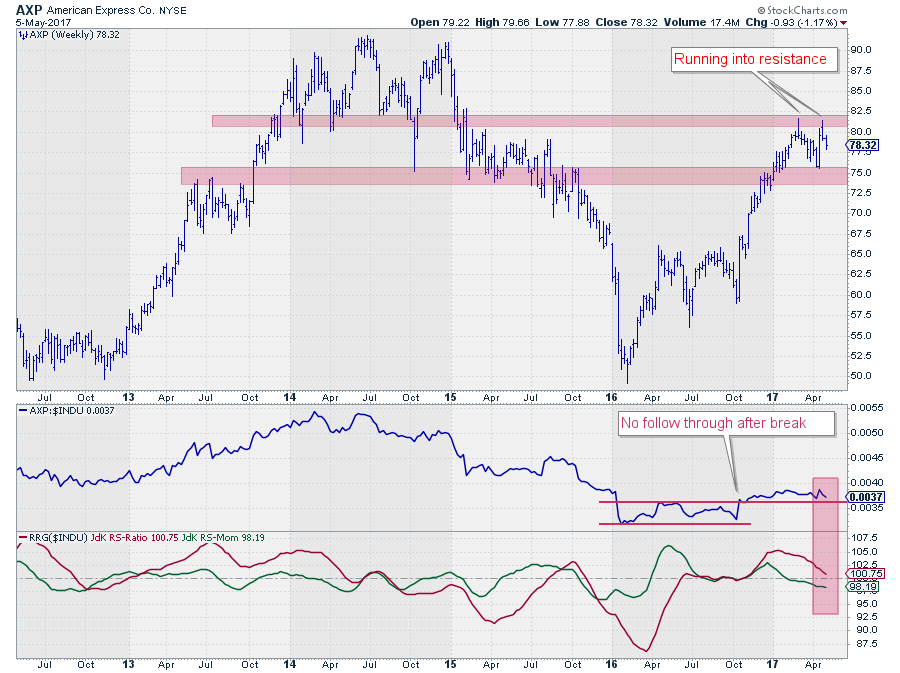
AXP shows a somewhat similar chart as JPM above.
On the price chart, the stock ran into resistance and could be in the process of building a double top formation. The trigger will be a break below the support level coming off the previous low at $ 75.
The RS-Line was not able to push significantly higher after its upward break back in October and has been moving more or less sideways. This caused AXP to rotate into the weakening quadrant and to head for the bottom-left lagging quadrant.
For the time being at least a cautious approach seems to be the way to go.
Goldman Sachs Group - GS
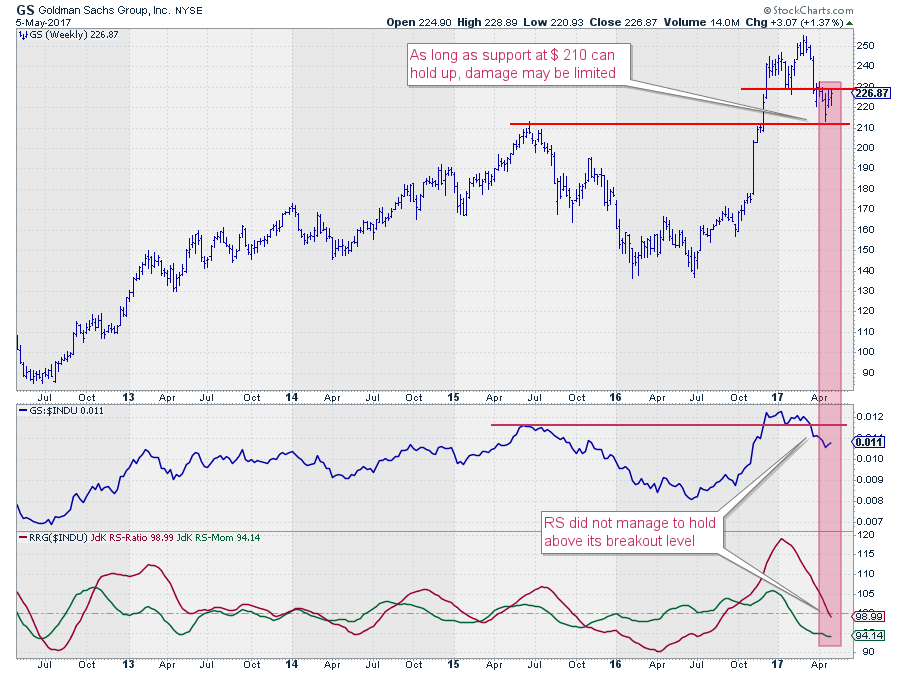
GS is heading up the financial stocks inside the DJ Industrials way. But this time it's on the way down!
On the price chart, GS violated the series of higher highs and higher lows, signaling the end of that uptrend. On the long-term chart, $210 is an important support level (old resistance) which we should keep an eye on as that level will very likely hold the clue to future price action for GS.
On a relative basis, GS is rapidly weakening and pushing deeper into the lagging quadrant on the Relative Rotation Graph. The raw RS-Line has already broken back below its former resistance (now support) level, and the RS-Ratio line is dropping at a steep angle, suggesting that more weakness lies ahead.
Opportunities
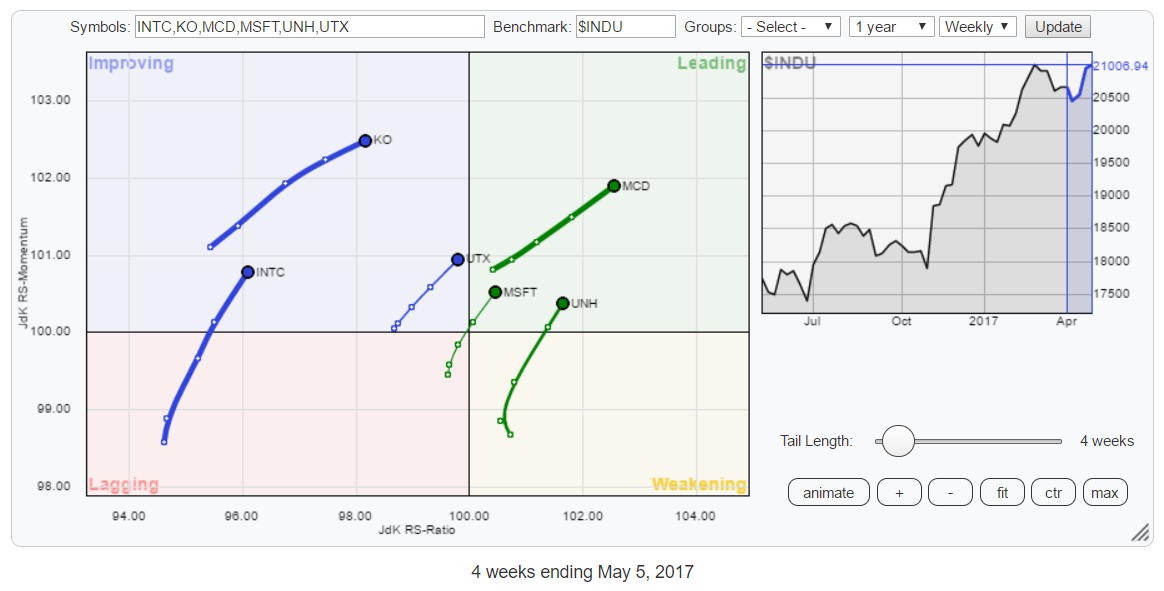 The RRG above zooms in on the green shaded area on the first RRG at the top of the article. I have picked the stocks which are showing the most promising tails.
Inside the leading quadrant, these are MCD, which seems to be strongest, at first sight, followed by UNH, MSFT, and UTX which is as good as inside the leading quadrant.
KO and INTC are still inside the top-left, improving, quadrant but their relatively long tails and positive RRG heading warrant for a closer look.
McDonalds Corp - MCD
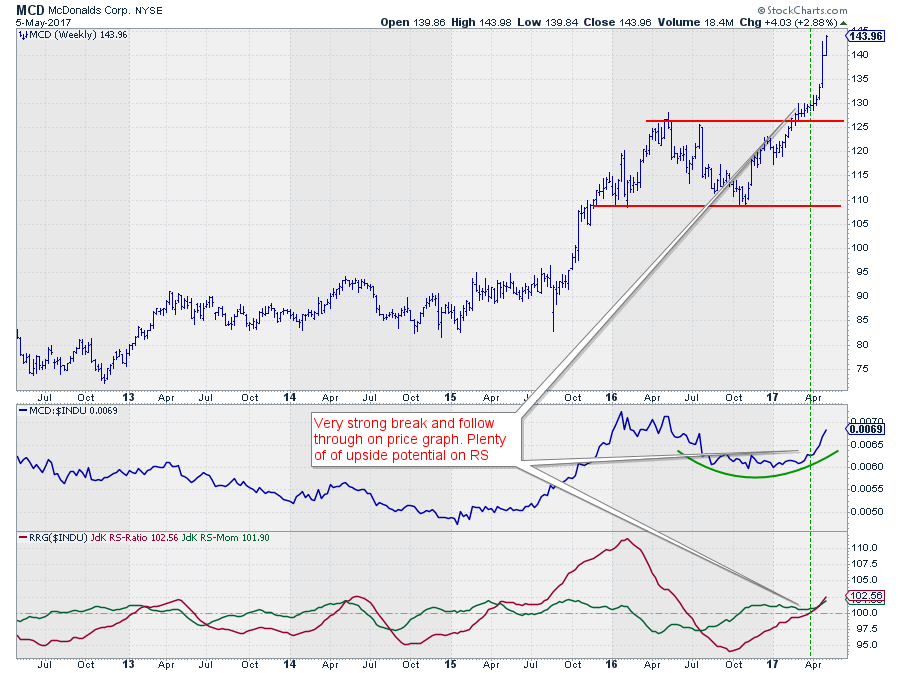
The stock that stands out most from the green shaded cluster on the RRG at the top of this article is MCD. It is showing an almost straight tail at an almost 45-degree heading. This means that MCD is gaining on both axes (45-degree heading) and it is a strong move (long tail).
The break above $ 125 at the end of last year confirmed the long-term strength and triggered a continuation of the existing trend.
At the beginning of this move, the relative strength of MCD was in line with the market, hence the flat RS-Line. A few weeks back in April the RS-Line came to life again and completed the (rounded) bottom in relative strength pushing RS-Ratio above 100.
With both RRG-Lines almost overlapping each other now and the fact that they are both still at low levels implies that there is still a lot of upward relative performance available.
Microsoft Corp. - MSFT
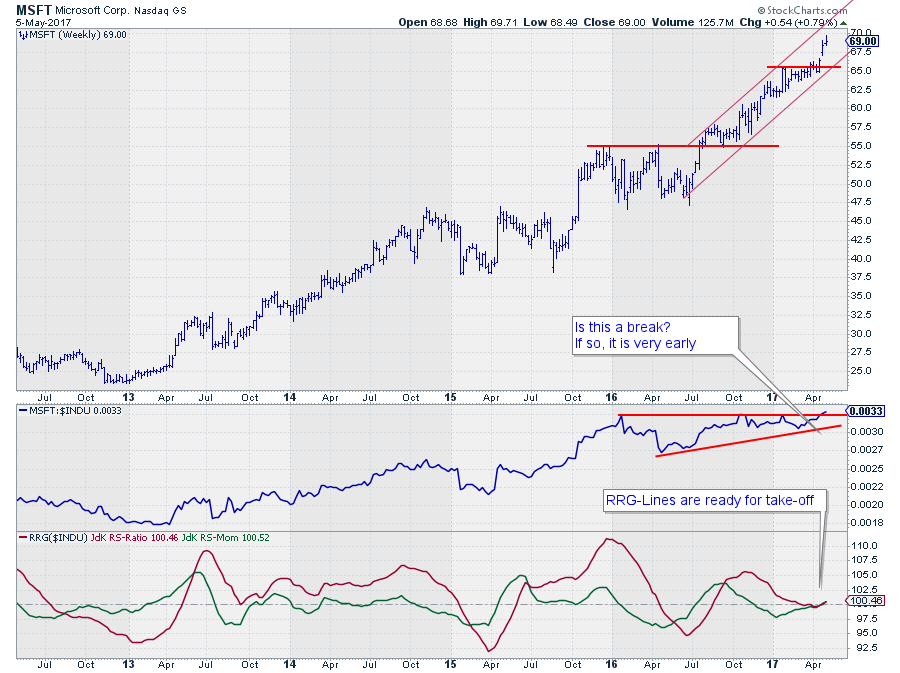
Where we found IBM heading lower on both RRG axes while breaking support levels on the price chart, we see MSFT doing the opposite.
The price chart is showing an upward sloping channel in which a series of higher highs and higher lows is working its way higher. With the break of the former high at $ 65 this uptrend just got another confirmation.
For more than a year the relative strength line was not able to push beyond its previous highs, causing a horizontal resistance level for the RS-Line. However, the lows during the same period were all formed at subsequently higher levels, indicating an underlying upward thrust.
At the moment a break beyond horizontal resistance in relative strength looks imminent although it is early, but I will keep an eye on this RS action as it will very likely pull the RRG-Lines higher and they are ready to move higher off of the 100-level.
Just like for MCD there is plenty of relative upward potential available for MSFT.
Unitedhealth Group Inc. - UNH
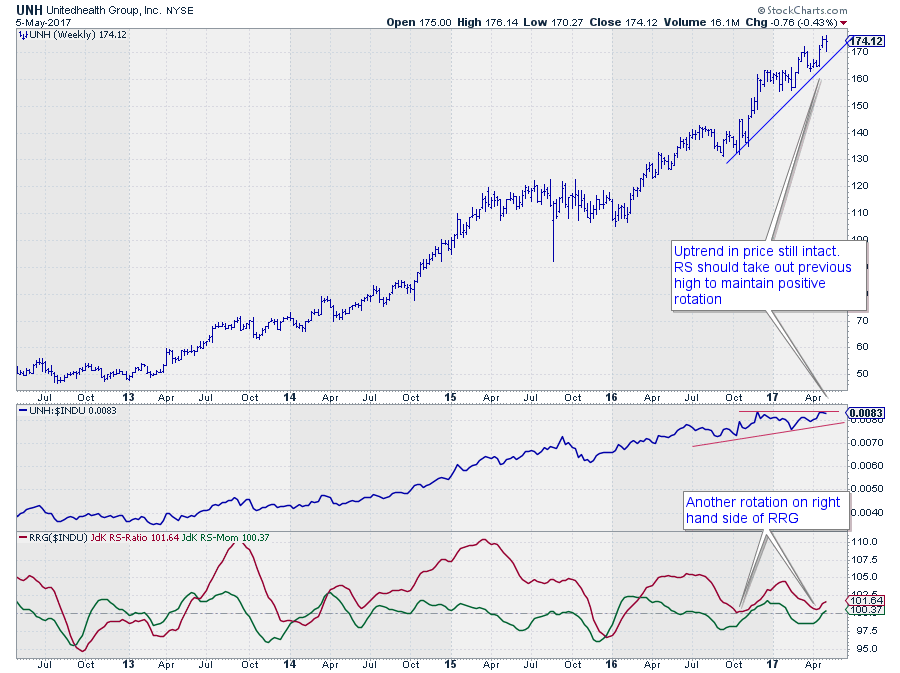
The uptrend in price is still intact for UNH. On the RS-chart against $INDU, UNH needs to push beyond its previous highs to maintain the upward momentum which has been flat since late last year.
The promising signs are coming from the positioning and rotation on the Relative Rotation Graph. Our research has shown that stocks which are inside the weakening quadrant but starting to turn back up towards the leading quadrant again have a high(er) chance of showing positive returns in the 12 week period after their RRG-heading turns into 0-90 degrees.
On the price chart in combination with the RRG-Lines, this translates into an RS-momentum line dropping below 100 and then turning up again (from levels < 100), while RS-Ratio manages to remain above 100 and turn back up again without falling below 100. The most recent two instances of such a move are indicated by the arrows off the text balloon.
Based on this finding and the fact that the price trend is still up, a good performance is expected for UNH in coming weeks.
United Technologies - UTX
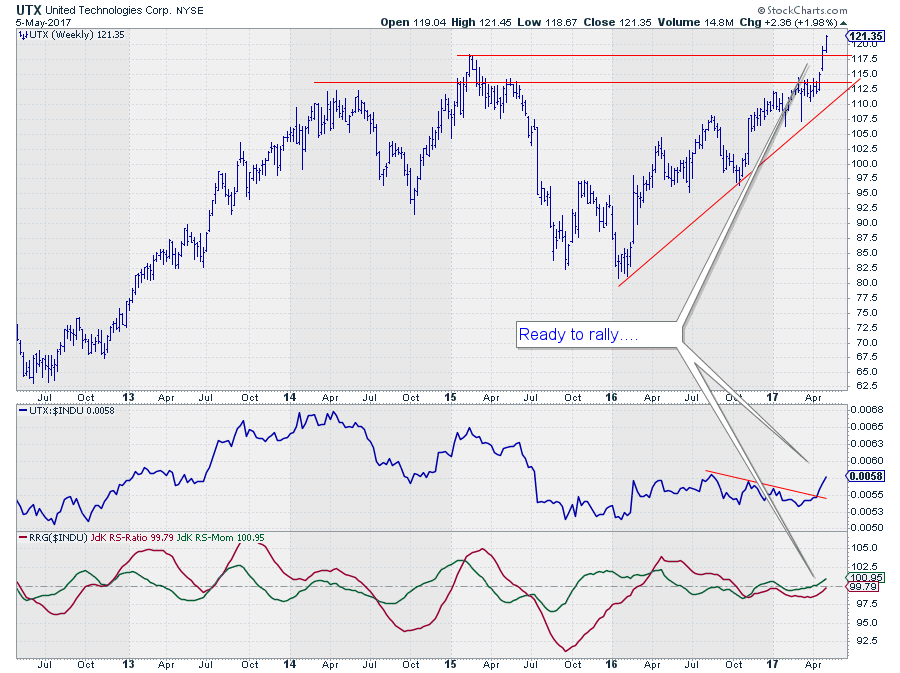
On the price chart, UTX has cleared a significant overhead resistance are and continues to move higher.
Relative Strength started to improve. When the raw RS-Line can take out its previous high more relative upside comes available.
The RS-ratio line is on the verge of crossing above the 100-level which will put UTS inside the leading quadrant while at a positive RRG-Heading.
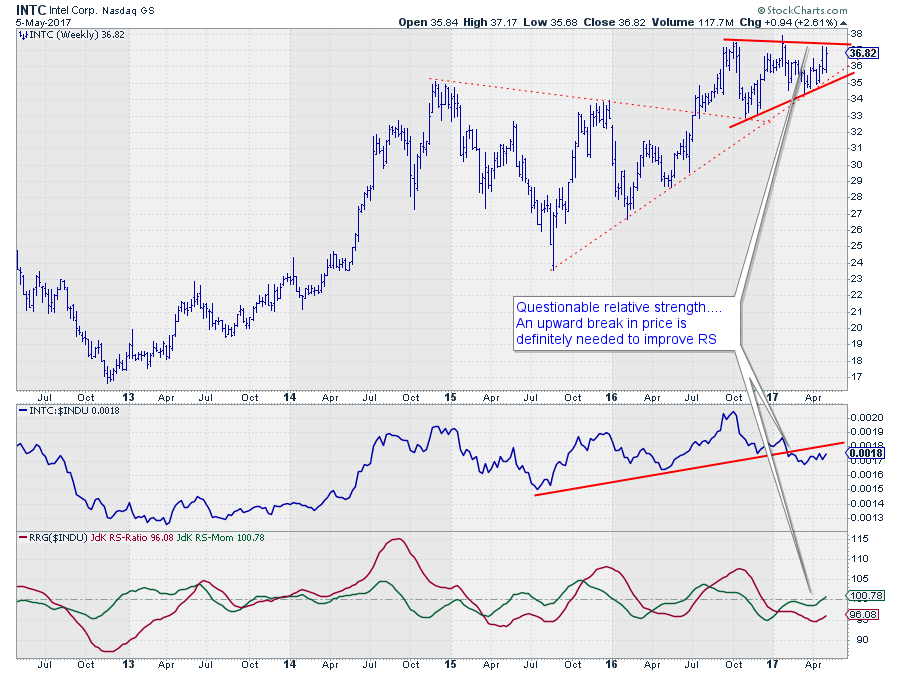
Intel Corp. - INTC
This is one of the stocks which I labeled as "early call."
On the RRG INTC is inside the improving quadrant but still at fairly low RS-Ratio levels, the good RS-Momentum value and the strong RRG-Heading make it a stock to investigate further.
Looking at the price graph in combination with the relative charts immediately makes clear what the problems are.
The first things is that price is contained inside a (symmetrical) triangle formation which provides no real clue about the breakout level. Based on the longer term upward support line which still holds value, I am inclined to call for an upward break, but otherwise, there is no indication.
The relative strength line shows a downward break of rising support which warrants a negative relative outlook for coming weeks as the upward potential for RS is now limited to the level of the old support line. This contradicts with the RS-Momentum line crossing above 100 at the moment.
All in all, these are mixed signals. The long tail indicates strength and the RRG-Heading is positive, RS-Momentum is crossing above 100 and if the uptrend in price can hold up an upward break from the triangle will follow.
As I said, it is an early call but with two out of three readings positive I am inclined to keep a close eye!
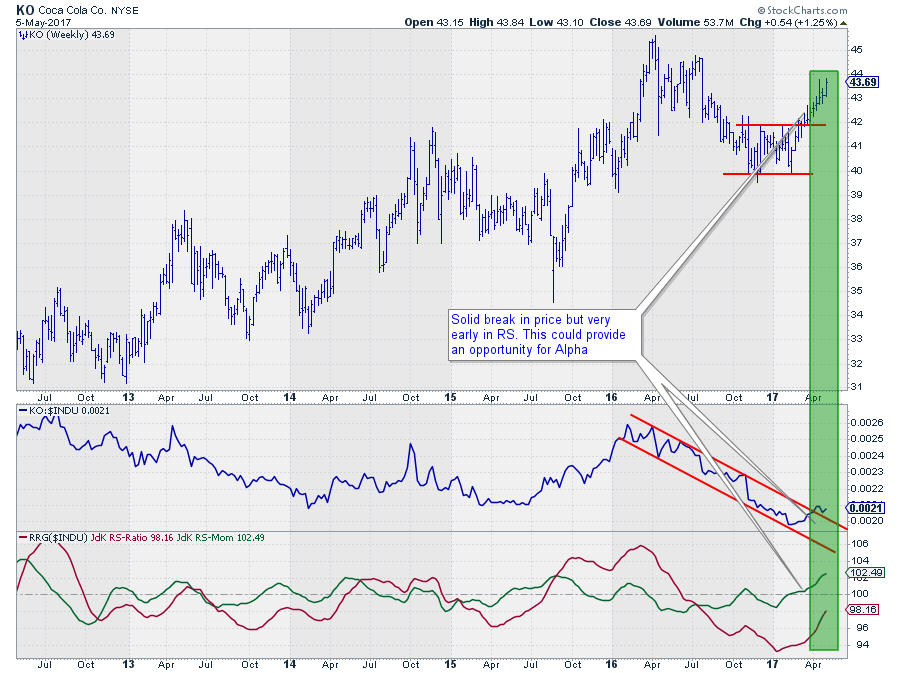
Coca Cola Co. - KO
When you compare KO's position on the RRG with INTC, you will see a good example of why higher RS-Momentum and RS-Ratio values, a longer tail and a strong(er) RRG-Heading are better.
KO recently managed to complete a double bottom formation after a decline from the almost $ 50 peak. On the long term chart, the bottom at $ 40 is one in a series of higher highs and higher lows. Upside potential is now available to the previous peaks that were set in 2016.
Where KO is clearly stronger than INTC, is on the relative strength charts. The downtrend in raw RS that characterized all of 2016 is now broken which should, at least temporary, protect the relative downside. This improvement caused RS-Momentum to move above 100 which started to pull RS-Ratio higher.
As said this is also an "early call," albeit a little less "early" than INTC. Price holding up above $ 42 in coming weeks will be important for the positive scenario to work out. If you're happy to take that into account, INTC could offer a nice opportunity to add some Alpha to a portfolio.
Julius de Kempenaer | RRG Research
RRG, Relative Rotation Graphs, JdK RS-Ratio, and JdK RS-Momentum are registered TradeMarks by RRG Research
Follow RRG Research on social media:
If you want to discuss RRG with me on SCAN, please use my handle Julius_RRG so I will get a notification

