 The Relative Rotation Graph for US sectors shows four sectors with rotational patterns that catch the eye and deserve a further investigation.
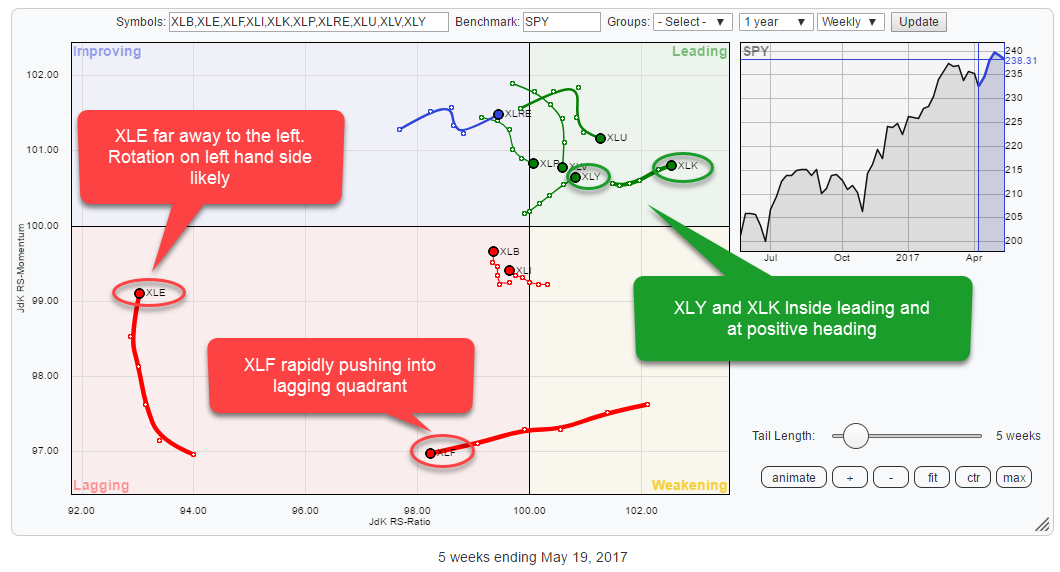
Inside the lagging quadrant, these are Energy (XLE) and Financials (XLF) and inside the leading quadrant, I am looking at Technology (XLK) and Consumer Discretionary (XLY).
The balance of power on the RRG above is shifted to the leading quadrant. Five of the ten sector-ETFs on the RRG are positioned inside the leading quadrant (XLP, XLU, XLV, XLY, and XLK) with one inside the improving quadrant (XLRE). No sectors are currently found in the weakening quadrant, and four are inside the lagging quadrant (XLE, XLF, XLB, and XLI).
An interesting observation that can be made from this RRG is the clustering of eight sectors, all but XLE and XLF, in the top-right area and two that are more or less "detached" in and towards the bottom-left.
A quick take from such a rotation is that by simply avoiding the Energy and the Financials sector a portfolio manager already has a very good chance of outperforming the S&P 500. In this case, the situation is even more pronounced because of the fact that XLE and XLF are much further away from the center (benchmark) of the chart than the other sectors which are much more positioned around and closer to, the benchmark.
Summary
- US sector RRG shows four sectors with interesting rotational patterns
- Technology (XLK) and Consumer Discretionary (XLY) in leading
- Energy (XLE) and Financials (XLF) in lagging
- Daily Relative Rotation Graph backs rotational patterns on weekly RRG
- XLE expected to rotate on left (negative) side of RRG and remain in relative downtrend
- XLF rapidly pushing deeper into lagging
- XLY moving into leading quadrant at RRG-heading of almost 45 degrees
- XLK strongest sector at the moment with some risk for a correction (new entry opportunity).
Daily Relative Rotation Graph
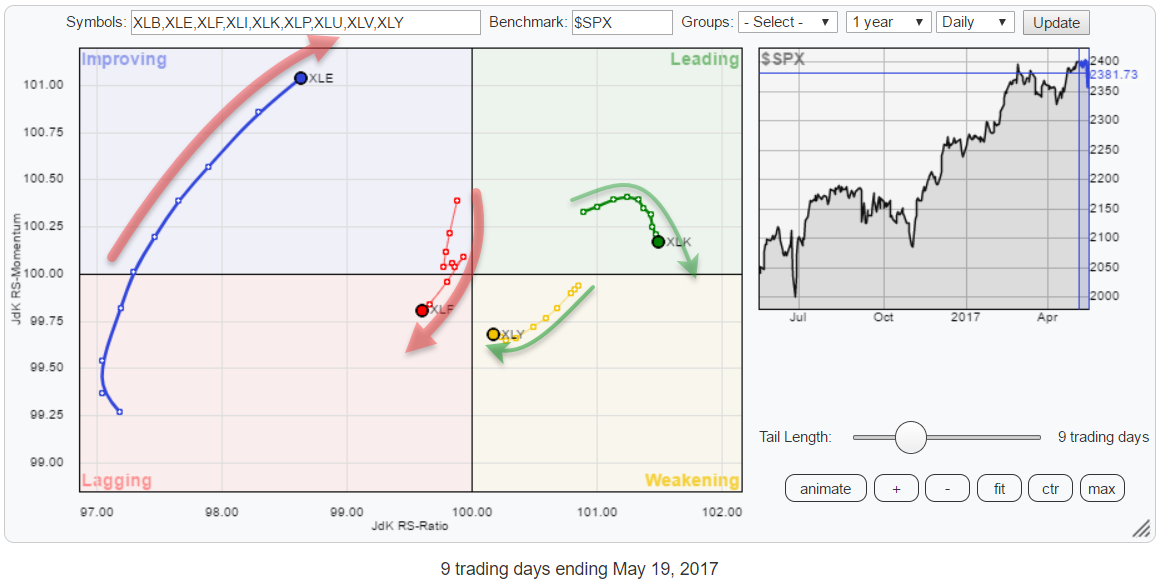 Zooming in on the daily version of the Relative Rotation Graph for US sectors we can see that both XLK and XLY are still on the right-hand side of the chart. XLK is in the leading quadrant but losing relative momentum and heading for weakening while XLY is already rotating through weakening and started to stall and potentially turn back up again in the past two weeks. This can be derived from the last two to three observations being very close together.
On the left-hand side, relative downtrends, of the RRG chart we find XLE and XLF. With XLF just having completed a rotation through the improving quadrant without being able to push into leading and now entering lagging again and thus confirming the weakness that is visible on the weekly RRG.
XLE is high up in the improving quadrant at a positive RRG-Heading but still, needs more improvement to reach leading. With the sector positioned at very low Jdk RS-ratio levels on the weekly RRG, this rotation should be seen as a recovery within the longer term relative downtrend.
Energy Select Sector SPDR - XLE
The current level of the RRG-Lines position XLE in the top-left, improving, quadrant on the Relative Rotation Graph. The RRG-Heading is also positive (between 0-90 degrees).
However, there are a few observations which make it difficult to get overly excited about the Energy sector.
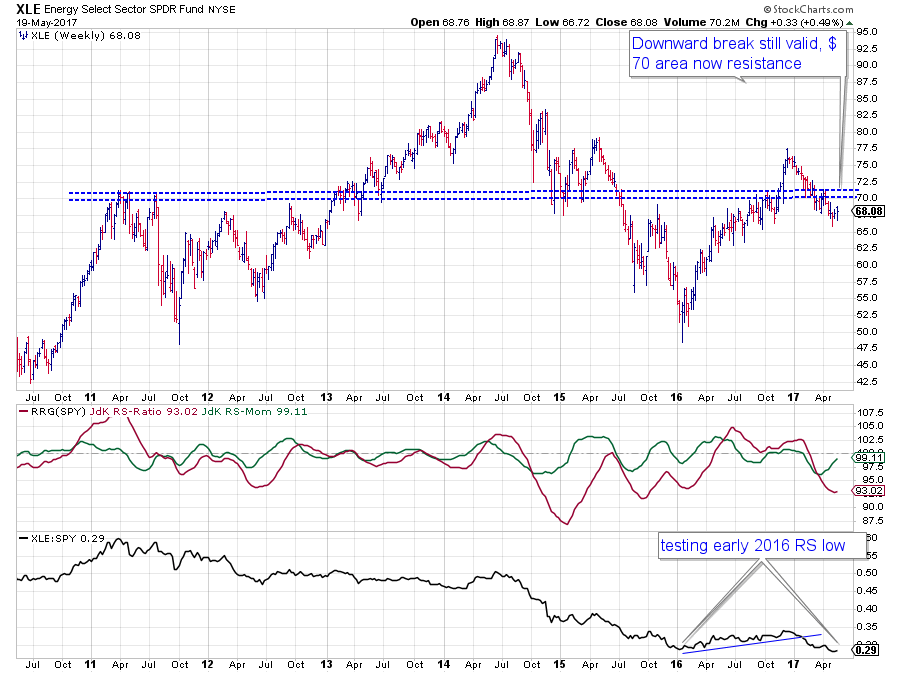
First of all the recent move on the price chart has caused the uptrend to break, and at a shorter time frame, one could even see a downtrend (channel) emerging out of the late 2017 peak. This decline has broken below the $ 70 level which acted as support and resistance already a few times over the past few years.
At the moment the area around $ 70 is again seen as a resistance level. This limits the upward potential for the time being while there is plenty of room for XLE to drop further in price before hitting support.
From a relative point of view, the shallow uptrend that was visible in the RS-Line during 2016 was broken early this year. At the moment the RS-Line is challenging support offered by the early 2016 low in relative strength. A break lower will surely confirm the current weakness.
With the JdK RS-Ratio line at very low levels, it is very well possible that JdK RS-Momentum will peak again and turn down, either inside lagging but more likely inside improving before XLE reaches the leading quadrant. For now, XLE is and remains the weakest sector in this universe.
Financial Select Sector SPDR - XLF
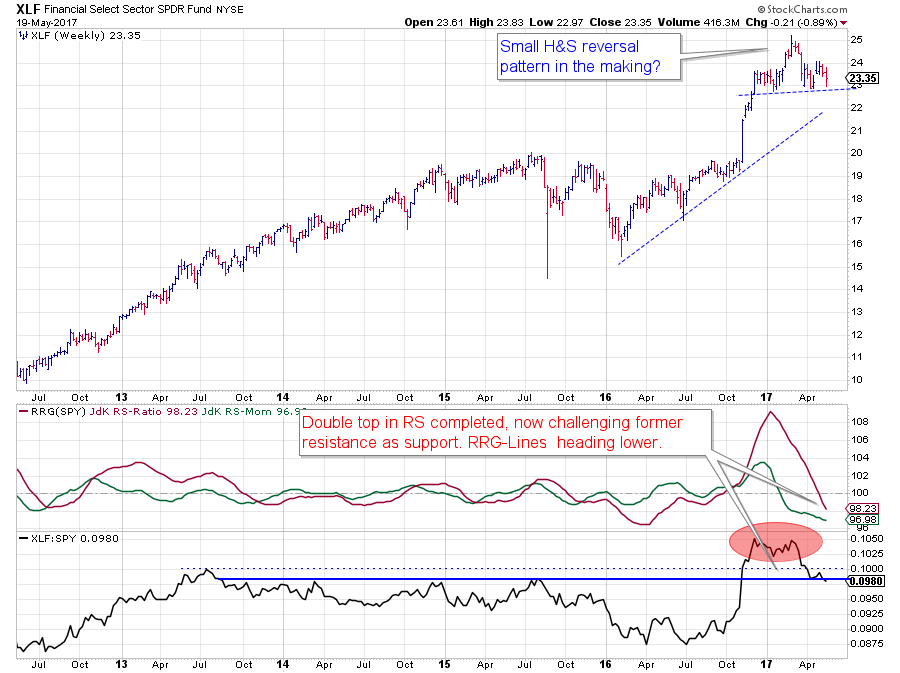
On the RRG, the Financials sector is moving left on the RS-Ratio scale in an almost straight line. This indicates a steady loss of relative strength at a stable pace (momentum).
The middle pane in the chart above with the red and green RRG-Lines show how this looks on a regular chart. Confirmation for the relative weakness is given by the raw RS-Line where we see the completion of a double top pattern. Currently, the RS-Line is testing the former resistance area as support but very close to breaking back below it. Such a break will very likely cause an acceleration in the loss of relative strength against SPY.
The price chart is not helping either. After a nice rally higher, XLF now seems to be forming a Head & Shoulders pattern with the neckline running just below $ 23. Here also a break below this level will very likely cause a further decline in price, potentially targeting the support zone around $ 20.
Based on these observations no outperformance is expected for the Financial sector in coming weeks/months.
Consumer Discretionary Select Sector SPDR - XLY
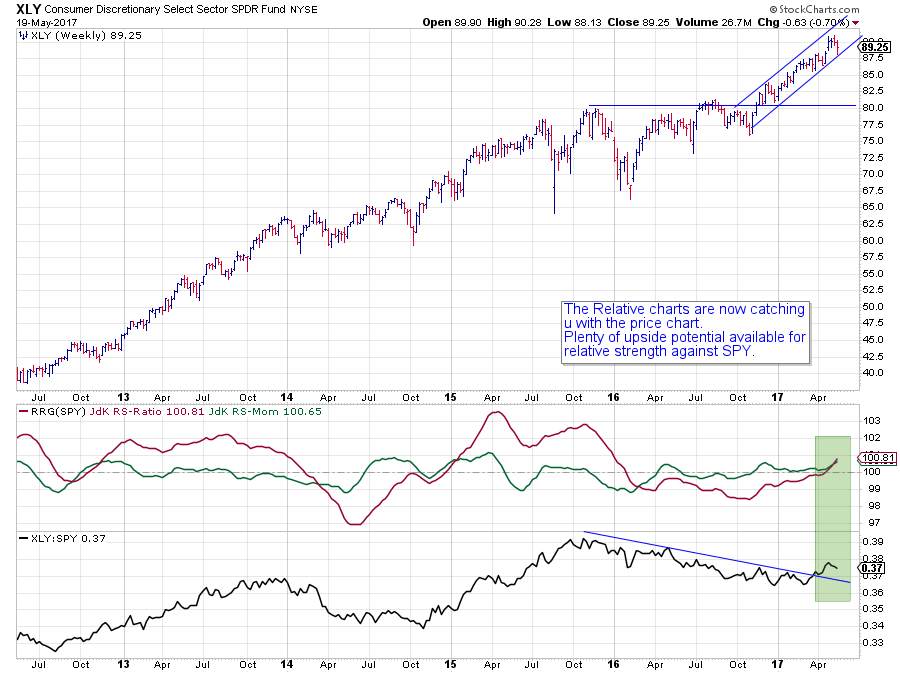
The Discretionary, or Cyclicals, sector went through a period of relative underperformance of more than a year. The RS-Line peaked back in October 2016 and then showed a steady downtrend until early this year.
The RRG-Lines during this period showed an RS-Ratio line steadily below 100, indicating a relative downtrend and the RS-Momentum line oscillated back and forth above and below 100 a few times causing rotations to complete on the left-hand side of the RRG.
Moving into April, the RS-Line managed to break above its falling resistance line, and the RRG-Lines started to push higher at the same pace causing an RRG-Heading of almost 45 degrees (positive).
After breaking horizontal resistance near $ 80 on the price chart, XLY has been steadily rising, and a narrow channel is now visible and guiding the Discretionary sector higher. But even when this, short and steep, channel would fail in the near-term there is enough cushion for the market to absorb some declines without harming the uptrends in both the relative- and the price- charts.
Technology Select Sector SPDR

Finally the Technology sector. After breaking out of its already rising channel (dashed lines) at the beginning of 2017, XLK continued to rally and a new steeper channel seems to have come into play.
Currently, XLK is testing the upper boundary of the new and steeper channel which increases the risk for a temporary, corrective move. However, on both the price and the relative graphs there is enough room for a correction without harming the positive outlook for the Technology sector in the near term.
As a matter of fact, such a correction will very likely be a good opportunity to participate in the next leg up. On the daily RRG chart (second RRG at the top of this post) shows XLK already losing some relative momentum and approaching the weakening quadrant. A turn of the RRG-Heading into the 0-90 degrees area again seems to be a good trigger.
Julius de Kempenaer | RRG Research
RRG, Relative Rotation Graphs, JdK RS-Ratio, and JdK RS-Momentum are registered TradeMarks by RRG Research
Follow RRG Research on social media:
If you want to discuss RRG with me on SCAN, please use my handle Julius_RRG so that I will get a notification


