RRG Charts January 28, 2018 at 03:13 PM

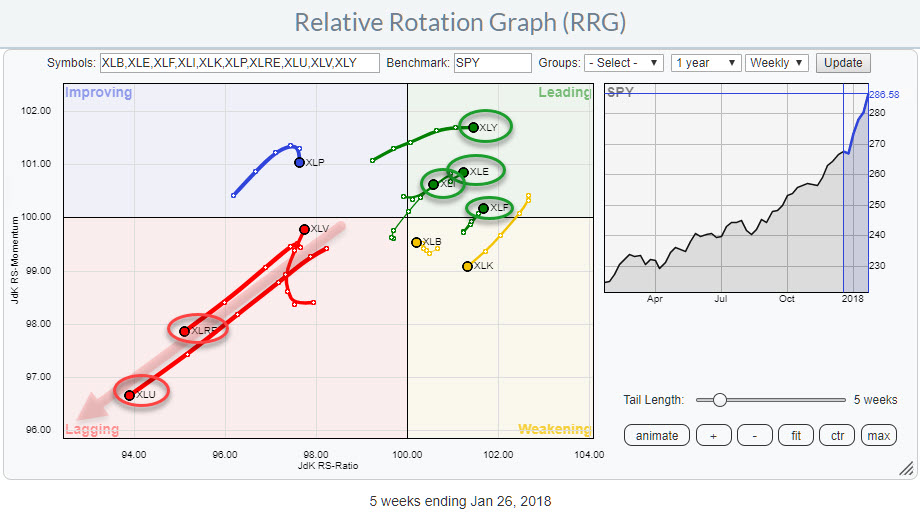
The Relative Rotation Graph shows the positions of US sectors against SPY as of 26 Jan. Sometimes the rotational patterns are not so clear but in this example, there is one observation sending a screaming message: Avoid Real-Estate and Utilities... Read More
RRG Charts January 15, 2018 at 08:30 AM

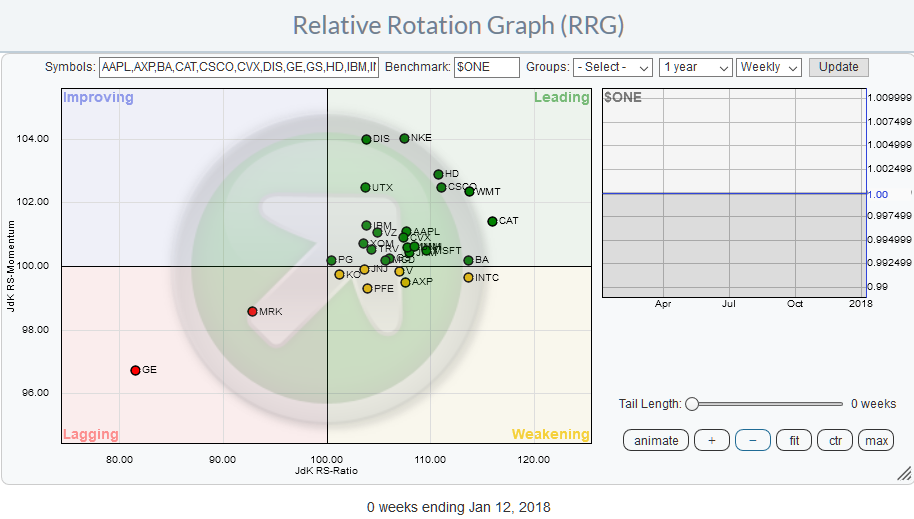
In my last blog, we looked at the 30 components of the Dow Jones Industrials Index and more specifically at the relative positioning and relative rotation of these 30 stocks around their common denominator the DJ Industrials index ($INDU)... Read More
RRG Charts January 08, 2018 at 10:27 AM

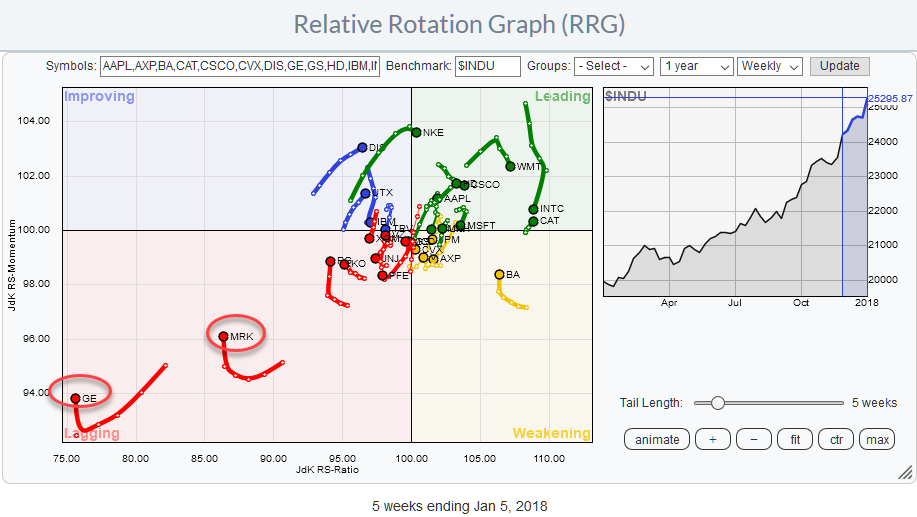
The Relative Rotation Graph shows the members of the DJ Industrials index against $INDU. This is a so-called closed universe which means that all elements that make up the universe are present in the plot... Read More