 Last week I attended the CMT Association’s annual symposium in New York City. One of the industry events that I visit each year.
On the one hand to learn from other industry professionals but very much also to catch up with friends and maintain relationships.
As I am writing this, I am still in New York digesting all information and organizing my notes which I gathered during the previous week. And of course, writing this blog-post. Which is an interesting exercise given the political events that occurred over the weekend.
Maybe things will be turned upside down at Monday’s opening of the exchanges, who knows? But I am taking the plunge and look at the rotational patterns as they unfolded up to last Friday and I am very curious to learn how things will progress next week.
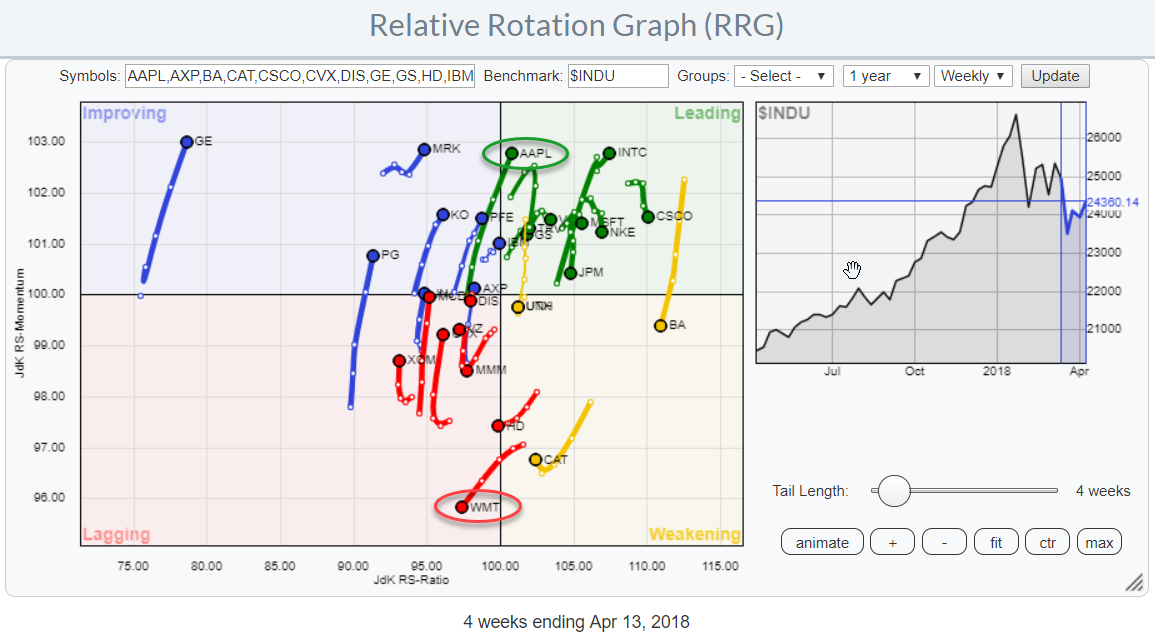
The chart above shows the Relative Rotation Graph for the members of the Dow Jones Industrials index. On this chart, both AAPL and WMT are standing out for their opposite rotations and I want to inspect them further.
Summary
- Weekly RRG shows opposite rotations for AAPL and WMT
- AAPL crossing into leading while WMT moves into lagging
- short term rotation on daily RRG is confirming the weekly picture
Weekly rotation
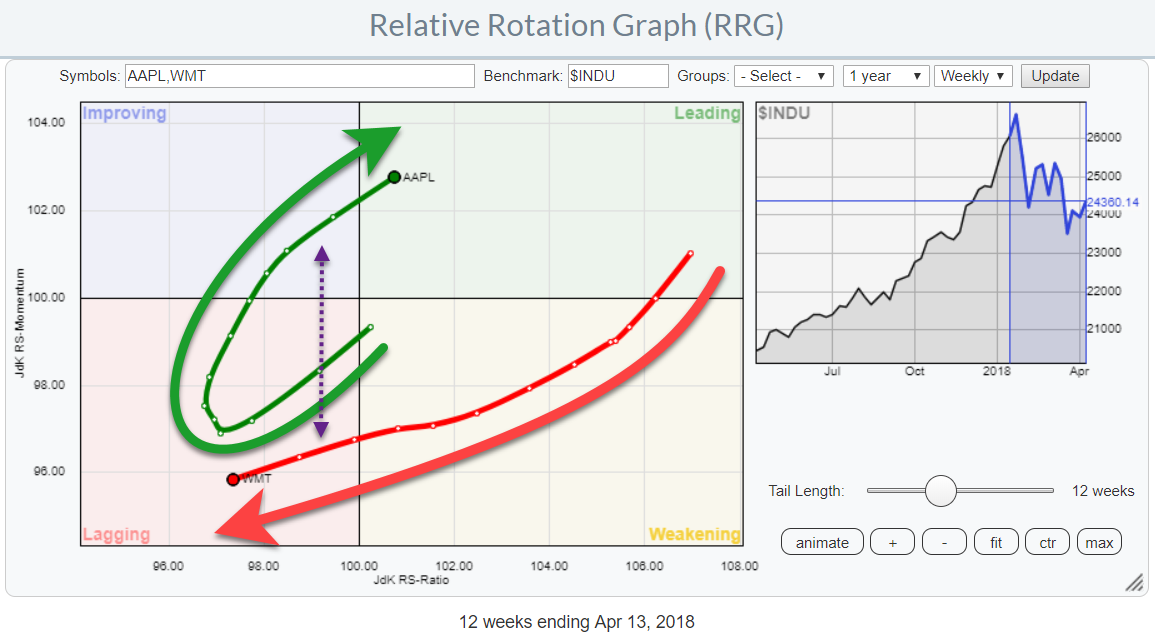 The above RRG shows the isolated rotations for AAPL and WMT on a weekly basis and shows how the heading of the tails started to deviate over the past 6-8 weeks following the change in relative strength for both stocks against the DJ Industrials index as well as against each other.
This regime change has now caused WMT to crossover into the lagging quadrant while AAPL managed to move into the leading quadrant.
A good aide to get a handle of the relative rotation of two stocks against each other is to draw an imaginary vertical line on the RRG chart and detect where both stocks move to the opposite of that vertical line.
For AAPL and WMT that happened between the week-to-week observations of one and two weeks ago which means that the price- and relative-action of two weeks ago caused the relationship to flip over in terms of Jdk RS-ratio.
Walmart Inc. - WMT
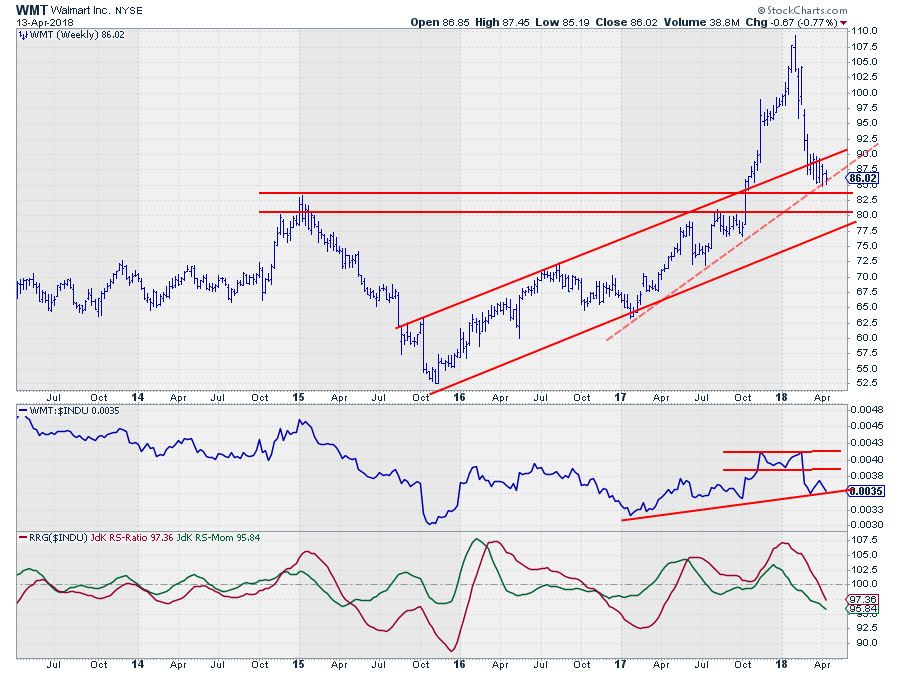 The weekly price chart for WMT shows a strong upward break out of the rising channel in the beginning of October 2017.
The rally that followed pushed the stock price all the way up to almost $ 110. Starting early 2018 WMT started correcting that almost vertical move and fell back to the breakout level and even back between the boundaries of the old channel.This is usually not a very strong sign.
For the moment the dashed rising trend line manages to keep WMT from falling further.
From a relative perspective, there will not be much support to keep WMT at current levels. In the raw RS-Line, a double top has been completed and both RRG-Lines have fallen below 100 and are pushing lower which positions the stock inside the lagging quadrant on the RRG at a negative RRG-heading.
Apple Inc. - AAPL
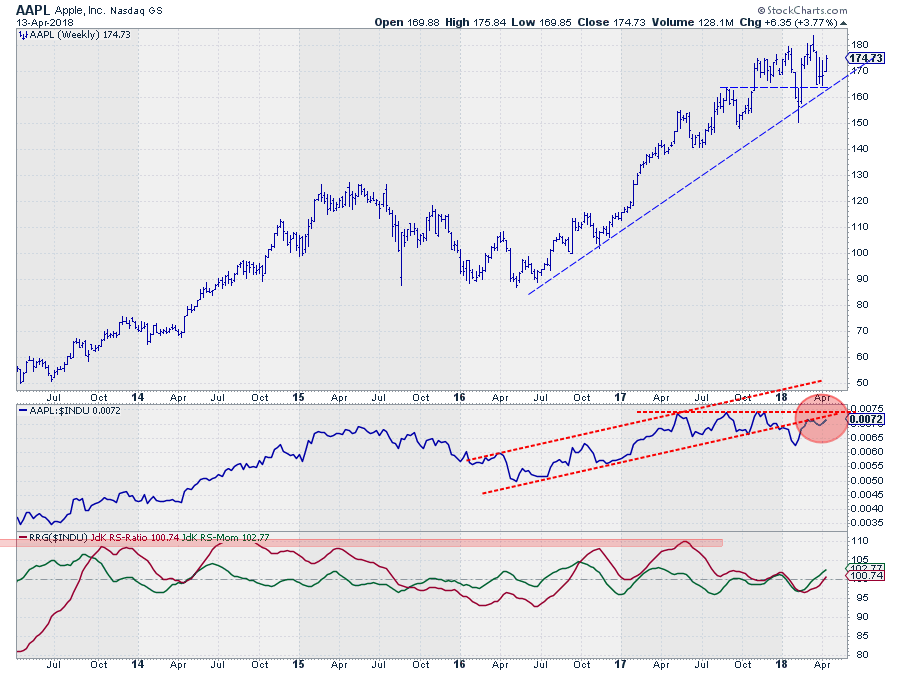 AAPL’s weekly price chart is still holding up well despite a few wide swings.
The recent lows are still all higher than the previous occurrences which is positive. Resistance is found between $ 180 - $ 185
The relative outlook seems to be at crossroads.
The raw RS-Line fell out of a rising channel at the beginning of 2018 suggesting that the uptrend in relative strength had ended. If that is the case then the current relative rally out of the recent low is a recovery back towards the former support line that now acts as resistance and we will see a downturn in relative strength again soon.
However, the RRG-Lines seem to be picking up the beginning of a new uptrend, which will be confirmed when relative strength breaks above it horizontal resistance barrier marked by the three 2017 highs.
With both RRG-Lines breaking back above 100, AAPL rotates into the leading quadrant and the strong RRG-Heading suggests a follow-through in coming weeks.
I am keeping an eye on roughly $ 165 as support for AAPL. A break below that level will very likely put the positive scenario to bed.
Daily rotation
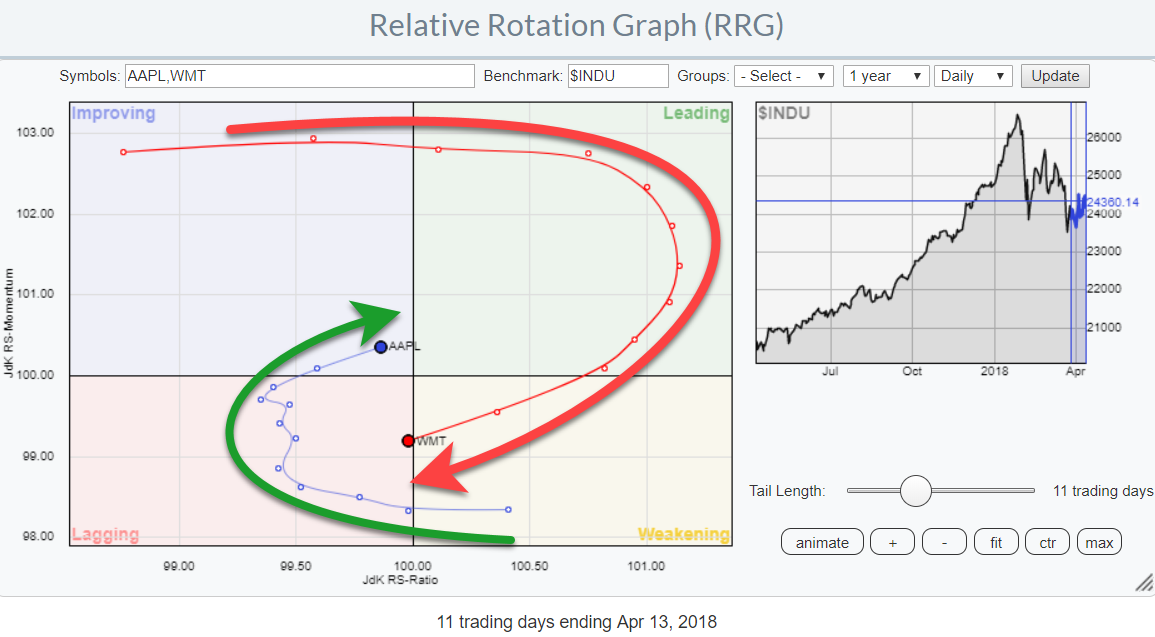 This Relative Rotation Graph shows the zoomed in rotations for AAPL and WMT on a daily basis. What I like is to see that the rotational pattern is similar to that what we see on the weekly RRG.
WMT crossing over into the lagging quadrant at a negative RRG heading and AAPL, almost, crossing over into leading at a positive RRG heading.
This means that the short-term rotations are backing up the longer-term outlook.
Walmart Inc. - WMT
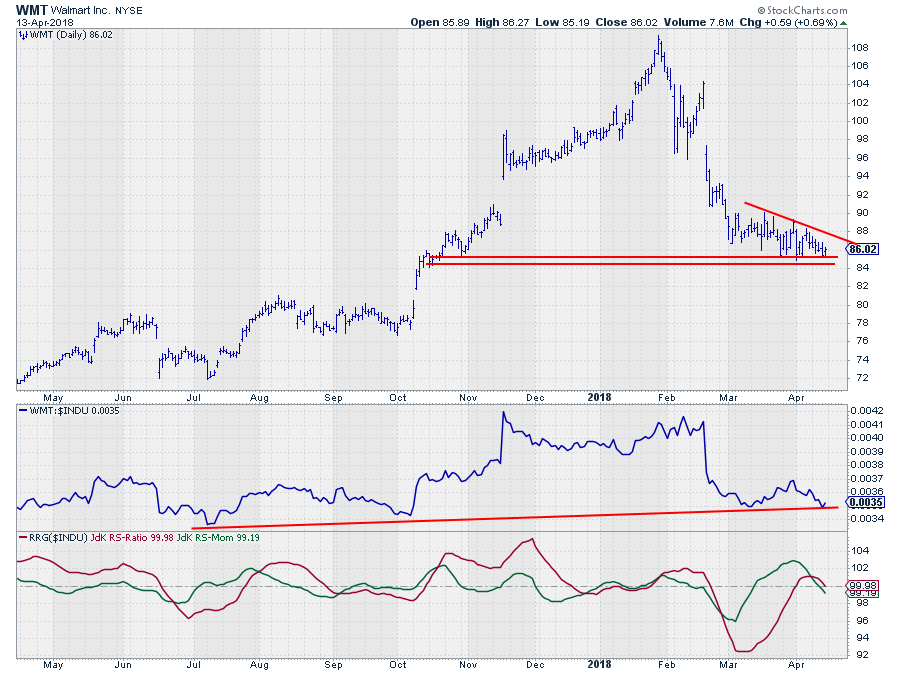 On the daily chart, WMT is resting at support on both the price- and the relative charts.
The area around $ 84 - $ 85 is a clear support level that has been tested a few times in the past weeks. The subsequent lower highs since mid-March suggest that selling pressure is still present. When this continues and WMT breaks support an acceleration in the existing downtrend may be expected.
No doubt that such an acceleration lower in price will also cause relative strength to break below the marginally up-sloping support line as well as its previous relative low.
The RRG-Lines already seems to be anticipating this decline with the JdK RS-Momentum line heading lower and breaking below 100, confirming the peak in the JdK RS-ratio which is on the verge of crossing over.
Assuming a continuation of the current rotation, a further underperformance of WMT vs the DJ Industrials index and AAPL seems imminent.
Apple Inc. - AAPL
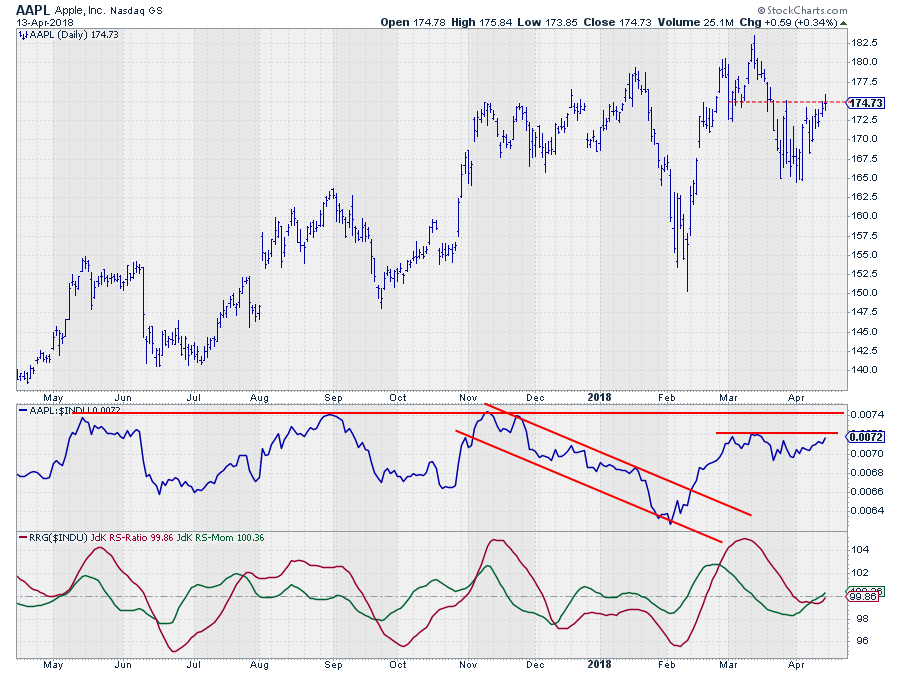 AAPL is struggling with resistance near $175. Once it can clear that barrier a jump towards the previous high around $ 182.50 is likely.
On the daily RS-chart, a clear higher low has been set after the upward break out of the falling channel. What we need here is a break above the recent relative high and the horizontal resistance line, that connects the 2017 peaks, which will confirm that a new relative uptrend is underway on the daily time frame.
Almost certain this will happen in conjunction with the break above $ 175 in price. If not, then bets are off.
Here also the RRG-lines seem to be anticipating such a break as both the RS-Ratio and the RS-Momentum lines are about to cross the 100-level upward causing a positive RRG-heading.
The current position of AAPL is still close to the benchmark on the RRG but the increasing distance between the daily observations on the RRG, especially last Friday, suggests that the stock is starting to move away and push into the leading quadrant.
Let me know what you think of this usage of RRG in the comments? If you want to receive a notification when a new article in the RRG blog is published? Simply "Subscribe" and leave your E-mail address.
Julius de Kempenaer | RRG Research
RRG, Relative Rotation Graphs, JdK RS-Ratio, and JdK RS-Momentum are registered TradeMarks ®; of RRG Research
Follow RRG Research on social media:
If you want to discuss RRG with me on SCAN, please use my handle Julius_RRG so that I will get a notification.
