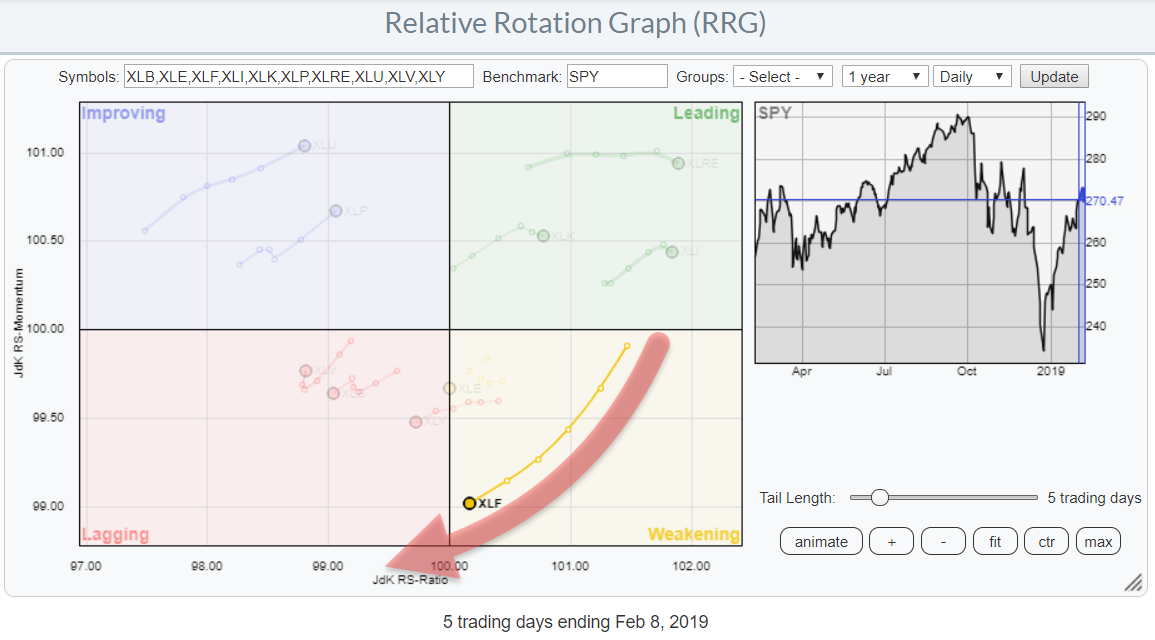
 On the daily Relative Rotation Graph for US sectors, the rotation of Financials stands out. The tail is relatively long, indicating that there is good momentum behind this move,
The bad news is that the rotation is taking place inside the weakening quadrant and has almost reached the lagging quadrant.
Based on the position and the length of the tail on the Relative Rotation Graph a crossover into the lagging quadrant seems only a matter of days.
When this happens, XLF will be inside the lagging quadrant on both the weekly and the daily RRGs as the weekly tail for XLF has just turned back to lagging after a rotation through improving. And both tails are on a negative RRG-Heading (180-270 degrees).
This makes the Financials sector vulnerable to further weakness and underperformance against SPY.
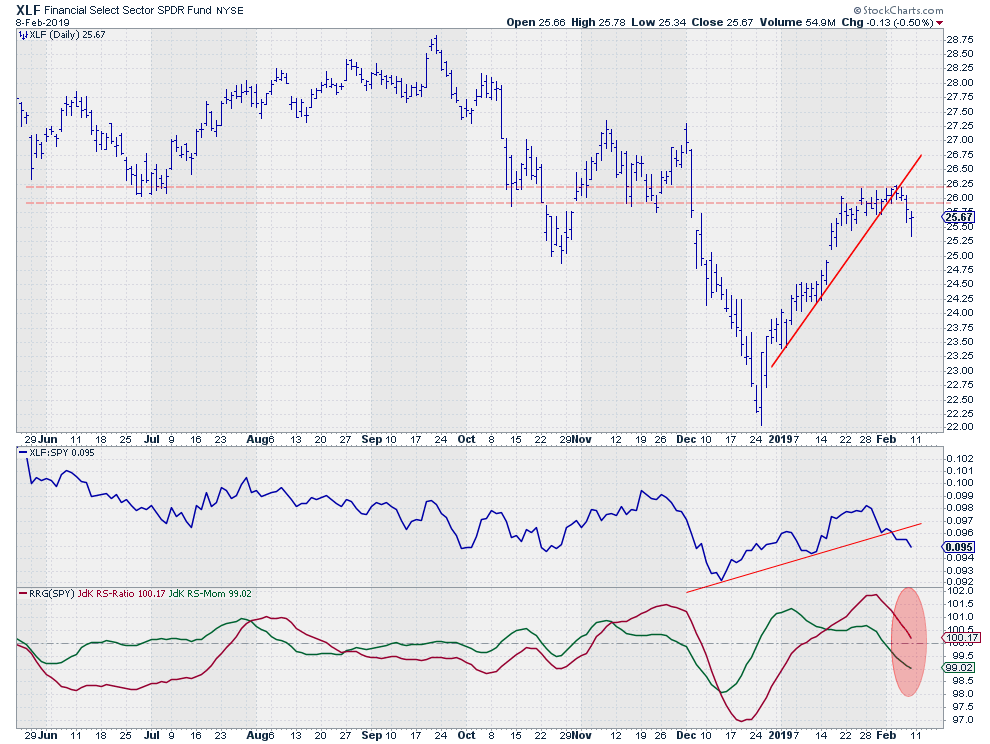 The renewed weakness is clearly visible on the daily price chart in combination with relative strength.
The index peaked in the resistance zone between $ 26-26.25 and broke the steeply rising support line coming out of the December low.
Almost at the same time, the relative strength line against SPY broke below its rising support line. The JdK RS-Momentum line already broke below 100 a few days earlier and is now dragging RS-ratio towards the 100-level and very likely below it.
Let me know what you think of this usage of RRG in the comments below. If you would like to receive a notification when a new RRG blog article is published, simply "Subscribe" with your email address using the form below.
Julius de Kempenaer | RRG Research
RRG, Relative Rotation Graphs, JdK RS-Ratio, and JdK RS-Momentum are registered TradeMarks ®; of RRG Research
Follow RRG Research on social media:
If you want to discuss RRG with me on SCAN, please use my handle Julius_RRG so that I will get a notification.


