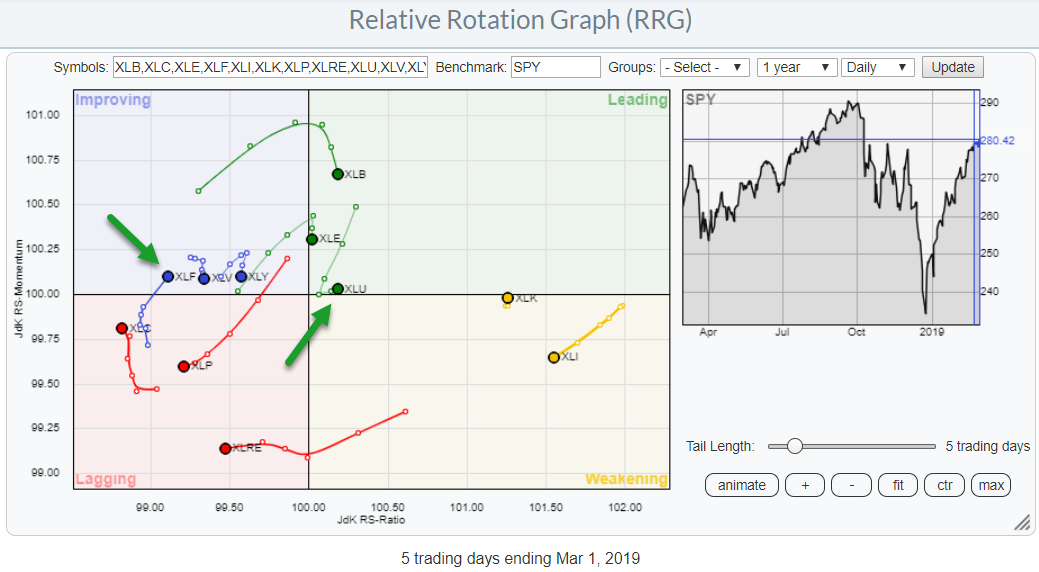
 The daily RRG for US sectors shows a lot of sectors "hooking" lower and only two sectors that are, still, at a positive RRG-Heading, ie rising on both axes.
The chart above is showing a 5-day tail on every sector. if we look at the lengths and trajectories of these tails a few things catch my attention.
The first observation is the ultra-short tail on the Technology sectors. XLK is positioned almost ON the horizontal axis and reading from the color just inside the weakening quadrant and it looks like a single dot.
This means that relative strength is rising gradually at a steady pace (flat momentum) which translates into the chart below. Or better the chart below translates into the current position of XLK on the Relative Rotation Graph.
Technology Select Sector SPDR - XLK
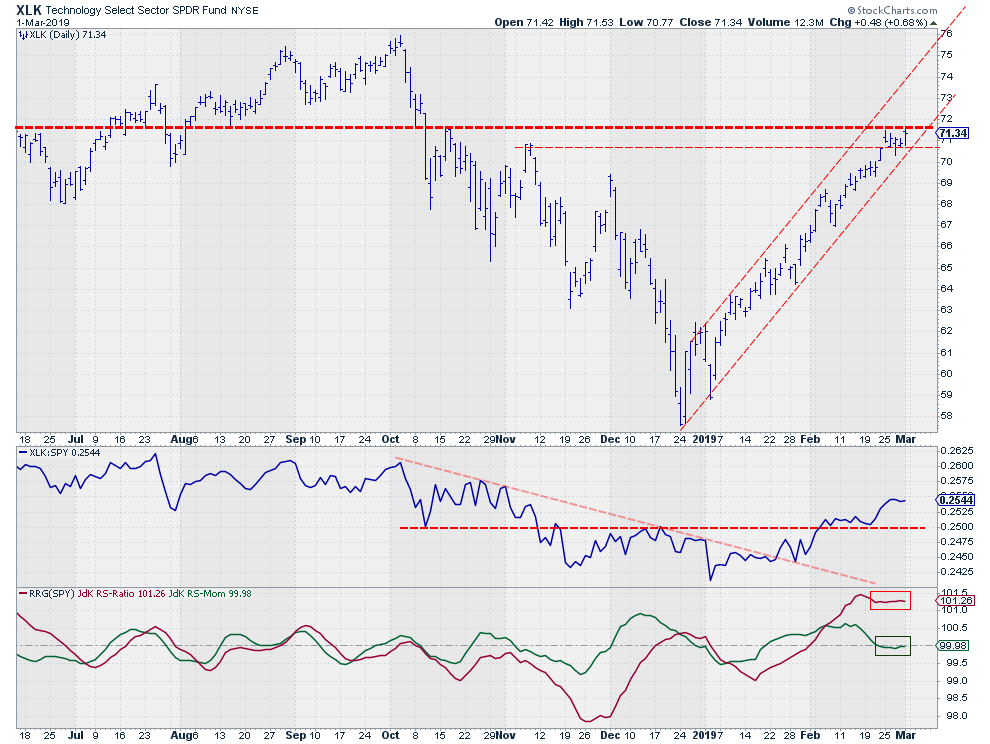 The trend in relative strength is upward and has some room to maneuver without breaking that trend which is consistent with the position of XLK on the weekly RRG (inside improving and pointing towards leading).
For the near term, the overhead resistance on the price chart can keep this sector from rising further. Only when $71.50 can be cleared there will be fresh upward potential. The risk, IMHO, lies in the completion of a small double-top formation that seems to be forming just below resistance. That happens on a downward break of the pivot low at $70 between the two recent peaks.
Sectors "hooking" down
Another observation that can be made on the RRG above is that a number of sectors started to hook down pretty aggressively last week.
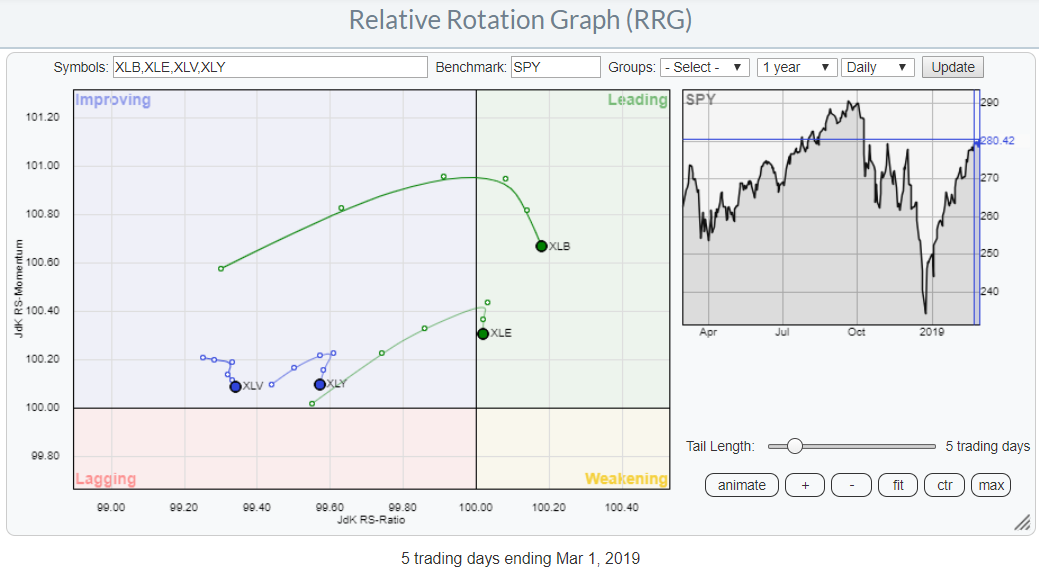 The two most aggressive hooks can be found in XLY and XLE and they deserve our attention this week to monitor the follow through rotation.
XLB is rolling over more gradually and I discussed this sector in depth in my previous post.
XLV is furthest to the left which indicates the most mature relative downtrend among these four sectors, this one seems to continue its relative downtrend that is in effect since the start of December last year and rolling back towards the lagging quadrant on the RRG.
A Positive RRG-Heading
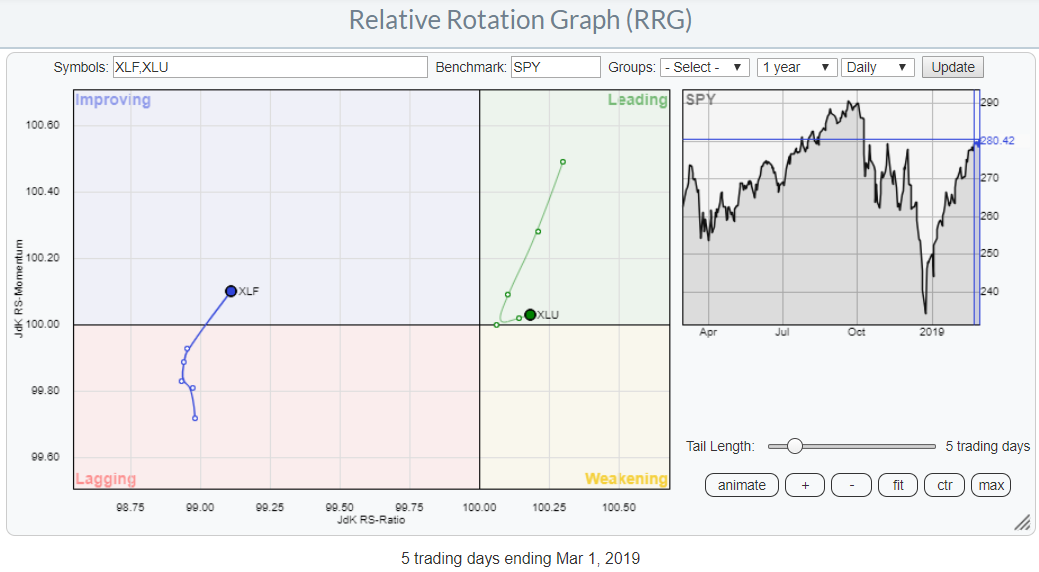 Currently, there are only two sectors that are showing a positive RRG-Heading (0-90 degrees) on the daily Relative Rotation Graph. These are Financials (XLF) and Utilities (XLU).
Financials Select Sector Fund - XLF
Financials is second from the left on the JdK RS-Ratio scale. This makes it the second weakest sector in this daily time-frame at the moment. This also means that a lot of follow-through momentum will be needed to drag the tail all the way through improving and into the leading quadrant and further.
It's not impossible but it's difficult and therefore probably less likely. Especially when I look at the price chart of Financials.
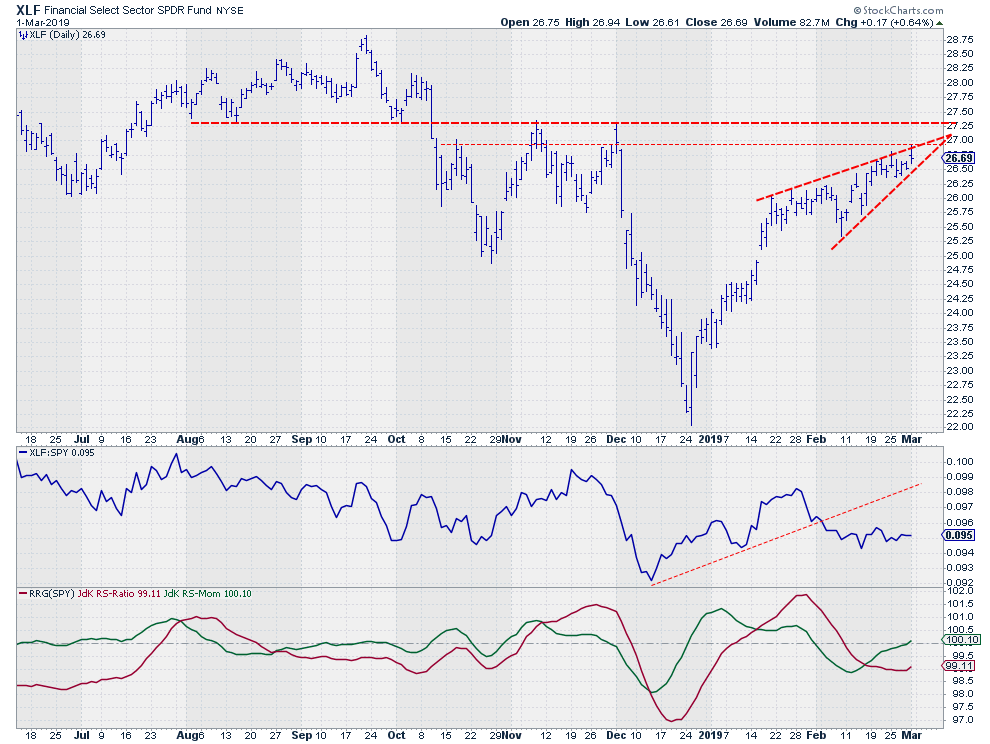
IMHO, that's a proper wedge developing just below an overhead resistance area between $27-$27.25.
That trend-ending formation on the daily chart makes me at least cautious for the ability of XLF to show much more improvement in relative strength.
I'll keep an eye on it but when XLF leaves that wedge to the downside, say < $26.25 to be safe, I expect RS to turn down and make XLF head for the lagging quadrant again.
Utilities Select Sector SPDR Fund - XLU
Unadjusted
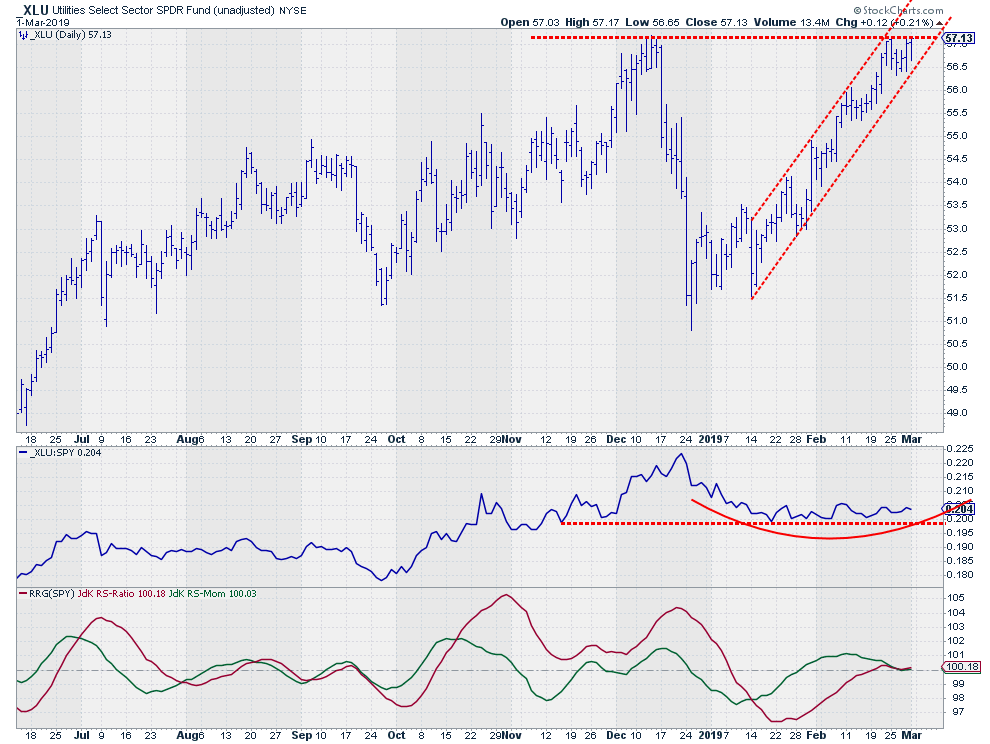 That leaves us with XLU as the only sector INside the leading quadrant AND traveling at a positive RRG-Heading.
I have used the unadjusted chart for XLU as this sector is heavily impacted by dividends which can blur the support and resistance levels based on former peaks and troughs.
What we can see on this chart is that Utilities are pushing against a well defined overhead resistance level coming off the peak that was set in December which happens to coincide with the peak that was set a year earlier (November 2017).
As a matter of fact, the monthly highs for XLU in Nov-17, Dec-18, and Feb-19 are less than 10 Cts. apart ($57.23 - $57.17 - $ 57.15)
On a monthly closing basis, XLU has just pushed to a new high, $57.01 vs $56.60. And yes new (monthly) highs are bullish but I'd like a little bit more confirmation, let's say taking out $57.25 at a monthly close.
Maybe that's what's setting up now for the month of March with relative strength curling upward and the tail on the RRG sharply bending into the 0-90 degree RRG heading again.
We'll have to wait and see how this unfolds but ....
When Utilities break to new (monthly) highs and the market (SPY) does not .... That's something that makes me go ..Hmmmmmmmmm?
If you are in the New York area 10-12 March please stop by and Join me at the TradersEXPO
Let me know what you think of this usage of RRG in the comments below. If you would like to receive a notification when a new RRG blog article is published, simply "Subscribe" with your email address using the form below.
Julius de Kempenaer | RRG Research
RRG, Relative Rotation Graphs, JdK RS-Ratio, and JdK RS-Momentum are registered TradeMarks ®; of RRG Research
Follow RRG Research on social media:
Feedback, comments or questions are welcome at Juliusdk@stockcharts.com. I cannot promise to respond to each and every message but I will certainly read them and where reasonably possible use the feedback and comments or answer questions.
If you want to discuss RRG with me on SCAN, please use my handle Julius_RRG so that I will get a notification.


