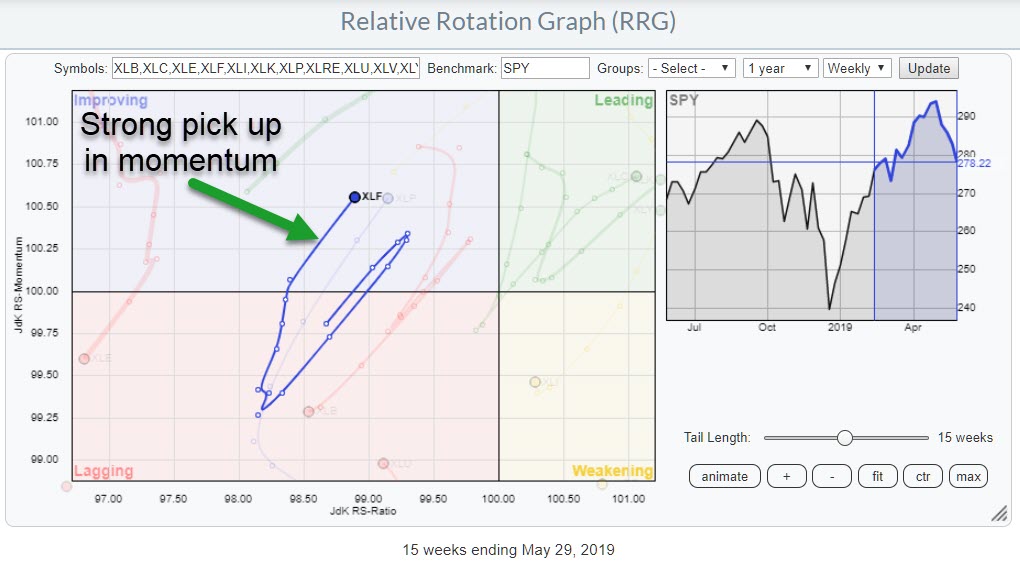
 Looking at the Relative Rotation Graph showing the sectors of the S&P 500, we can see that the tail on the Financials sector stands out, having seen a big increase since last Friday.
Over the last 12-13 weeks, Financials rotated from the lagging into weakening quadrant, then moved sharply back down to lagging and then back up to improving again. The move currently underway from the previous observation (last Friday) on the weekly RRG above is especially interesting to watch, as there is a much longer distance between the two observations than what we have seen recently.
As Financials is an important sector, this sort of moves stirred my interest, leading me to dive a little deeper and find out how the individual stocks in this sector are behaving.
Going Down To The Individual Stock Level
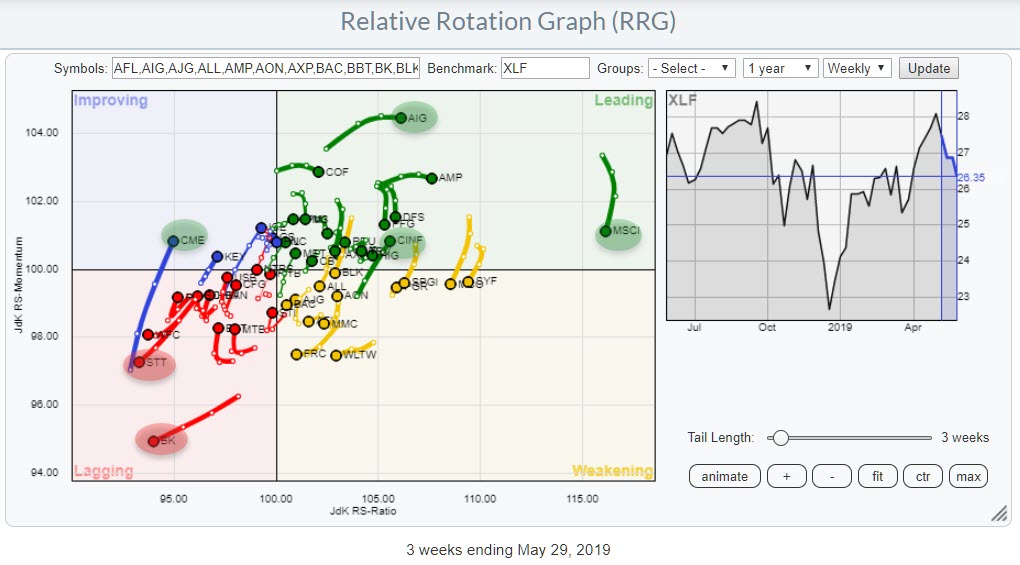 The chart above shows the rotation for the (top 50) financial stocks in the index. A few names that we can spot immediately as interesting and worthy of a closer look have been highlighted. On the negative side, BK and STT are inside the lagging quadrant and rapidly heading lower on both axes. These are worth a closer look, if only to confirm that they are really the weak ones out there and are not close to (or in the process of) turning around on the price chart.
A more positive view pops up for CME, which is currently inside the improving quadrant as it crosses over from lagging into leading at increasing speed. Within the leading quadrant, MSCI definitely needs our attention, as it is the stock with the highest JdK RS-Ratio reading. Even though it has been losing relative momentum over the past few days, MSCI is still the strongest stock in this universe.
AIG is at the highest JdK RS-Momentum reading and continues to travel higher on the RS-Ratio scale, which is positive. Finally, CINF, although somewhat buried away, has just completed a rotation from leading through weakening and has now returned to leading, which usually is a strong sign.
Zooming In
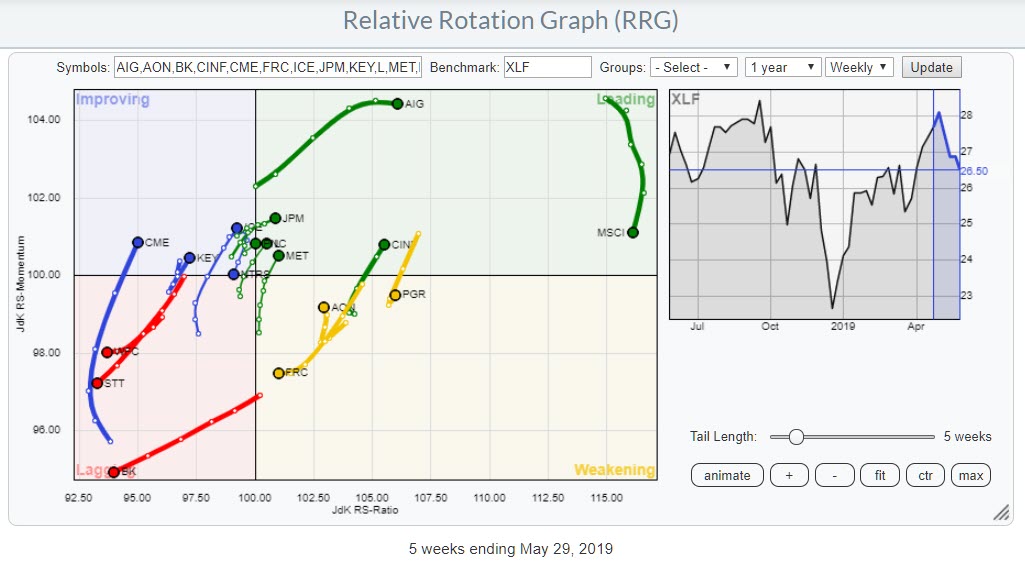 As I browsed through the stocks on this chart*, I isolated a few more tails that could be of interest for further inspection.
* You can "browse" through the various stocks on the canvas by holding down the Ctrl/Cmd key and pressing the up/down arrows on your keyboard. This will select a single line in the table below the RRG and highlight only that tail while the rest is dimmed. That will give you the opportunity to better study the rotation of the individual stocks through the universe.
My routine is then to open the regular chart of the stocks that I am interested in for further inspection in a separate browser window.
It May Be Better To Avoid These
Those of you who have ever heard me speak or read my older blog entries will know that I like to also emphasize the strong UNDERperformers inside a universe. In short, this is because it's usually the real bleeders in a portfolio that drag the overall performance. Focusing on avoiding bleeders, rather than looking for winners or ten-baggers, can help you achieve outperformance.
The ones that I feel should really be avoided within this sector are:
Bank of New York Mellon Corp - BK
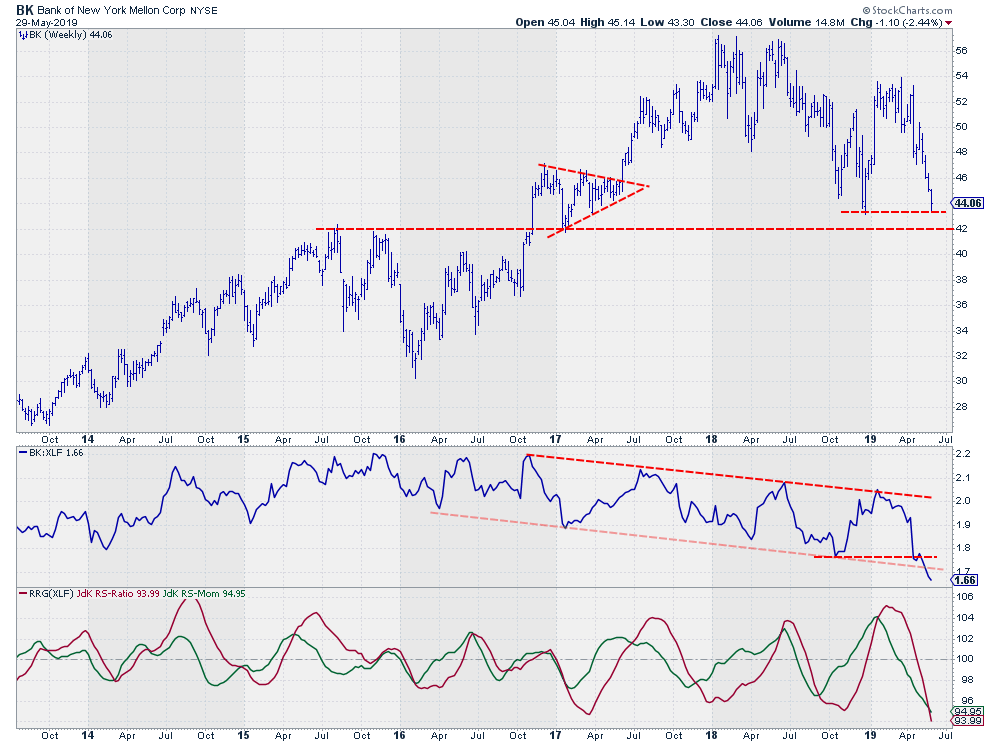 The price chart is resting at support from the previous low, while the next (and more important support level) is only a few dollars lower at $42. Breaks of these levels, especially $42, are expected to trigger more downside price movement.
The relative chart is in bad shape, with a series of lower lows and lower highs ongoing since 2016 and relative strength that just broke below the lower boundary of that falling channel. This is very often an accelerator of the existing trend.
This weakness in the RS-Line translates into both RRG-Lines moving sharply lower, suggesting more relative weakness ahead.
State Street Corp. - STT
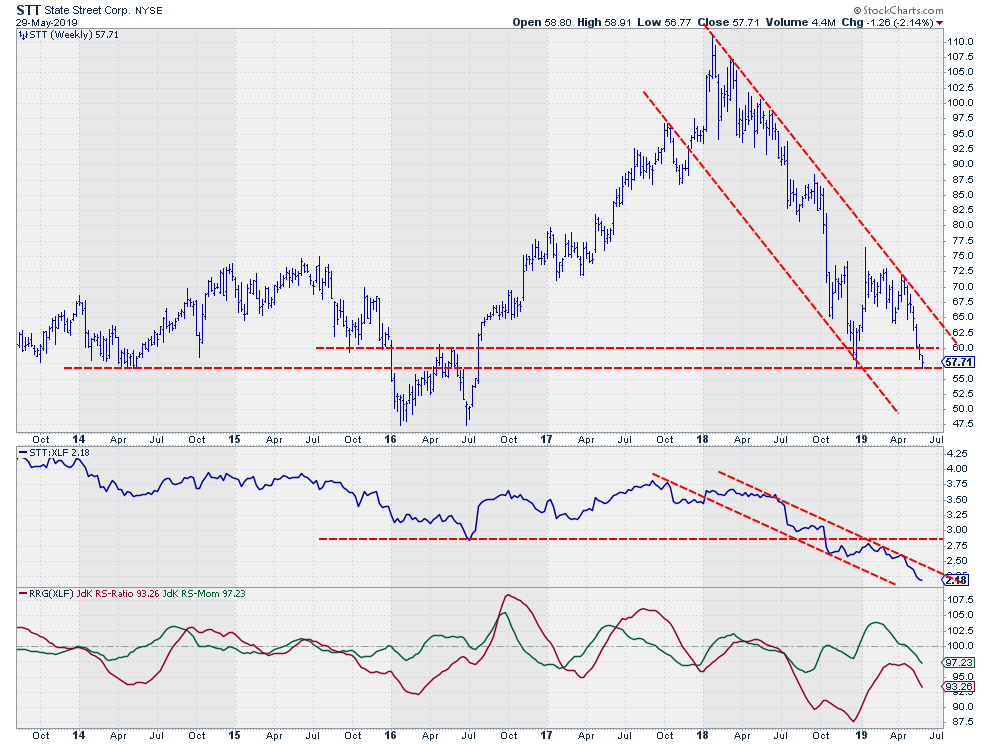 State Street, too, is resting at support provided by its previous low. Here, however, there is no secondary support level nearby. A break below ~$57.50 will very likely ignite a further decline to lows in the area of $47.50, dating back to early 2016.
The relative strength line has been in a clear downtrend since the start of 2018 and is pushing to new lows. The RRG-Lines crossed below a 100 roughly a year ago, pushing STT into the lagging quadrant on the RRG. The recent rally caused a small recovery, but it was not enough to pull STT into the leading quadrant. Instead, the stock rotated through improving before rolling over, ultimately returning to the lagging quadrant, which is where it now continues to lose on both axes.
Wells Fargo & Co. - WFC
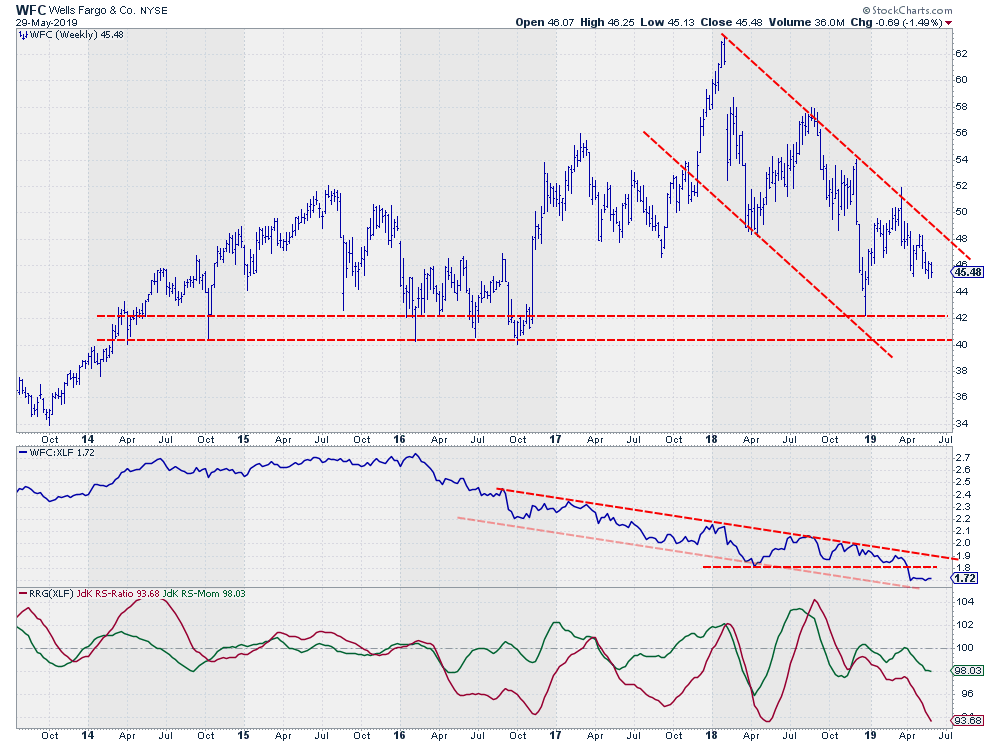 WFC is the third stock on this list. From a price perspective, the trend has been down since early 2018 and the next level of support is found in the area between $40-42.
The relative strength line has just crossed below a horizontal support level and is now continuing lower inside its down-trending channel, which has been in play since mid-2016. No wonder that both RRG-Lines are pushing lower on both axes, causing the rotation on the RRG to continue deeper into lagging quadrant.
All in all, you will very likely outperform the financial sector by simply avoiding these three stocks. BK is around 1.3% in the index, STT 0.7%, and the biggest impact comes from WFC at 6%.
Looking For Upside Potential
On the zoomed-in RRG, I have included a few stocks that are showing strong rotations and may be worth keeping an eye on. These three below, in particular, got my attention as they combine a good relative rotation with a promising price chart.
MSCI Inc. - MSCI
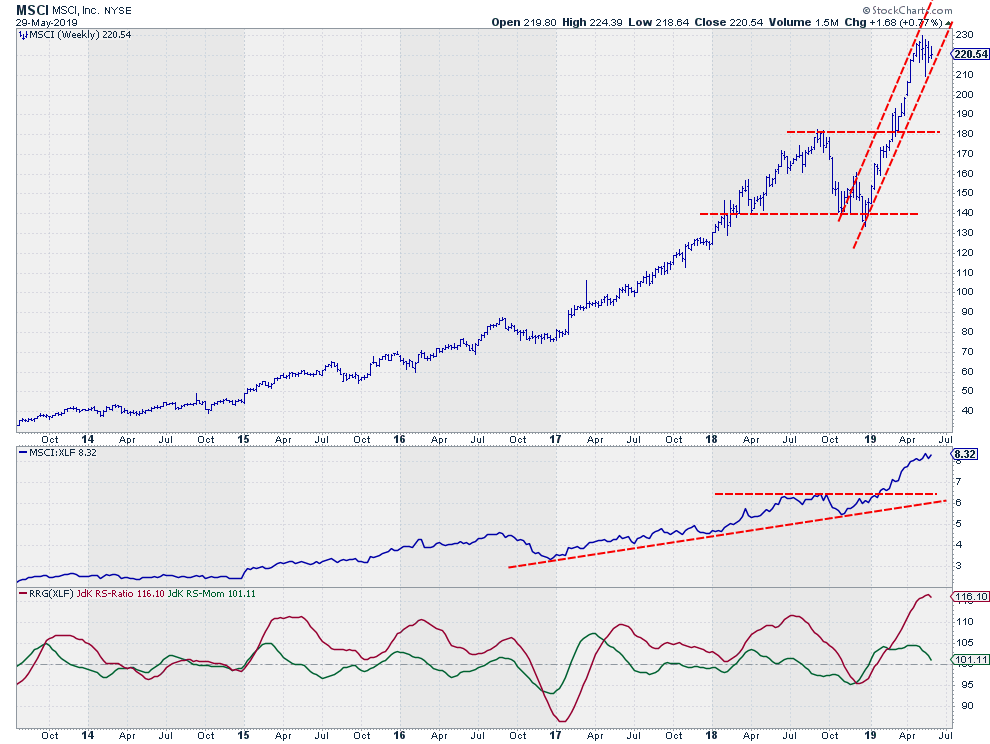 MSCI is the stock that is furthest out on the RRG and inside the leading quadrant. The drawback is that it has started to roll over and come down on the JdK RS-Momentum scale.
This means that the relative trend vs. XLF is well underway and currently going through a pause/setback. Looking at the price- and relative charts above, the stretched values are clearly visible.
On the price chart, the channel is very steep and MSCI has been consolidating between $225-230 for a few weeks now. A downward break will open up the way for the first more serious correction since the start of this move in late 2018.
Relative strength accelerated higher during the same period and is losing upward momentum now, which translates into a JdK RS-Momentum line rolling over and closing in on the 100-level. Given the very high reading of the JdK RS-Ratio line, this can still be seen as a "normal" rotation with the underlying trend intact.
From a timing perspective, it is currently probably best to not chase MSCI but instead wait for the corrective rotation to complete, then go back up again for better entry opportunities. MSCI is still is one of the or "the" strongest stock inside the financial sector from a relative point of view.
Cincinnati Financial Corp - CINF
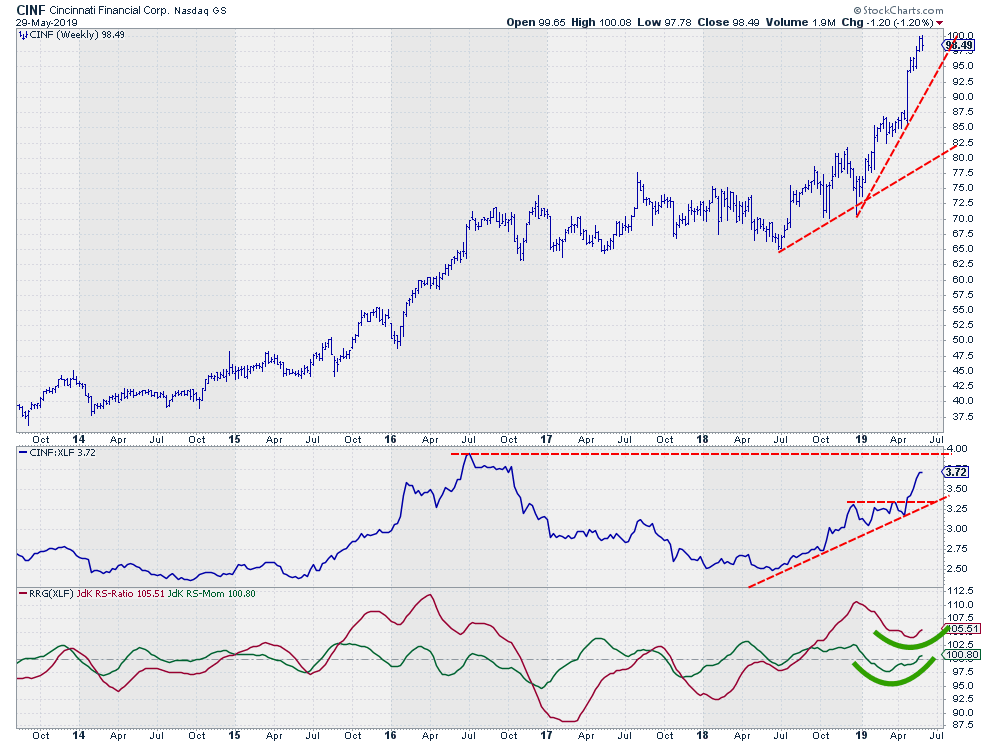 The uptrend in CINF, as seen with the higher highs and higher lows on the price chart, is still well underway on the price chart and, despite the steepness of the rising support line, there is plenty of room for CINF to breathe before breaking support.
The RS-Line topped up the fuel tank when it broke above horizontal resistance a few weeks ago. This upward break is causing the RRG-Lines to curl back up again.
The fact that this is happening with RS-Ratio above 100 and RS-Momentum below 100 means that the upward rotation is taking place inside the weakening quadrant, which usually is a strong sign for future outperformance.
Metlife, Inc - MET
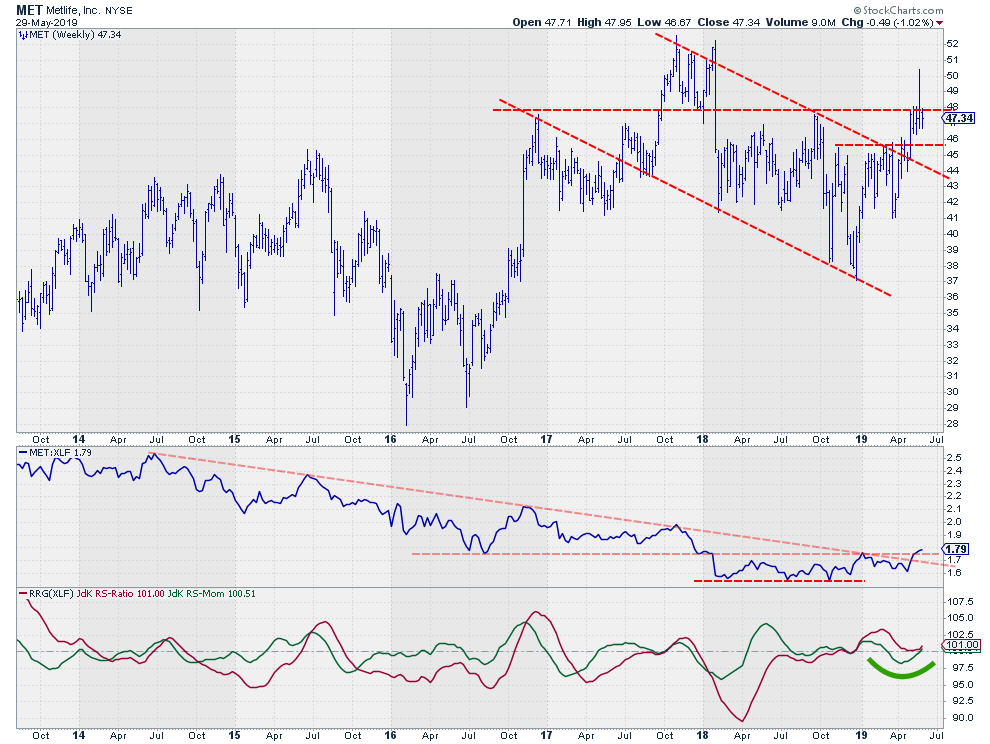 The last stock I want to highlight is Metlife. The price chart is not very "clean," but is characterized by wide swings and long bars. Personally, I always find it hard to put my finger on it and get a proper handle on what's going on. I have tried to annotate the chart with a few trend lines that I feel are important for (future) price development.
My read on this is that the down move ended when the falling resistance was taken out almost at the same time as horizontal resistance (around $45.50) gave way. The next level to watch is $48. The spike above $50 in the week of 20 May did not manage to stay above resistance at the close of the week, so $48 remains in play for now.
A more important and strong(er) signal is coming from the relative strength line, where a five-year downtrend is in the process of turning around. The down-sloping resistance has already been broken and the market is busy doing the same with the horizontal level in relative strength.
This process was picked up by the RRG-Lines at the end of 2018, leading to an initial push into the leading quadrant. After a first setback and a rotation through weakening, MET is now turning back up and starting its second rotation through the leading quadrant.
Let me know what you think of this usage of RRG in the comments below. If you would like to receive a notification when a new RRG Charts blog article is published, simply subscribe with your email address using the form below.
Julius de Kempenaer
Senior Technical Analyst, StockCharts.com
Creator, Relative Rotation Graphs
Founder, RRG Research
Want to stay up to date with the latest market insights from Julius?
– Follow @RRGResearch on Twitter
– Like RRG Research on Facebook
– Follow RRG Research on LinkedIn
– Subscribe to the RRG Charts blog on StockCharts
Feedback, comments or questions are welcome at Juliusdk@stockcharts.com. I cannot promise to respond to each and every message, but I will certainly read them and, where reasonably possible, use the feedback and comments or answer questions.
To discuss RRG with me on S.C.A.N., tag me using the handle Julius_RRG.
RRG, Relative Rotation Graphs, JdK RS-Ratio, and JdK RS-Momentum are registered trademarks of RRG Research.


