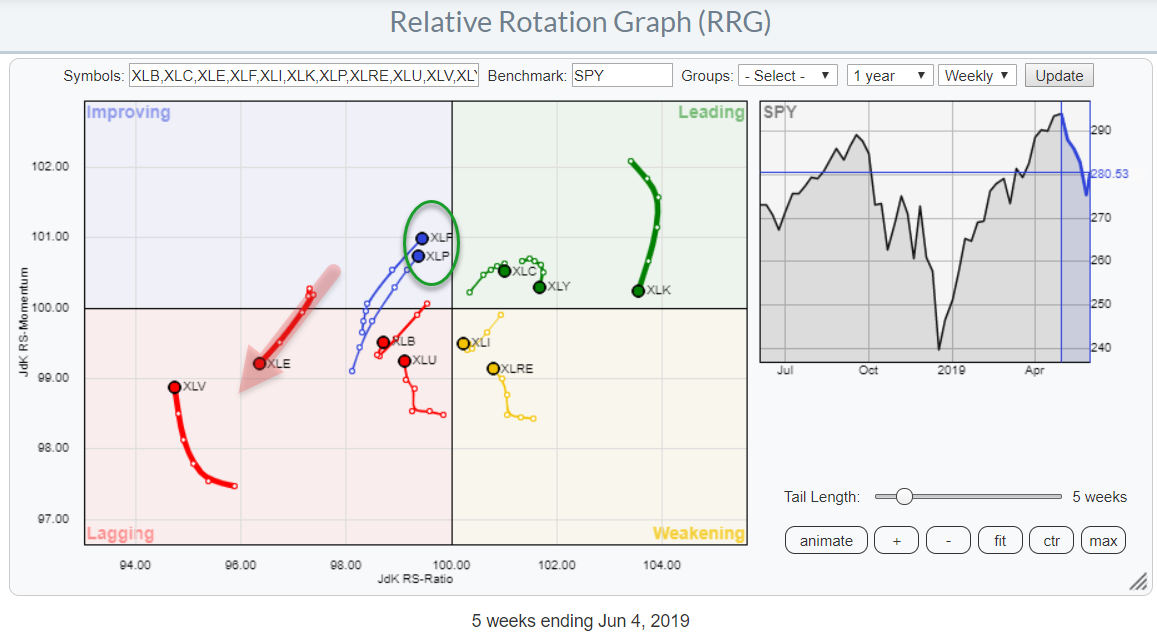
 The chart above shows the relative rotation for US sectors against the benchmark S&P 500. Over the last five weeks, the tails for Consumer Staples (XLP) and Financials (XLF) started to move in a similar fashion. Both are heading towards the leading quadrant.
The Energy sector, on the other hand, rotated back into the lagging quadrant, following almost four months inside improving without being able to make it over to the right-hand side of the RRG.
Energy - XLE
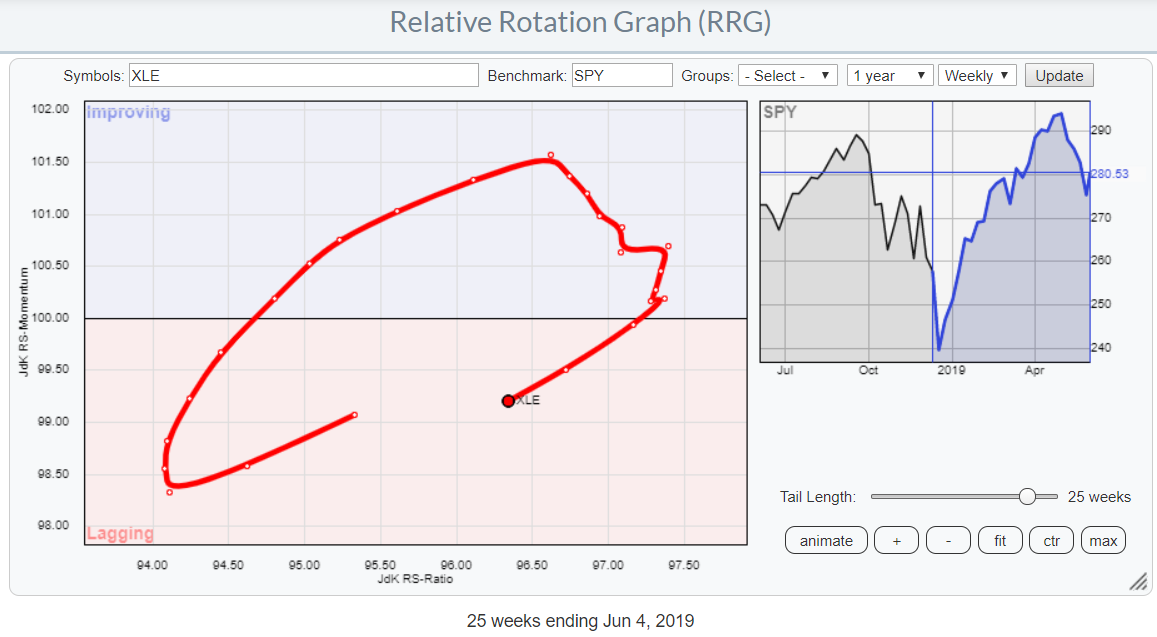 The last 25 weeks of rotation show the Energy sector moving from the lagging quadrant into improving. Energy was at a positive RRG-heading until mid-March, when the tail started to roll over downward at a JdK RS-Ratio level just above 96.50.
In the following weeks, the tail started to lose relative momentum while the week-to-week observations became smaller and smaller. In the week of 24 May, XLE rotated back into the lagging quadrant and started to pick up a downward pace on both axes, pushing the energy sector further into the lagging quadrant.
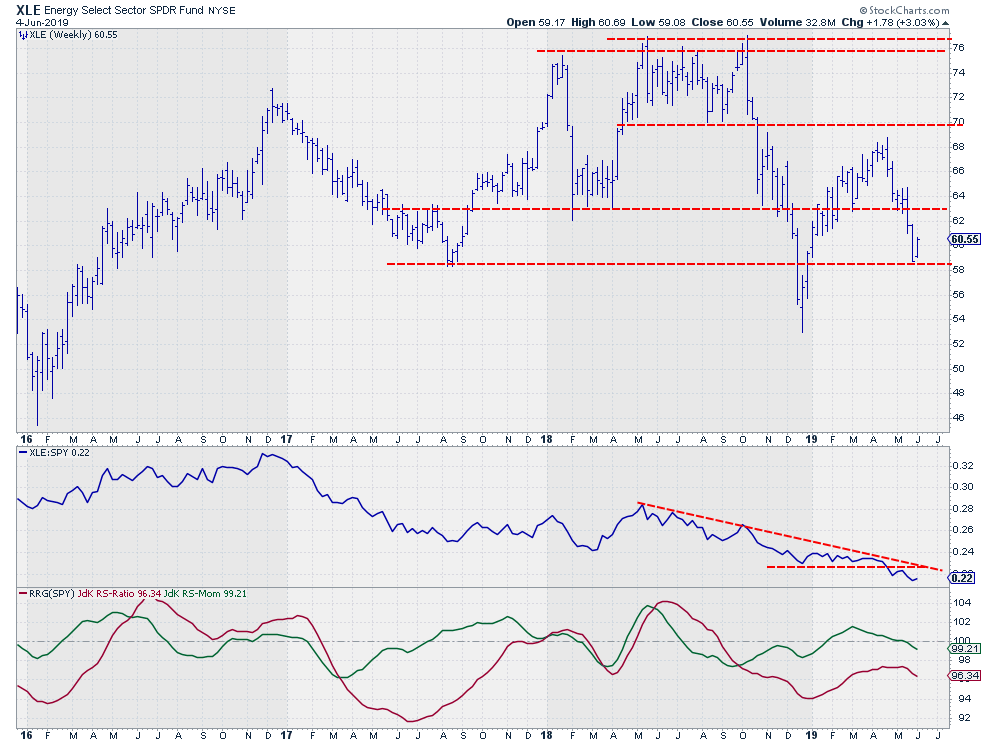 This rotational behavior can be traced back to the downtrend in relative strength that has been visible since mid-2018. The flat period, which started at the end of 2018 and lasted until the break of horizontal support a few weeks ago, was the period when the sector rotated through the improving quadrant.
That break of horizontal support in relative strength was a new signal of weakness and a trigger for the continuation of the existing downtrend.
With both RRG-Lines now back below the 100 level and moving lower, expect XLE to further underperform the S&P 500 index during the coming weeks.
How Did Staples and Financials End Up at the Same Trajectory on RRG?
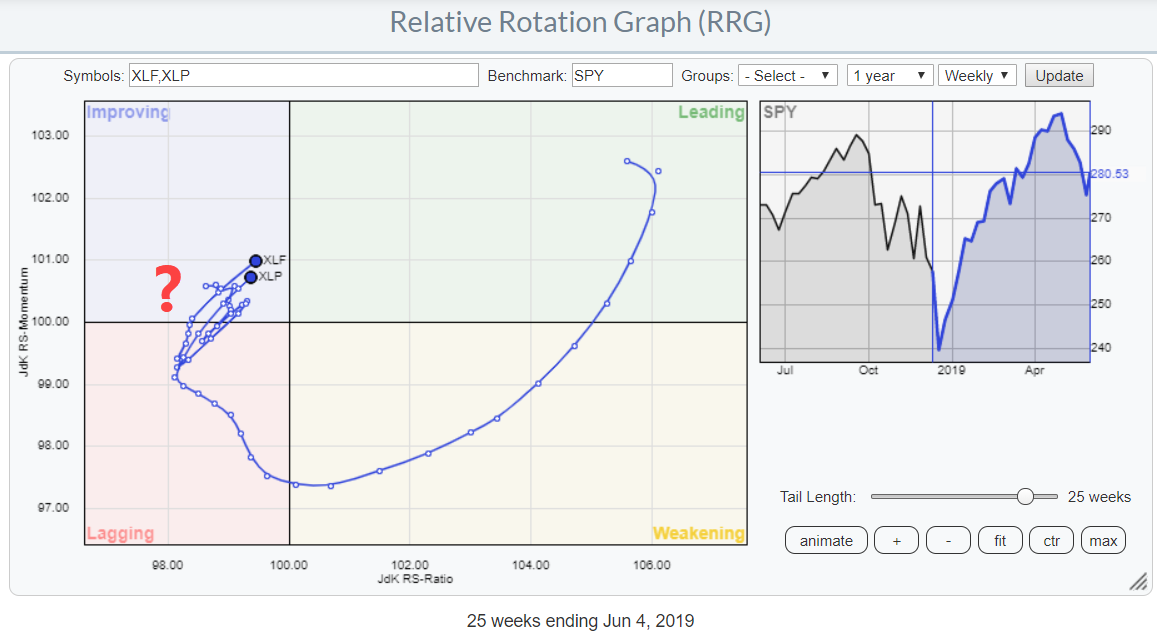 The RRG above isolates the tails of XLF and XLP. As you can see, they are now at almost the same position and heading, with a similar tail for the last five weeks (see RRG at top of article) on the RRG, but how they both got where they are is a completely different story.
Financials - XLF
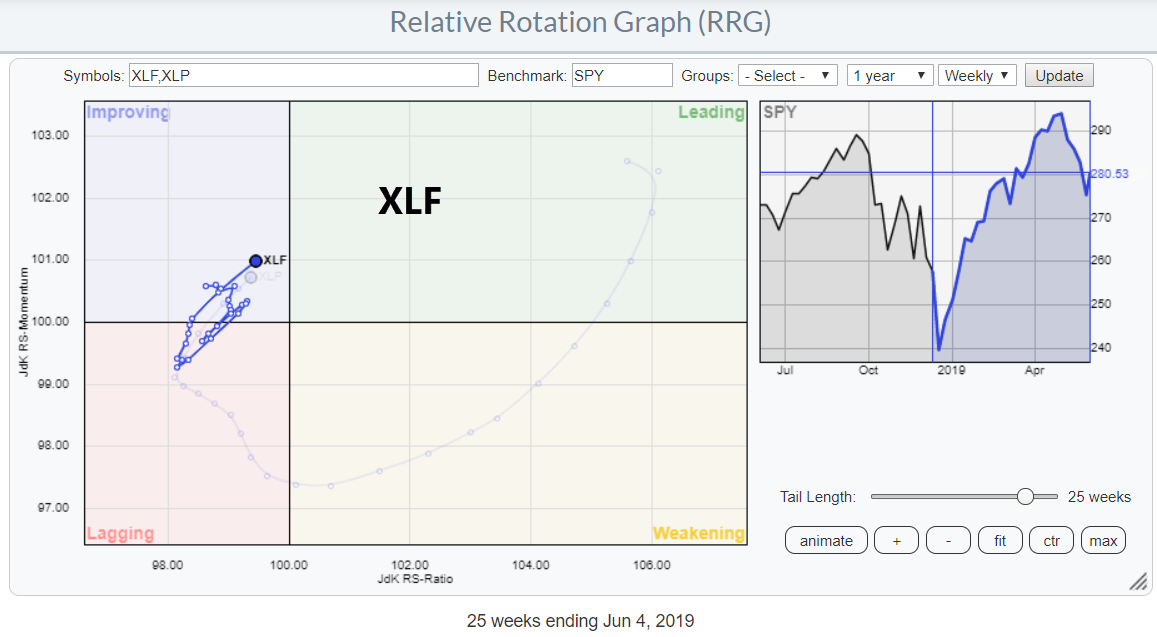 XLF has been rotating in the left-hand side of the RRG since May 2018. We have still yet to reach back above 100 on the RS-Ratio scale.
However, the relative development over the past few weeks looks promising. The very short distances between the week-to-week observations, seen on the majority of the tail above, indicate a stable, albeit weak, relative trend.
The sharp increase in distances (RRG-velocity) indicates that the sector seems to be waking up, at least from a relative point of view. A strong move towards the leading quadrant is now underway.
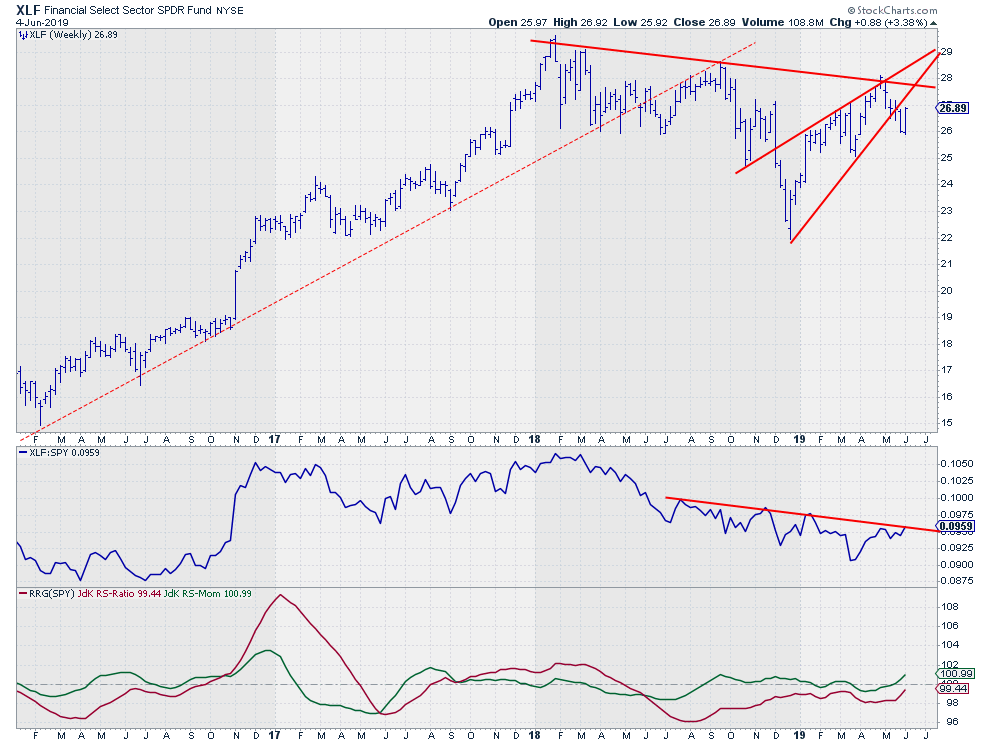 On the price chart, there are still a few hurdles to overcome. Notably, there is the slightly falling overhead resistance that needs to be taken out in order to free up some upward potential in terms of price. In addition, the wedge(-like) pattern that executed two weeks ago is casting a shadow in terms of price.
The relative line paints a slightly different picture. The recent rally took the RS-Line back to its falling resistance and that level is currently being challenged. A break higher will confirm the positive rotation that is now visible on the RRG.
Both RRG-Lines are now moving higher. It now seems only a matter of time before the JdK RS-Ratio will join RS-Momentum above the 100-level, pushing XLF into the leading quadrant.
Consumer Staples - XLP
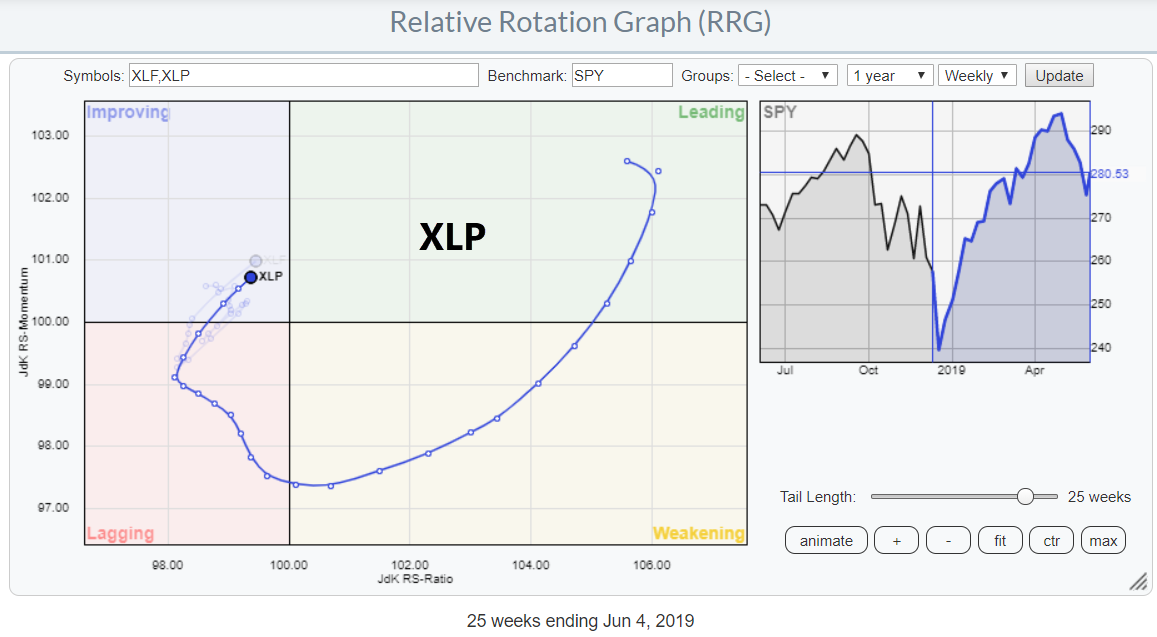 The rotation for XLP is very different from the XLF rotation. XLP shows a wide rotation, traveling from leading to weakening, lagging and into improving, which is where the sector is currently. XLP is positioned fairly close to the center of the chart (S&P 500) but is moving at a strong RRG-Heading and closing in on the leading quadrant.
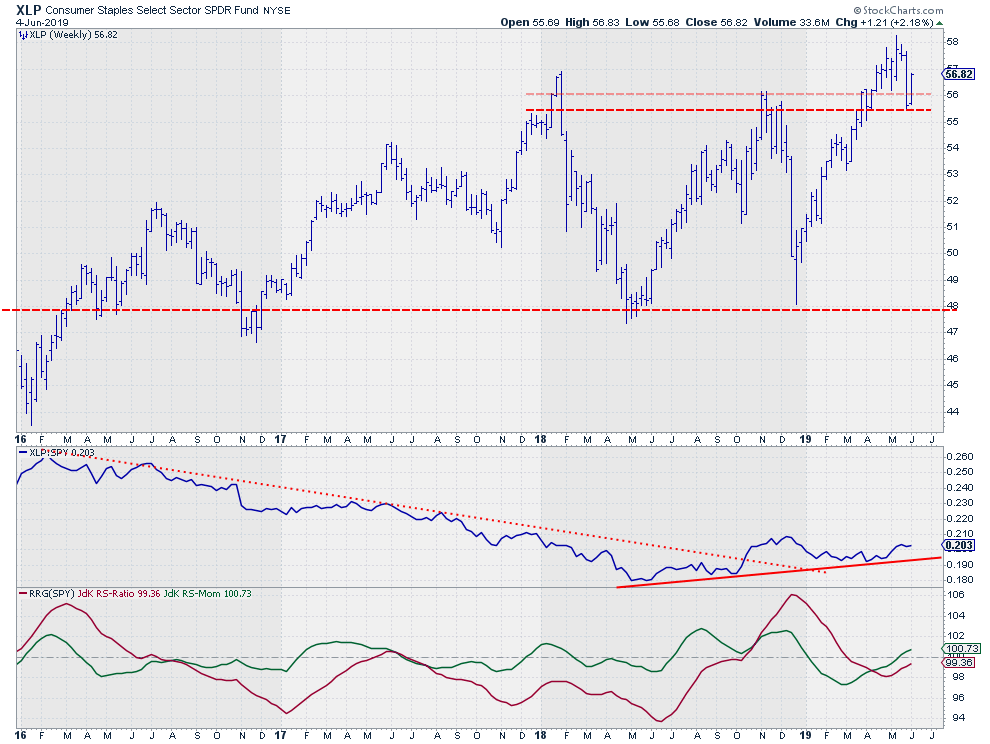 The recent dip, following the break to new highs, marked support at $55.50 for XLP. As the highs in 2018 were not lining up very nicely, it was hard to nail resistance, or now support, to a more specific level, since it proved to be (and this is very often the case) more of a range than a specific level. With the recent drop in price and a clear low at $55.50, support can now be marked more closely to (or at) that level.
This higher low in the price chart that tests former resistance as support is positive for further price development.
In relative terms, XLP is still busy trying to turn around a multi-year downtrend. A first higher low is now visible in the RS-Line and both RRG-Lines are moving higher. When JdK RS-Ratio joins RS-Momentum above 100, the Staples sector will return into the leading quadrant.
That is a positive for XLP, but, as Staples is one of the more notorious "defensive" sectors, it may not be the best news for the S&P 500.
Let me know what you think of this usage of RRG in the comments below. If you would like to receive a notification when a new RRG Charts blog article is published, simply subscribe with your email address using the form below.
Julius de Kempenaer
Senior Technical Analyst, StockCharts.com
Creator, Relative Rotation Graphs
Founder, RRG Research
Want to stay up to date with the latest market insights from Julius?
– Follow @RRGResearch on Twitter
– Like RRG Research on Facebook
– Follow RRG Research on LinkedIn
– Subscribe to the RRG Charts blog on StockCharts
Feedback, comments or questions are welcome at Juliusdk@stockcharts.com. I cannot promise to respond to each and every message, but I will certainly read them and, where reasonably possible, use the feedback and comments or answer questions.
To discuss RRG with me on S.C.A.N., tag me using the handle Julius_RRG.
RRG, Relative Rotation Graphs, JdK RS-Ratio, and JdK RS-Momentum are registered trademarks of RRG Research.
