From time to time, you come across new or different ways to look at things or describe them.
Since the public launch of Relative Rotation Graphs in 2011 on Bloomberg terminals, we have been using the tag-line "RRG provides you with the BIG picture in ONE picture" as a way of emphasizing the key function of RRGs; that is, to condense the complex interaction of many securities against each other in a universe into one picture/chart. At a later stage, someone said RRGs provided situational awareness, an analogy that comes from the military, where it is crucial to know what your position is on the battlefield and where your friends and you adversaries are located, as well as - even more important - how, and in which direction, they are moving.
Overwatch
Recently, I have been watching some military videos and documentaries about tactics in the field and various ways to "solve problems." One thing that got my attention was the common use of "overwatch units." I remember working and training with that doctrine when I was still in the air force, but for some reason it dropped from memory.
However, watching these videos brought it back and I immediately made the connection to Relative Rotation Graphs. These are the perfect tool to conduct overwatch and keep the engaging elements safe from enemy fire, as well as providing them with crucial information about movements of enemy units.
According to Wikipedia:
"Overwatch is a force protection tactic in modern warfare where one small unit or military vehicle supports another while it is executing fire and movement tactics. An overwatching unit takes a position where it can observe the terrain ahead, especially likely enemy positions. This allows it to provide effective covering fire for advancing friendly units. The term "overwatch" was coined in U.S. military doctrine in the 1950s."
Obviously, the unit providing overwatch will position itself as high as possible relative to the units they are covering. They want to keep the big picture in sight. RRG will do exactly that.
The highest possible level on the investment battlefield is asset allocation.
Relative Movement of Asset Classes
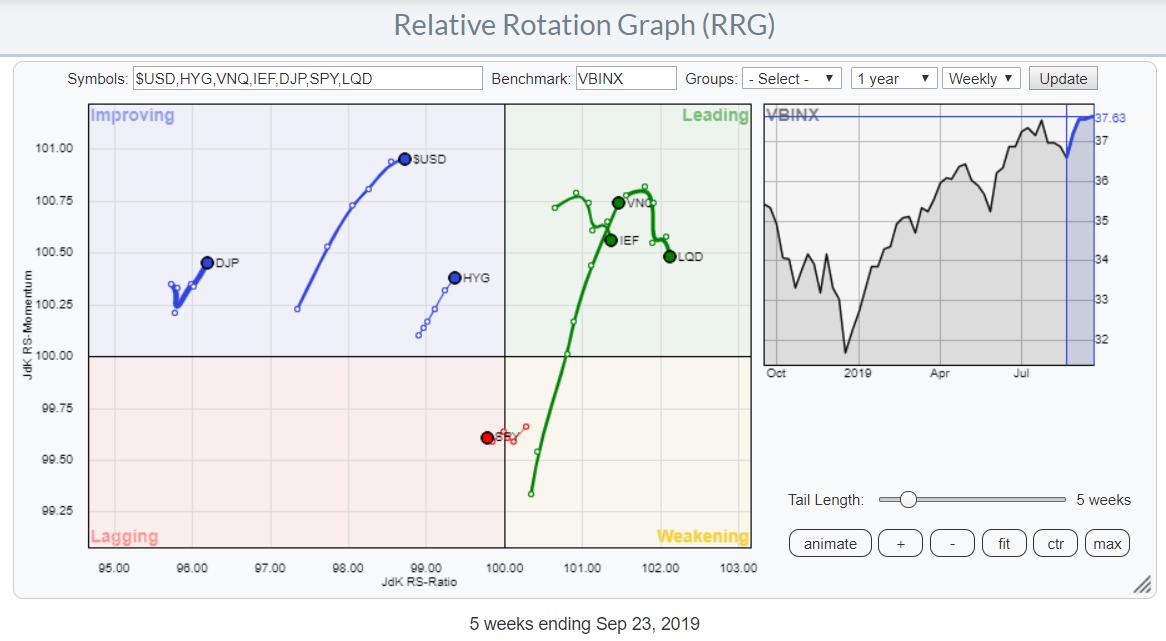
The Relative Rotation Graph at the top of this article is showing the relative movement of various asset classes (ETFs) vs. VBINX, which is an ETF that represents a balanced index fund invested 60% in stocks and 40% in fixed income.
The image shows SPY (stocks) just entering the lagging quadrant from weakening. IEF (Gov Bonds) and LQD (Corp Bonds) are inside the leading quadrant. Looking purely at the position of these asset classes, IEF and LQD are (still) stronger than SPY.
However, IEF and LQD are rolling over inside the leading quadrant, indicating that they are at least going into a corrective phase. Also, the tail on SPY is the shortest of all ETFs on the RRG, which means that it is in a stable position closest to the benchmark as well, with no decisive trend underway.
If you open the live version of the RRG and scroll through recent history, you can see that the downward relative momentum has slowed recently, causing the tail to shorten to what it now is. We all know that a shortening of the tail makes it easier for a security to change direction on the RRG plot.
To get a better handle on this movement, I want to see the behavior on the daily RRG, which is printed below.
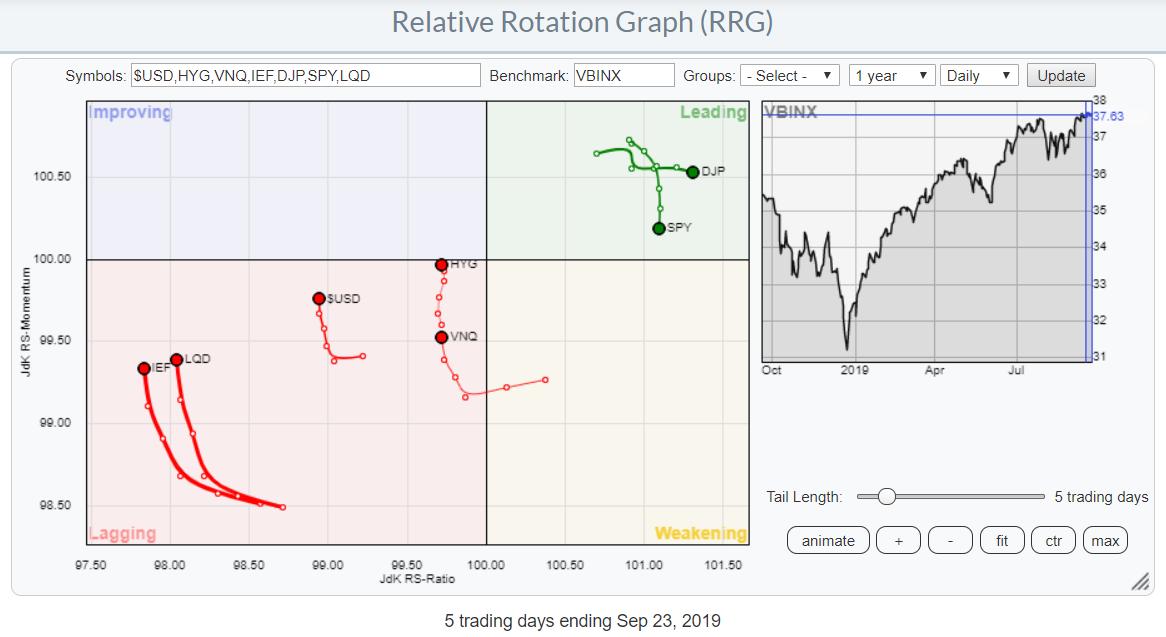
Here, we can see a more-or-less opposite rotation than what we we saw on the weekly image. Here, SPY is inside the leading quadrant but rolling over, while IEF and LQD are inside lagging but curling upward.
Translating Information to a View
These non-confirmations are hard to read, as they are sending opposite signals, but I'll give it a go.
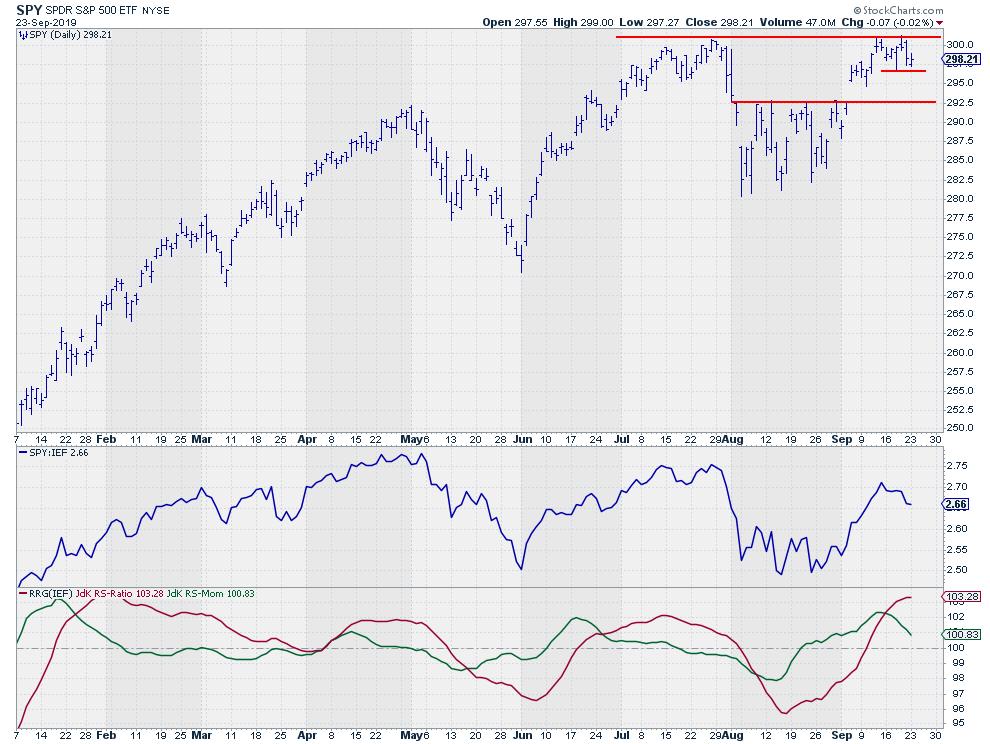
The daily chart above gives a bit more detailed information than the weekly, where we can't see anything beyond that SPY is testing overhead resistance in the area of its all-time highs.
On the daily chart, by contrast, we can see that SPY failed twice in breaking above resistance just above 300 in the last few weeks. It now seems to be setting up a small double-top formation; a break below 296.80 will execute that pattern and likely trigger a decline towards gap support near 292.50.
When I translate this to the current rotation on the RRG, it looks as if the tail has already adjusted to a downward break below that short-term support level, indicating at least some short-term weakness.
The big question that remains: Is the initial improvement that we have seen on the daily RRG is a prelude for a turnaround on the weekly RRG or a hiccup in the further deterioration?
Overwatch is often conducted by a sniper and his spotter; their most important skill is being able to watch and observe, only pulling the trigger when a good shot becomes possible.
For now, I am watching the rotation on RRG as guidance and treating it as short-term weakness, while keeping an eye on a possible upward break in SPY before pulling the trigger.
-Julius
Let me know what you think of this usage of RRG in the comments below. If you would like to receive a notification when a new RRG Charts blog article is published, simply subscribe with your email address using the form below.
Julius de Kempenaer Senior Technical Analyst, StockCharts.com Creator, Relative Rotation Graphs Founder, RRG Research
Want to stay up to date with the latest market insights from Julius?
– Follow @RRGResearch on Twitter – Like RRG Research on Facebook – Follow RRG Research on LinkedIn – Subscribe to the RRG Charts blog on StockCharts
Feedback, comments or questions are welcome at Juliusdk@stockcharts.com. I cannot promise to respond to each and every message, but I will certainly read them and, where reasonably possible, use the feedback and comments or answer questions.
To discuss RRG with me on S.C.A.N., tag me using the handle Julius_RRG.
RRG, Relative Rotation Graphs, JdK RS-Ratio, and JdK RS-Momentum are registered trademarks of RRG Research.
Julius de Kempenaer
Senior Technical Analyst, StockCharts.com
Creator, Relative Rotation Graphs
Founder, RRG Research
Host of: Sector Spotlight
Please find my handles for social media channels under the Bio below.
Feedback, comments or questions are welcome at Juliusdk@stockcharts.com. I cannot promise to respond to each and every message, but I will certainly read them and, where reasonably possible, use the feedback and comments or answer questions.
To discuss RRG with me on S.C.A.N., tag me using the handle Julius_RRG.
RRG, Relative Rotation Graphs, JdK RS-Ratio, and JdK RS-Momentum are registered trademarks of RRG Research.


