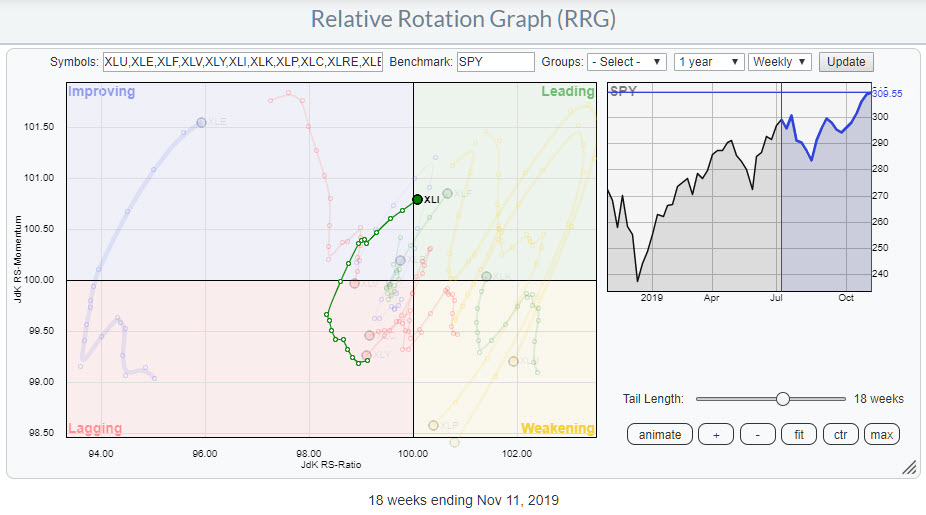
 RRG for US sectors, highlighting XLI
On the Relative Rotation Graph for US sectors, Industrials continue to show a strong rotation. They are now just about to cross over into the lagging quadrant on the weekly timeframe.
I spoke about this strong rotation more in depth in last week's Sector Spotlight show on StockCharts TV. If you missed that show, you can watch the replay here:
Sector Spot Light 11-12-2019
In that episode, I also looked into some single stocks and showed how you can sort the table below the Industries RRG, in order to identify a clustering of strength in an industry within the industrials sector.
This table is printed below. I have added two rectangles around Commercial Vehicles and Diversified Industrials.
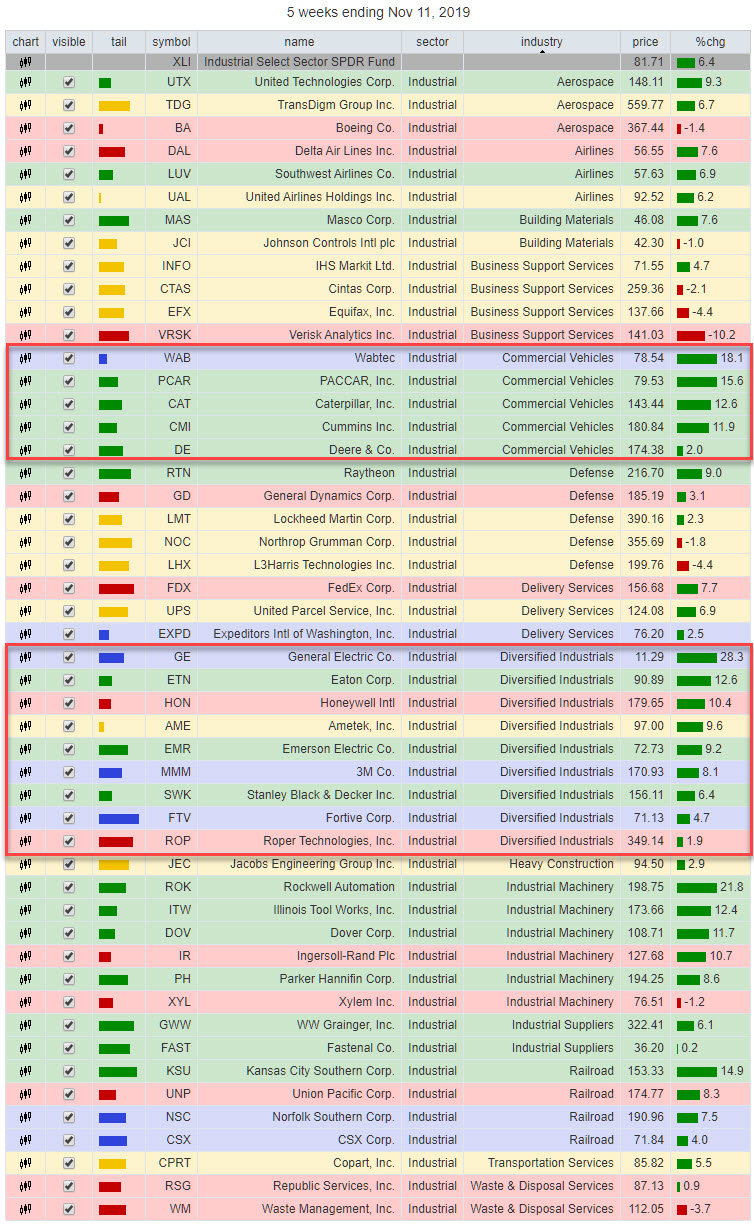
As you can see, the Commercial Vehicles stocks are all inside the leading quadrant except for WAB, which is inside improving.
Diversified Industrials holds a few more names, but is also predominantly inside the green leading quadrant and the blue improving quadrant. All of them are at a positive RRG-Heading. There is one stock, AME, that is inside weakening, but that one is actually on the verge of crossing back into the leading quadrant after curling back up.
Of the two stocks inside lagging, ROP is the one to avoid as it continues to slide lower on both axes. HON picked up a bit of momentum recently, but is now stalling again. Let's just say that there are better names to be found in this industry.
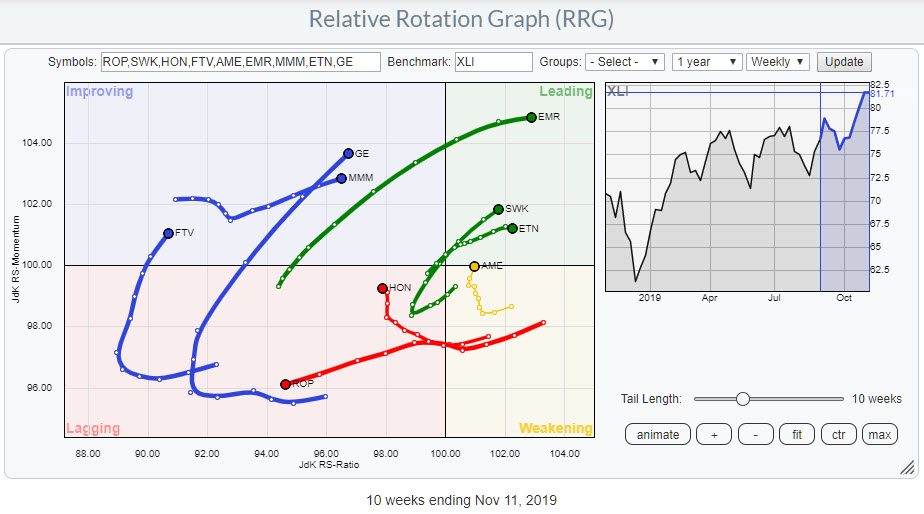 Weekly RRG of Diversified Industrials against XLI
Ametek Inc. - AME
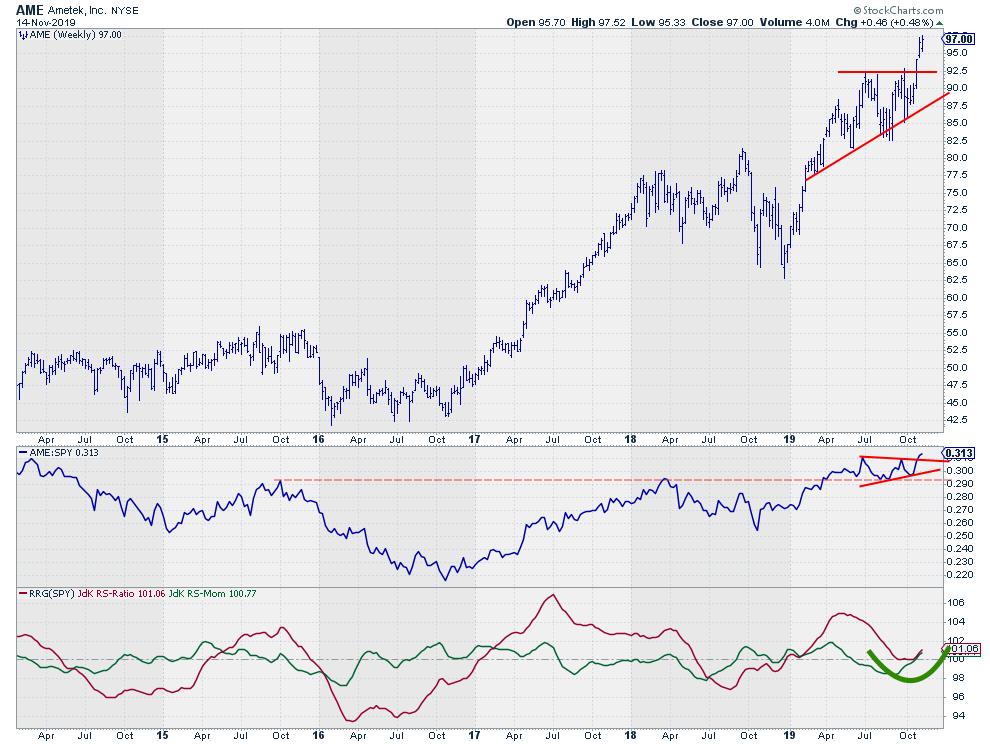 AME - Weekly chart with relative strength and RRG-Lines
One of these names is AME, which has been traveling through the weakening quadrant but recently started to curl up. It is now on the verge of crossing over into leading once again.
Usually, this means a continuation of an already-established relative uptrend.
Inspection of the relative strength line confirms that RS has been rising since late 2018 and spent the last few months in a sideways consolidation. At the moment, RS is breaking away from that consolidation to continue its uptrend.
This relative uptrend is backed by a break in price after breaking above resistance around $92.50. The series of subsequent higher lows that were formed this year and the horizontal barrier that started showing up around July shows the willingness of buyers to come back at higher prices while sellers remained around $92.50.
The supply of stock that created that selling pressure near $92.50 has now been satisfied. With little supply left and buyers still coming back for more, Ametek started to rally higher. Dips back to $92.50, if any, can be seen as new entry opportunities, while the downside is well protected at the former resistance level, which is now acting as support.
General Electric - GE
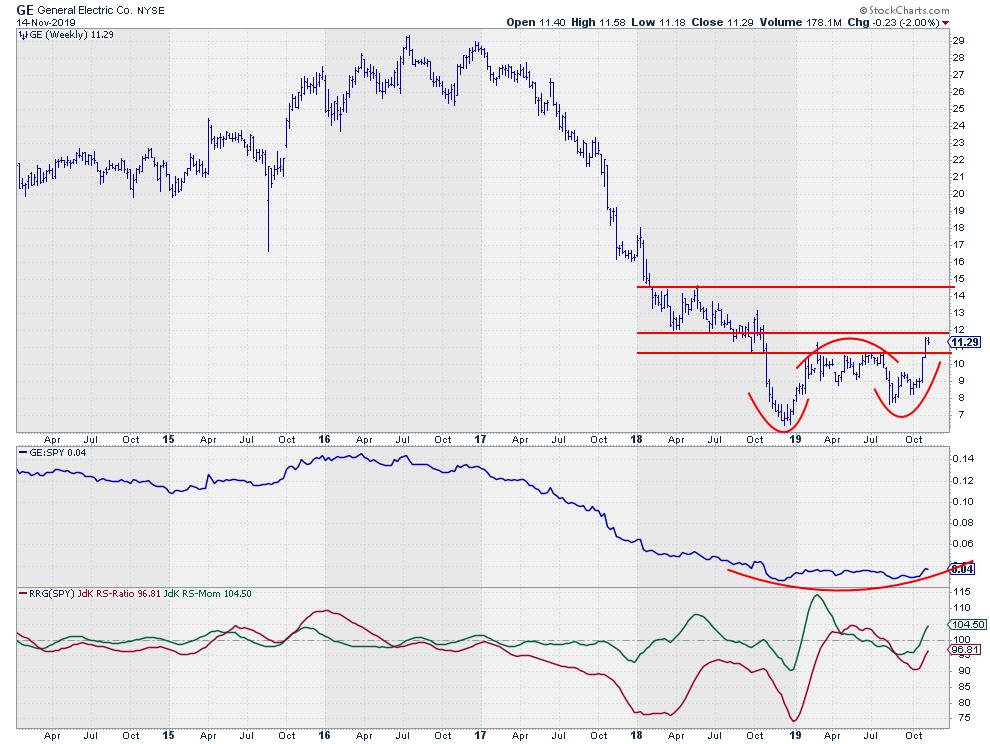 GE - Weekly chart with relative strength and RRG-Lines
Will it really happen this time? Will we finally witness a serious turn around for GE?
I don't know....
What I do see is that the tail of GE on the Relative Rotation Graph is showing a strong rotation over the past ten weeks and is rapidly approaching the leading quadrant.
On the price chart, it seems that GE has been able to break through the first important horizontal barrier, near $10.70. Looking at the curved highs and lows that I have annotated on the chart, this move can be seen as the start of a new series of higher highs and higher lows.
The real test, IMHO, will come around $12.00, the area where GE found support in the first half of 2018 before finally breaking down, crashing to its low at $6.30 in December. Once we can break that, $14.50 should a realistic target level for the subsequent move. Time will tell.
With strong support at $ 10.70, for stops, this could be a good entry level, anticipating a break beyond $12.00.
-Julius
Want to stay up to date with the latest market insights from Julius?
– Follow @RRGResearch on Twitter – Like RRG Research on Facebook – Follow RRG Research on LinkedIn – Subscribe to the RRG Charts blog on StockCharts
Feedback, comments or questions are welcome at Juliusdk@stockcharts.com. I cannot promise to respond to each and every message, but I will certainly read them and, where reasonably possible, use the feedback and comments or answer questions.
To discuss RRG with me on S.C.A.N., tag me using the handle Julius_RRG.
RRG, Relative Rotation Graphs, JdK RS-Ratio, and JdK RS-Momentum are registered trademarks of RRG Research.
Julius de Kempenaer
Senior Technical Analyst, StockCharts.com
Creator, Relative Rotation Graphs
Founder, RRG Research
Host of: Sector Spotlight
Please find my handles for social media channels under the Bio below.
Feedback, comments or questions are welcome at Juliusdk@stockcharts.com. I cannot promise to respond to each and every message, but I will certainly read them and, where reasonably possible, use the feedback and comments or answer questions.
To discuss RRG with me on S.C.A.N., tag me using the handle Julius_RRG.
RRG, Relative Rotation Graphs, JdK RS-Ratio, and JdK RS-Momentum are registered trademarks of RRG Research.


