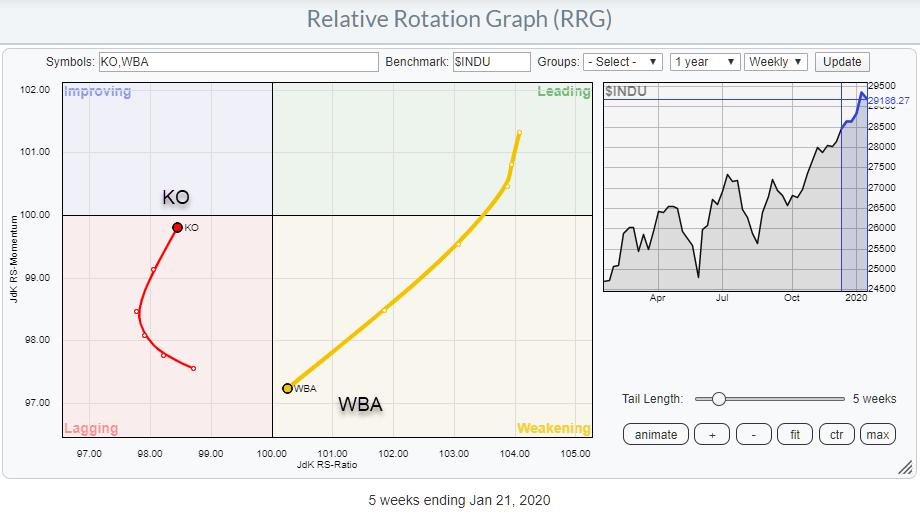
 Weekly RRG showing rotation for KO and WBA against $INDU
In this week's episode of Sector Spotlight, I ran out of time to go over the pair trade idea that we usually have at the end of the show and I promised to write it up in an article. So here it is.
This idea was generated from the Relative Rotation Graph for the Dow 30 components. I noticed a very long tail on WBA, which is still inside the weakening quadrant but rapidly moving towards lagging, while, on the other side of the graph, we find KO moving in the opposite direction and on track to cross WBA on the JdK RS-Ratio axis.
When looking for pair trading opportunities, the 100-level is less relevant as we are only interested in the difference between the two securities and not so much on how they are behaving against the benchmark. For the analysis of the individual legs of a trade, the comparison against the index/benchmark can certainly add value.
Coca Cola Co. - KO
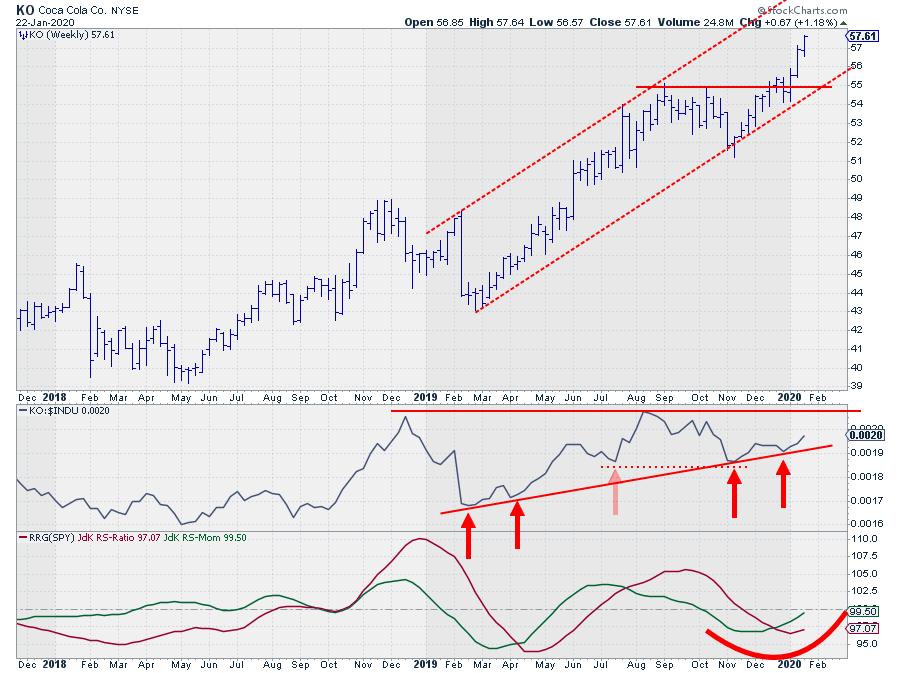
The chart of Coca-Cola above still shows a nice uptrend, one that is working its way higher within a defined channel.
The relative strength line vs SPY has just bounced off a rising support line; that line is becoming more reliable and an important level to watch, with four touch-points now in place. The RRG-Lines dipped below 100, positioning KO inside the lagging quadrant towards the end of 2019, but the recent price action and relative support holding up are now causing them to curl back up.
Assuming that price and relative strength will maintain their current strength, the entering of the improving quadrant seems only a matter of time for KO, with a potential follow-through rotation into the leading quadrant thereafter.
Walgreens Boots Alliance, Inc. - WBA
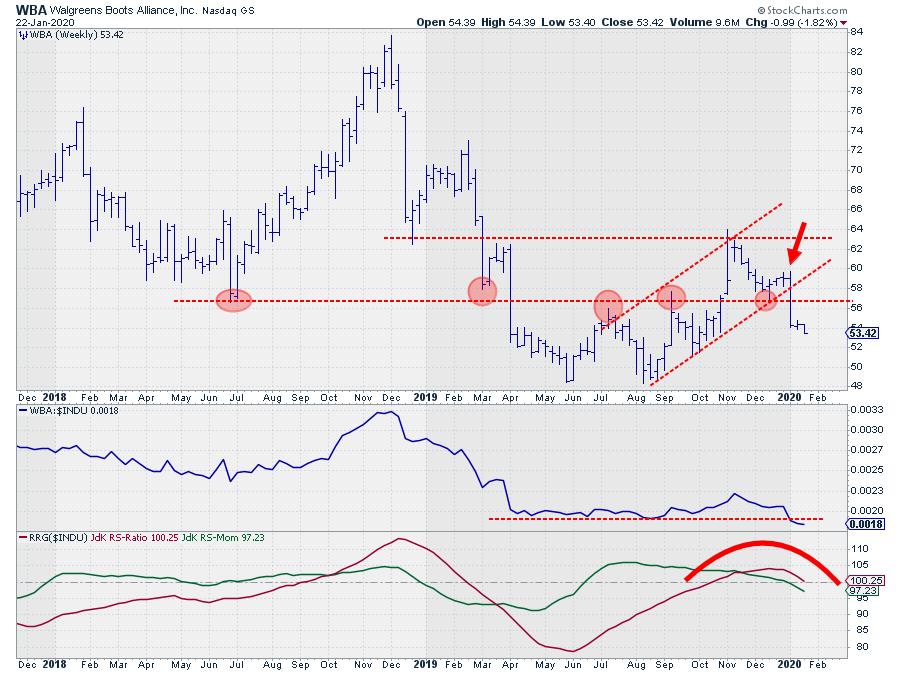
A different picture shows up for the chart of WBA. In November, the stock managed to break above a horizontal barrier that had already been playing a role since mid-2018, but the rally, although impressive initially, did not last very long (one week) and only got WBA to its next intermediate resistance level coming off the late 2018 low and the March/April high in 2019.
Three weeks ago, after setting a first lower high, WBA dropped back below that important horizontal level near 56 and now seems to be continuing its way lower.
On the relative strength front, things do not look much better. The recent decline in price has pushed the RS-line below important horizontal support that was in play for almost a year. The RRG-Lines managed to get WBA inside the leading quadrant only for a few weeks and are now about to push the stock into lagging.
KO vs. WBA
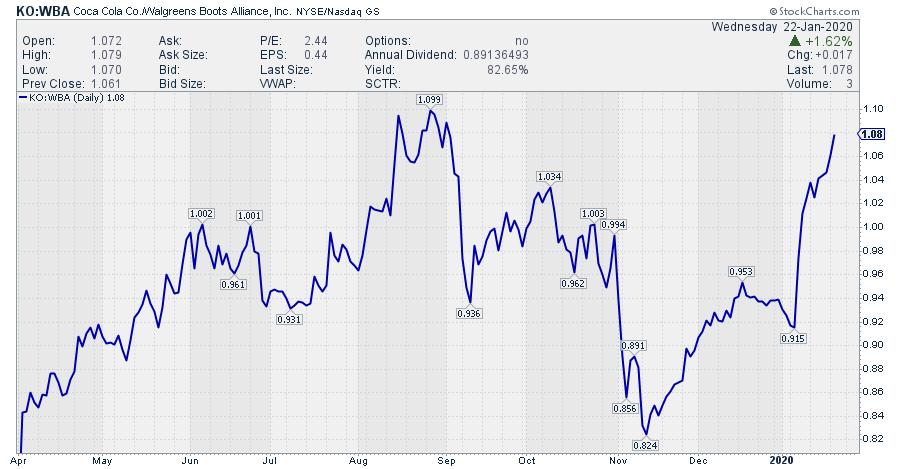
The RS-Line for KO vs. WBA is nearing its August 2019 highs. A break of this level will definitely add some fuel, but the trend is up for sure. To get a better perspective on what could happen from a historical perspective, we need to switch to the monthly ratio chart, as shown below.
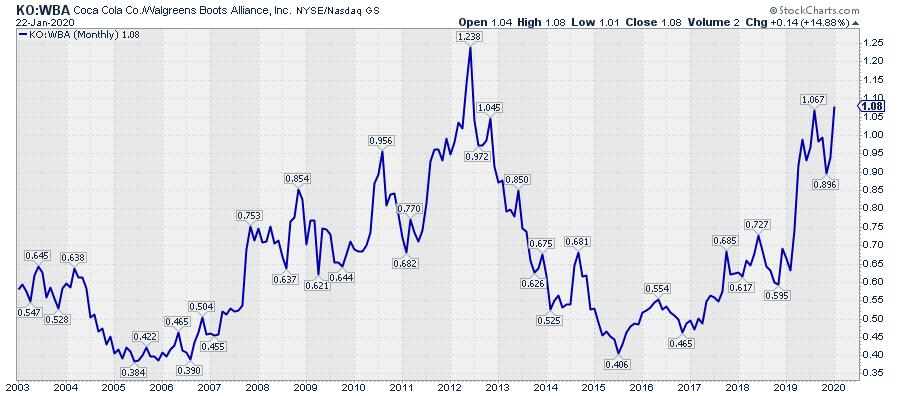
Here, we can see that the all-time-high for KO vs. WBA was set in 2012 and that that level is still seriously higher than where we are right now.
-- Julius
Julius de Kempenaer
Senior Technical Analyst, StockCharts.com
Creator, Relative Rotation Graphs
Founder, RRG Research
Want to stay up to date with the latest market insights from Julius?
– Follow @RRGResearch on Twitter
– Like RRG Research on Facebook
– Follow RRG Research on LinkedIn
– Subscribe to the RRG Charts blog on StockCharts
Feedback, comments or questions are welcome at Juliusdk@stockcharts.com. I cannot promise to respond to each and every message, but I will certainly read them and, where reasonably possible, use the feedback and comments or answer questions.
To discuss RRG with me on S.C.A.N., tag me using the handle Julius_RRG.
RRG, Relative Rotation Graphs, JdK RS-Ratio, and JdK RS-Momentum are registered trademarks of RRG Research.
Julius de Kempenaer
Senior Technical Analyst, StockCharts.com
Creator, Relative Rotation Graphs
Founder, RRG Research
Host of: Sector Spotlight
Please find my handles for social media channels under the Bio below.
Feedback, comments or questions are welcome at Juliusdk@stockcharts.com. I cannot promise to respond to each and every message, but I will certainly read them and, where reasonably possible, use the feedback and comments or answer questions.
To discuss RRG with me on S.C.A.N., tag me using the handle Julius_RRG.
RRG, Relative Rotation Graphs, JdK RS-Ratio, and JdK RS-Momentum are registered trademarks of RRG Research.


