
Since November, I've had a recurring segment in each episode of Sector Spotlight on Pair Trading Ideas. Every show, I try to come up with a pair trade idea using Relative Rotation Graphs on various universes and on various timeframes.
These ideas were, and still are, practical examples on how Relative Rotation Graphs can be used in real life with real-life examples. And although we are not - explicitly not - in the advisory business, we are all interested in how well our ideas or views are, or have been, working.
So far, I launched an idea almost every week, but the follow-up has been sloppy (sorry) and I am intending to improve on that omission. In this article, I will go over all the ideas launched since November and do a short post-trade analysis.
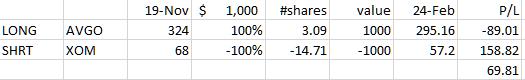
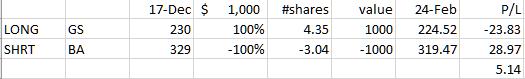
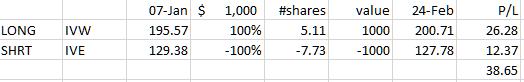
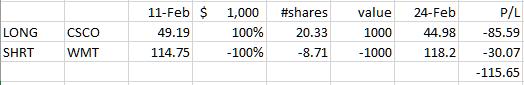
I have been keeping a record for myself of the entry prices for both legs of the trade and am calculating results using a simulated $1000 position for each leg, doing so by simply dividing 1000 by the entry price. This means that there will be fractions of shares in a position which, in reality, is (of course) not possible.
The result will be a U$ amount based on that simulated $1000-a-leg position. How that works out percentage-wise in a real-life portfolio depends on the total size of the portfolio, margin requirements set by the broker, etc. But it should give a good idea on how good or bad an idea worked out over time.
19 November 2019 - AVGO vs XOM
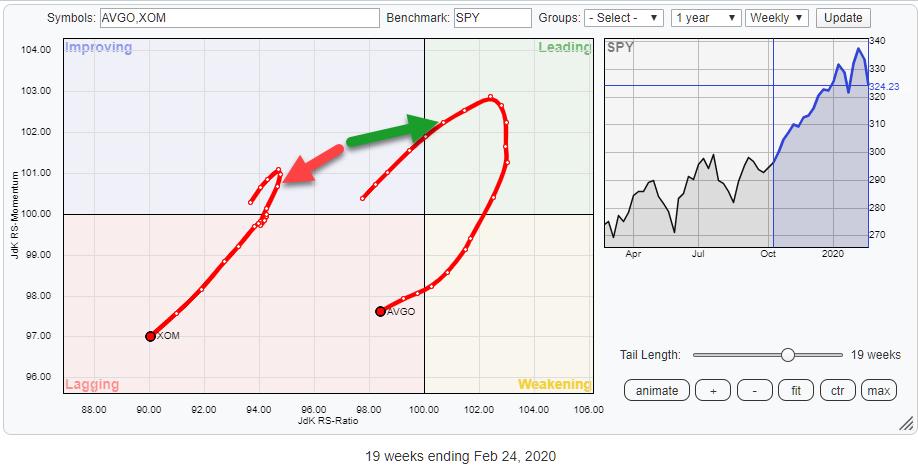
This trade was looking to catch a strong stock in a strong sector (Technology) against a weak stock in a weak sector (Energy). At the time, AVGO had just entered the leading quadrant at strong RRG-Heading while XOM had just turned around inside the improving quadrant.
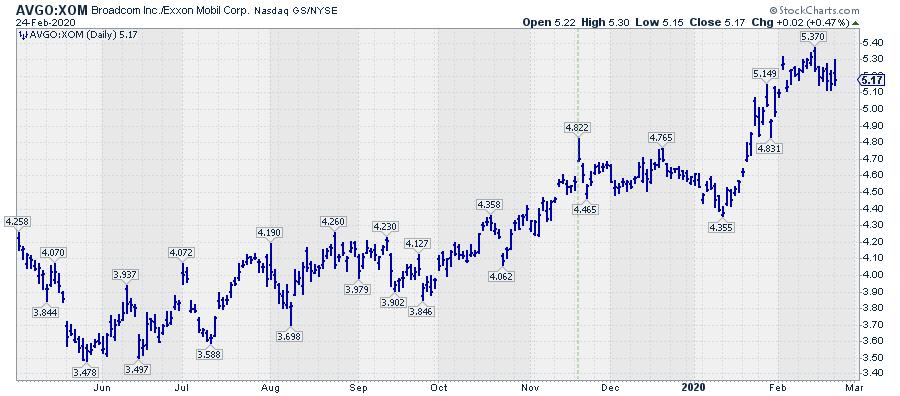 The ratio chart, which is essentially the P/L of this trade, shows how this developed after entry on 19 November.
To start with, I managed to pick the highest level of that ratio for the day, the week, the month and even the year, so it was a great start... ahummm ;)
The trade did not start working until well into 2020, and there have a been a couple of moments where this trade could have (maybe even should have) been closed at a small loss or breakeven. So the fact that it came back to life includes a bit of luck, I have to admit.
Looking at the current situation, this trade is now mainly alive because of the weakness in XOM, not because of the strength in AVGO. With the ratio line having set a new high and rotations on the daily RRG now going in favor of XOM vs. AVGO, it's time to say goodbye at a small profit.
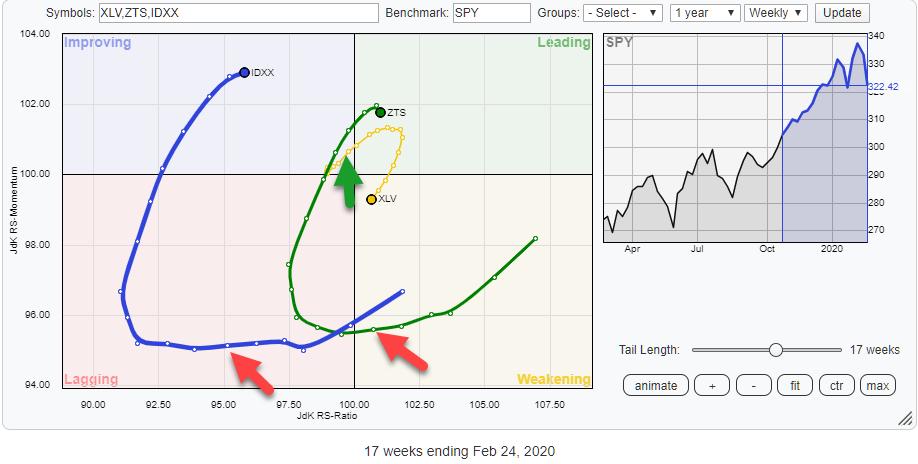
25-November 2019 - XLV vs. XLB
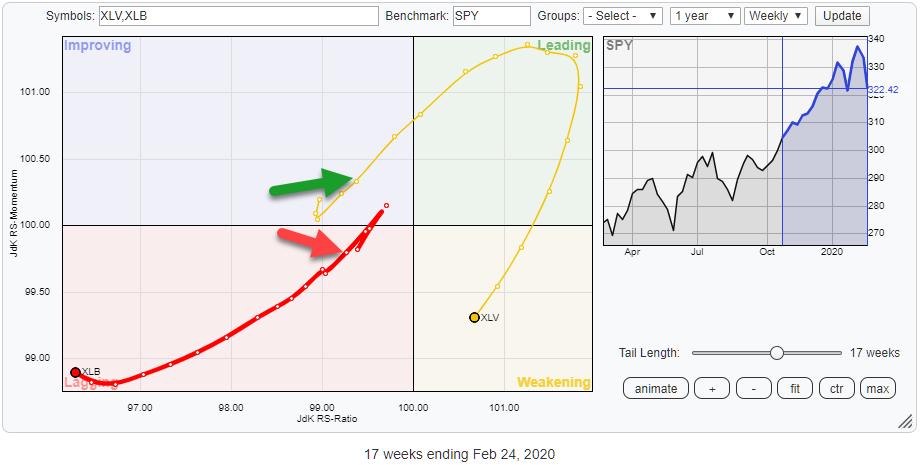
This trade idea was meant to materialize on the opposite rotations for the Healthcare vs. the Materials sector. The RRG shows the entry points on the tails on 25 November.
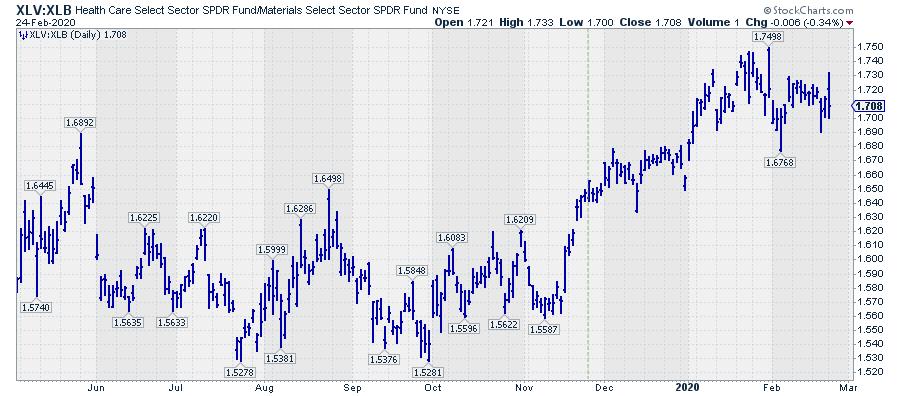
This trade started to work well almost immediately. In particular, the break above the May 2019 high in the ratio gave this position a boost and pushed it to new highs. This trade should probably have been closed at the end of January when the ratio started to roll over, mainly as a result of the Healthcare sector rolling over inside the leading quadrant and starting to head South towards weakening.
Ironically, I did push a trade idea involving a short in Healthcare on 28 January....
So, while this trade is still at a profit, it seems like a good idea to close it.
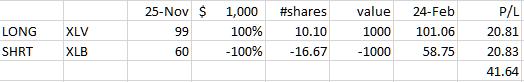
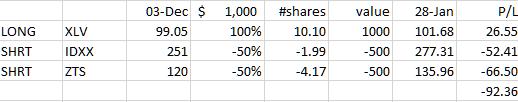
3 December 2019 - XLV vs. IDXX & ZTS
This trade was suggested in Sector Spotlight on 3 December 2019. The primary goal was to show how you can setup a three-legged pair trade with one long position, in this case the Healthcare sector ETF against two individual stocks on the short side, IDXX and ZTS.
The arrows indicate where the tails for these securities were on that date. XLV was about to cross over into the leading quadrant at a good RRG-Heading, while both IDXX and ZTS were rapidly heading towards or already inside the lagging quadrant.
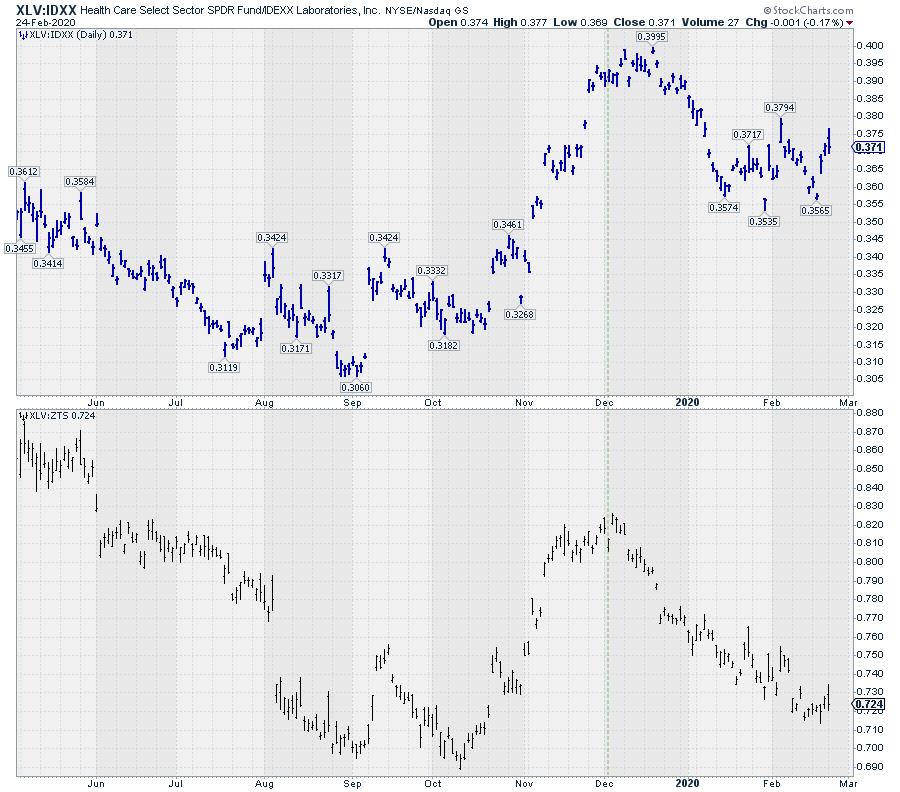
As the ratio charts above show, this only worked for a couple of days before both ratios dramatically rolled over and started heading South, going against us.
I discussed failing to pay attention and follow up or close this idea in the 28 January episode, when the trade was at a loss of $92. And although this probably never was a really successful trade to begin with, there have been plenty of warning signals flashing to get out much earlier.
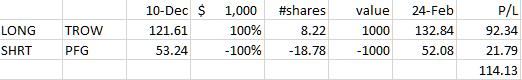
10 December 2019 - TROW vs. PFG
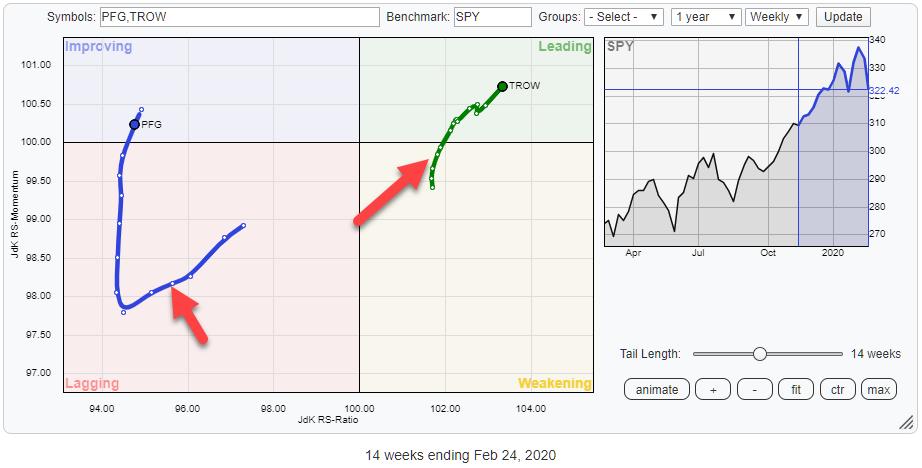
In the show from 10 Dec. I picked two stocks from the Financial sector. At that time, TROW had just curled up again while inside the improving quadrant, whereas PFG was still heading further into the lagging quadrant.
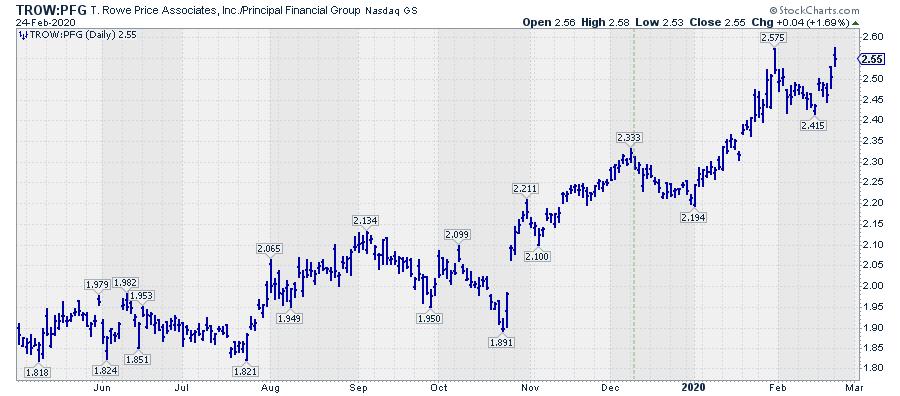
From the start, the P/L for this trade started to move down until the ratio line hit a support level offered by former horizontal resistance. During this decline on the (daily) ratio chart, the tails on the RRG held up well - especially TROW, the driving force behind the P/L.
At the start of 2020, things really started to work and the TROW:PFG ratio was pushed to new highs.
With the tail for TROW well inside the leading quadrant (and still at a strong heading) and the tail for PFG now hooking back down while inside improving (but far to the left of the benchmark), this trade looks ready to continue in a positive direction.
17 December 2019 - GS vs. BA
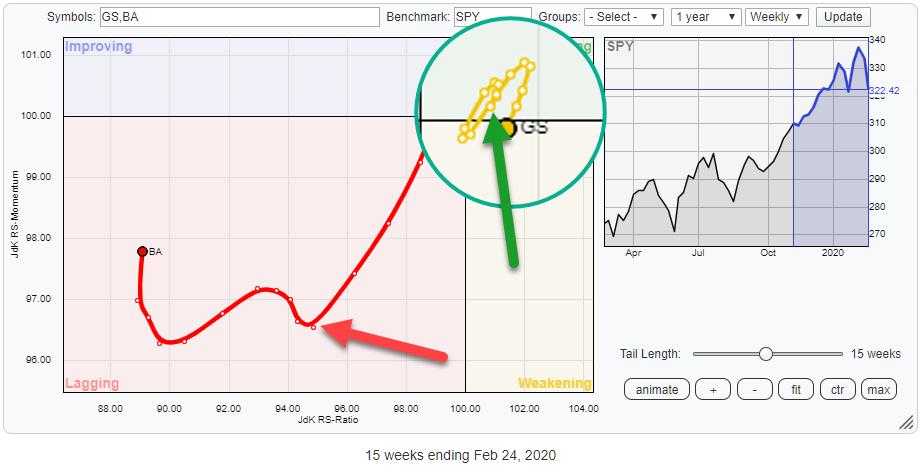
This trade came from looking at the rotation of the individual members of the DJ Industrials index (using SPY as the benchmark on the RRG above in order to keep things consistent with the other stock/ETF ideas). On the Relative Rotation Graph, GS just rotated back into the leading quadrant after a very short stint through weakening.
At the same time, BA was pushing deep(er) into the lagging quadrant at a long tail (a lot of power).
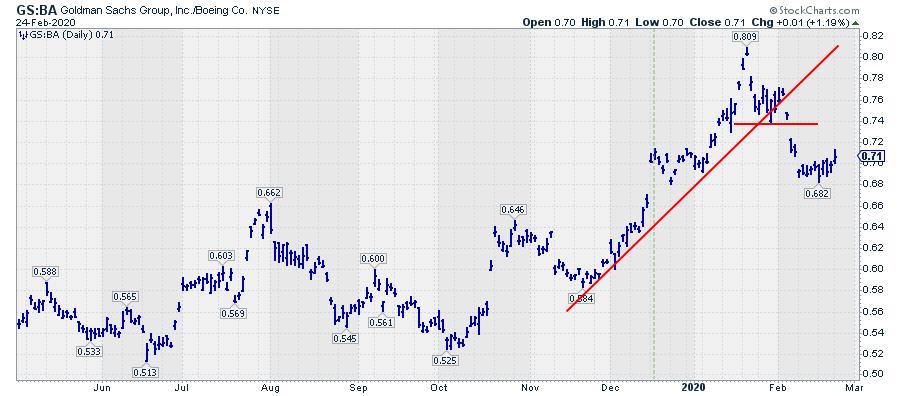
What added to the conviction for this trade was the fact that the GS:BA ratio had just broken out of a range at that time. (See the green dashed line on the chart above.) After that breakout, the ratio consolidated while staying above the breakout level, before jumping again to a new high in January. Towards the end of that month, the ratio started to deteriorate, especially when it broke the rising trend line that had run under the lows since November last year.
That trade should have been closed, at a profit, then and there. From a money management perspective, it is a big no-no to let a winning trade, at its high well over $ 100, run into a loss.
In all honesty, the trade looks to be coming back to life again now with the tails, at least on the daily RRG, rotating back in favor of GS over BA and the ratio potentially putting in a low just above the upper boundary of the former trading range. But I am going to close this one anyway, as holding it now would be holding it for wrong reasons.
7 January 2020: IVW vs. IVE
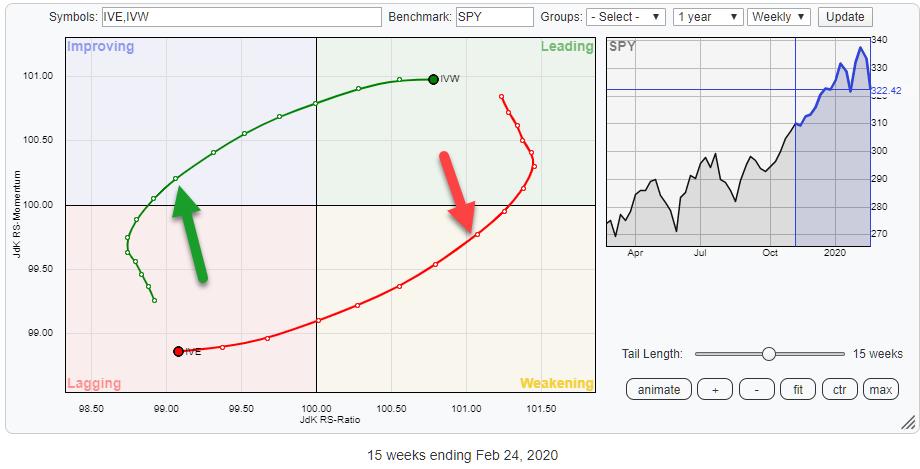
RRGs can also very well be used to show and track rotations other than sectors or individual stocks. The RRG above shows the rotation of Growth vs Value, using the iShares S&P 500 Growth (IVW) and iShares S&P 500 Value (IVE) ETFs.
On 7 January, IVW had just crossed over into the improving quadrant from lagging at a positive RRG-Heading, while IVE just did the opposite. Btw, these two ETFs almost always move in the exact opposite direction.
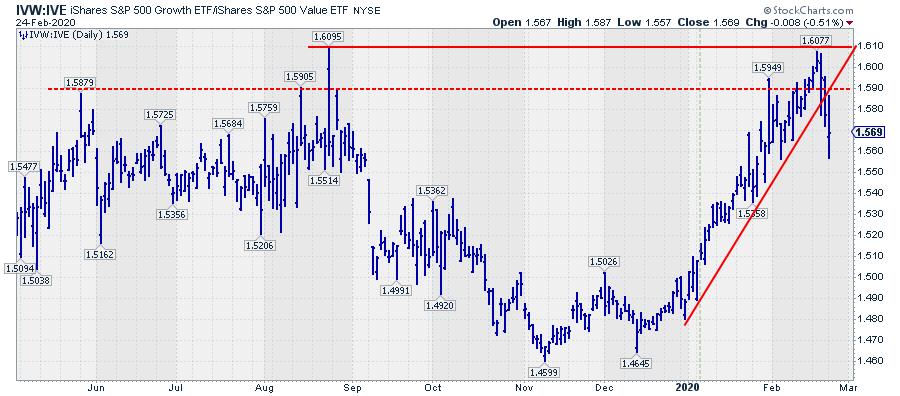
Right from the start, this trade started to work pretty well, moving all the way up to the peak level of this ratio from August. The "real" resistance for this pair was probably around the 1.59 level, where it has peaked a few times in the past.
The IVW:IVE ratio has broken a steep rising support line a few days ago, signaling an end to this rapid rise, while on the daily RRG, the rotation for IVE has taken over from IVW, so I am going to close this idea here and remain on the lookout for a new opportunity.
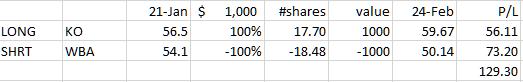
21 January 2020: KO vs. WBA
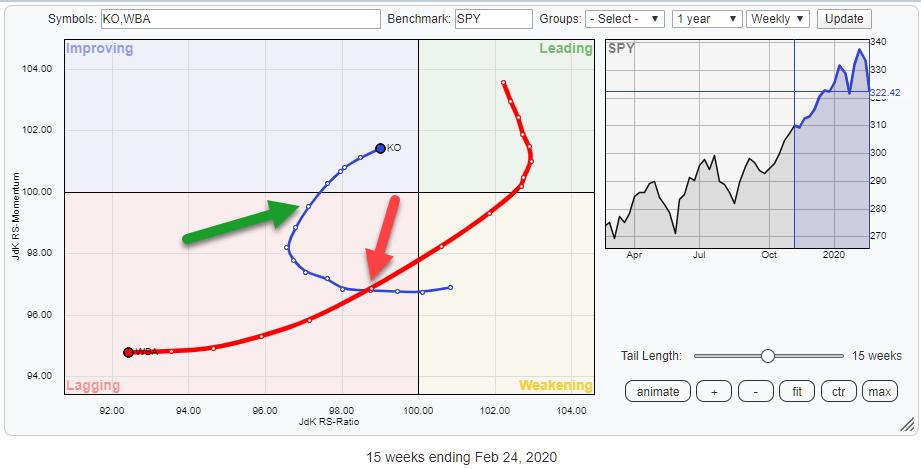
This idea came from the DJ Industrials universe again. On 21 January, KO had already turned around inside the lagging quadrant and was about to rotate into leading, while WBA had just entered lagging with RRG-velocity increasing. The upward break for KO versus the downward break for WBA on their respective price charts supported this pair trade idea.
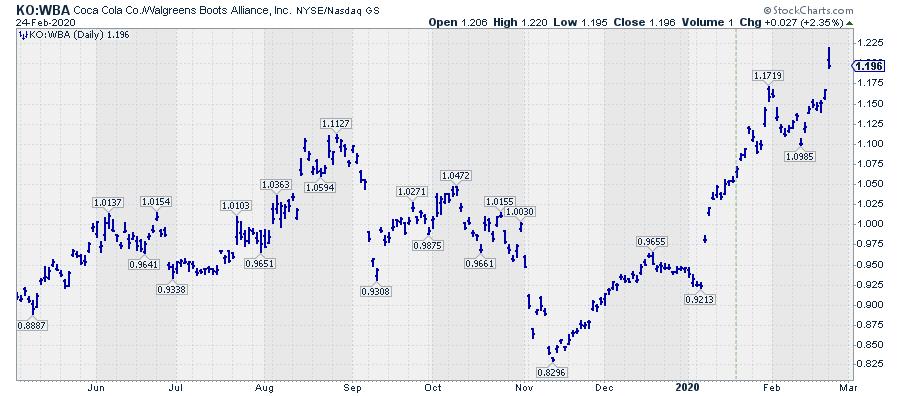
The relative rotations and the breaks on the price charts immediately continued and started to work in our favor, pushing the ratio above its August 2019 high.
After a short consolidation in the first half of February, the trade started to continue in our favor yesterday while the RRG and both price charts are still supportive. All good reasons to stay with this one for now.
28 January 2020: XLY vs. XLV
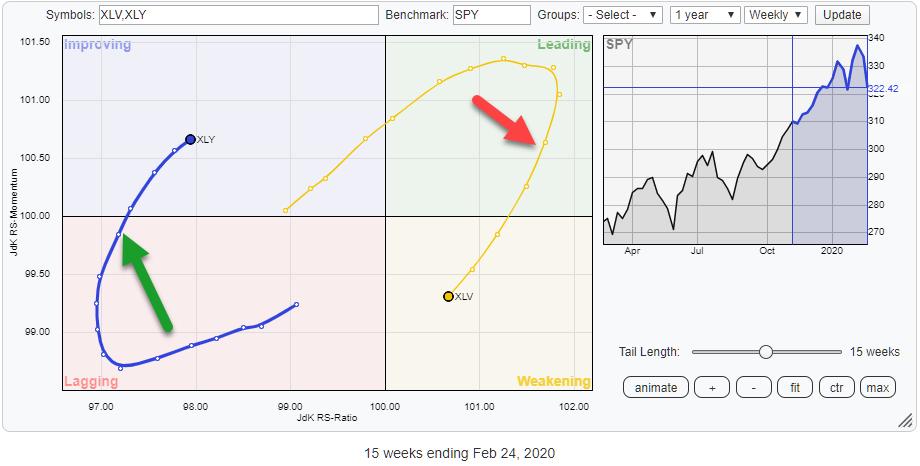
The idea that was launched on 1/28 came from combining seasonality with RRG. The seasonality chart illustrating all sectors showed, for the then-coming month of February, XLY outperforming SPY 70% of the time against an underperformance for XLV 70% of the time (which, btw, is the reverse of 30% outperformance, which is shown on the chart).
The rotation on the RRG at that point in time nicely lined up with the odds coming from the seasonality chart - hence, a pair trade idea was born.
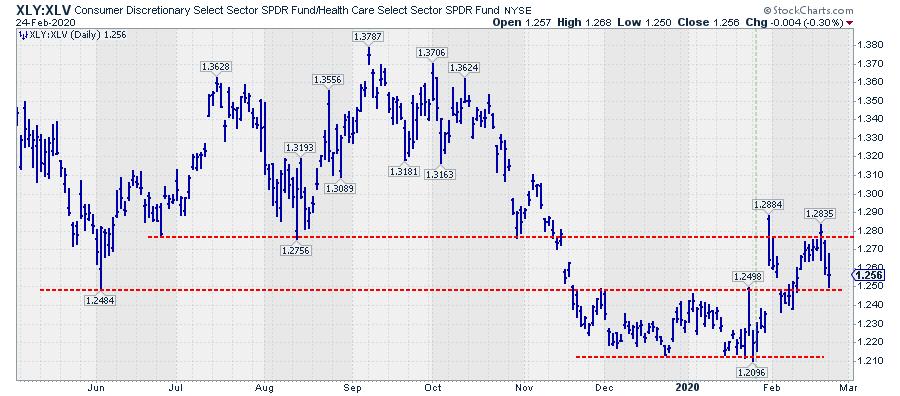
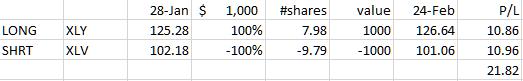
The dashed green line indicates 1/28 and shows the jump higher a few days after. This jump put the idea into profit right away while, at the same time, completing a bottom formation that followed a downtrend that emerged in October.
The current rotation is still in favor of XLY over XLV and, as long as the ratio remains above its former breakout level, all ingredients for a continuing outperformance remain intact - hence, so does the trade idea.
Jumping above the 1.28 area on the ratio chart will certainly help further progression of that move.
4 February 2020: GLD vs. JJMTF
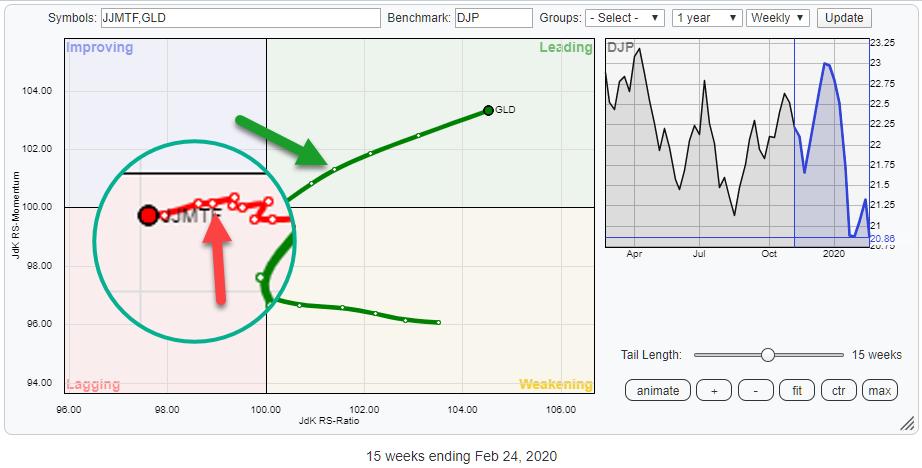
This idea was launched in an attempt to bring in some diversification into commodities. However, although I still believe that such ideas can hold value, this was not the best way to do it, primarily because of the lack in liquidity for the JJMTF leg of this pair. I should have known better ..... :(
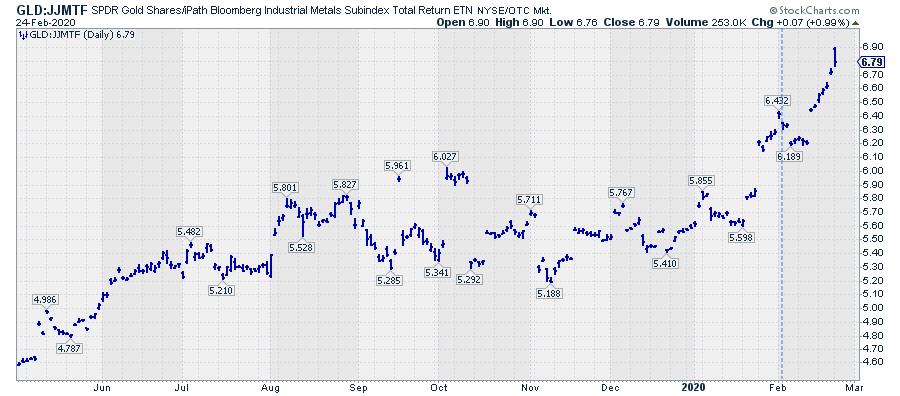
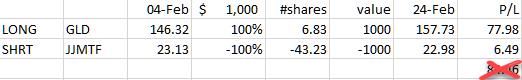
The ratio chart above shows that the call was pretty much spot on and, with liquid instruments, would have been profitable right away. With hindsight, I probably should have picked a liquid part from the industrials metals group, like copper or so.
Despite the fact that it's currently up around $85 since 2/4, I am going to let go of this idea and register zero return, as it was probably not achievable in the real world.
11 February 2020: CSCO vs. WMT
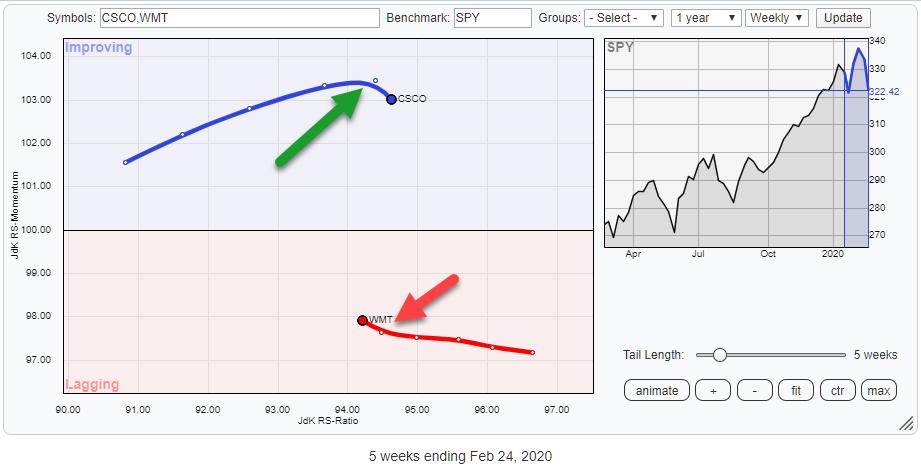
Watching the tails for both stocks cross each other on the vertical axis looked like the signal for a change with CSCO taking the lead over WMT.
And it did..... for exactly ONE day... and then the ratio plummeted.
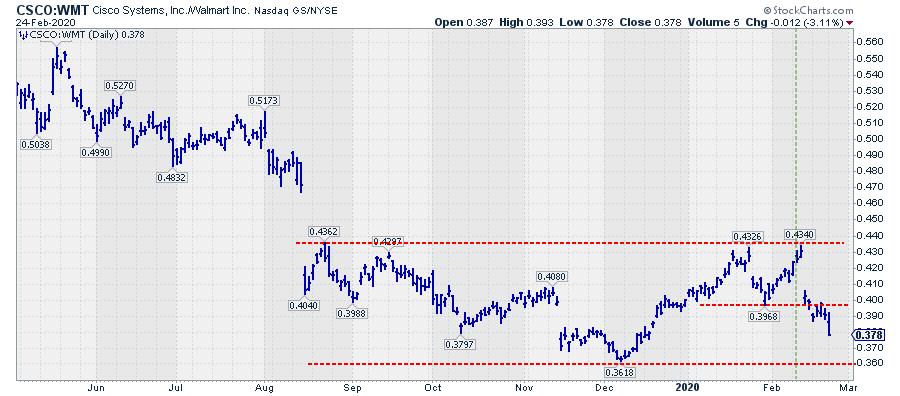
At first, it went down to its previous low. Two days later, that low was taken out and now the decline seems to be accelerating.
The LIFO principle, "Last In - First Out," seems to be the appropriate way to handle this.
All the reasons for launching this idea have been destroyed in a little over a week's time and we're taking a hit here.
Summary
Since starting the Pair Trade Idea segment in Sector Spotlight, ten ideas were launched. After cleaning up a bit, seven of these ideas have been closed. Four at a profit, one flat and two at a loss. The total return on all ideas, open and closed, is at $210 (average profit per trade so far is $21).
It's once again clear that the two bleeders are too big, emphasizing again that closely monitoring a portfolio remains one of the most important aspects.
Three ideas are still open and I will do my very best to come up with a new idea every week in Sector Spotlight.
-- Julius
Julius de Kempenaer
Senior Technical Analyst, StockCharts.com
Creator, Relative Rotation Graphs
Founder, RRG Research
Want to stay up to date with the latest market insights from Julius?
– Follow @RRGResearch on Twitter
– Like RRG Research on Facebook
– Follow RRG Research on LinkedIn
– Subscribe to the RRG Charts blog on StockCharts
Feedback, comments or questions are welcome at Juliusdk@stockcharts.com. I cannot promise to respond to each and every message, but I will certainly read them and, where reasonably possible, use the feedback and comments or answer questions.
To discuss RRG with me on S.C.A.N., tag me using the handle Julius_RRG.
RRG, Relative Rotation Graphs, JdK RS-Ratio, and JdK RS-Momentum are registered trademarks of RRG Research.
Julius de Kempenaer
Senior Technical Analyst, StockCharts.com
Creator, Relative Rotation Graphs
Founder, RRG Research
Host of: Sector Spotlight
Please find my handles for social media channels under the Bio below.
Feedback, comments or questions are welcome at Juliusdk@stockcharts.com. I cannot promise to respond to each and every message, but I will certainly read them and, where reasonably possible, use the feedback and comments or answer questions.
To discuss RRG with me on S.C.A.N., tag me using the handle Julius_RRG.
RRG, Relative Rotation Graphs, JdK RS-Ratio, and JdK RS-Momentum are registered trademarks of RRG Research.


