It's a Puzzle
Regular readers of the RRG blog and my contributions to DITC and the ChartWatchers newsletter, as well as watchers of Sector Spotlight, will probably be aware of my recent research exercises to combine RRG with seasonality.
The reason for doing that lies in my belief that the analysis of financial markets should be seen like a puzzle - a puzzle that we try to solve every day, because the image on the puzzle changes every day. The most frustrating about this puzzle is that it is never finished, so we will never get to "see" the complete picture and enjoy it.
IMHO, we have to settle for the next best thing and try to get as close as possible by combining various pieces of the puzzle, in this case the various tools that we have in our technical toolkit. These pieces can be different for different investors, with different goals and different investment horizons.
Obviously, Relative Rotation Graphs are my preferred piece of the puzzle to get the big picture, but I realize (and I am telling everyone this) that it is only one piece of the puzzle, which is not nearly enough to build an investment process or a trading strategy on.
At the end of the day, the price chart will be our ultimate or final piece of the puzzle that will help us either pull the trigger or not. But we can try to make the path to that individual price chart as strong as it can be. I always like to approach the market top-down and keep the big picture in mind as much as possible.
Seasonality
Another tool in the technical toolkit that keeps an eye on the big picture and, at the same time, provides some insight into the (potential) future, based on its average historical movement, is seasonality.
This seasonality tool was, for me, one of those things that got less and less attention over time because I was tied up with other things - like RRG, for example ;). I am sure you know what I mean. We all have these things that we study and come to like, but then, when we move on from these subjects, they sort of drop off the radar.
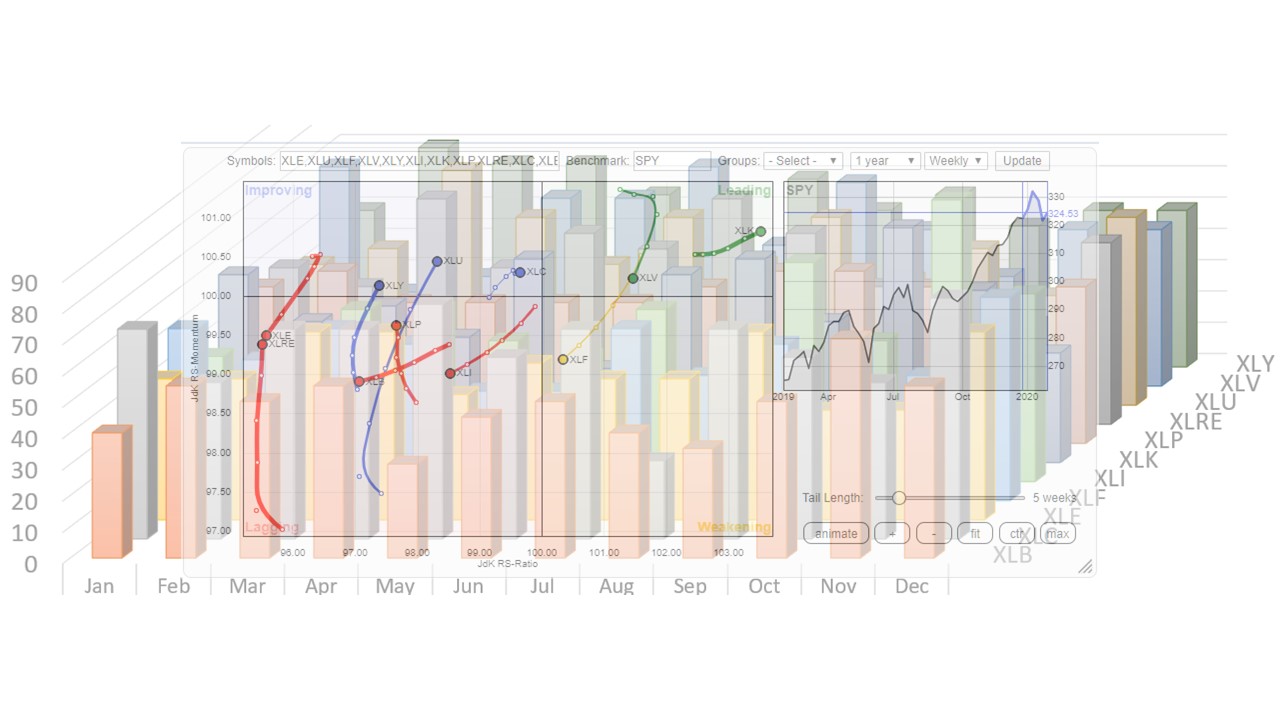
Mid-2019, I started to pick up work on seasonality again, because one of my ideas is to be able to render a Relative Rotation Graph, with the seasonal rotation dimmed and plotted in the background, extended into the future for a few weeks and then the actual rotation overlaid on top of that seasonal pattern. This way, we can see if the current rotation is following the seasonal pattern and to what degree. Therefore, we can also determine what the potential rotation for the next few weeks is likely to be.
We're not there yet, but work is underway. One of the things I came up with in the process is bringing seasonality in one picture.
I wrote on this a few times and presented it in my weekly Sector Spotlight show on StockCharts TV. Probably the best article to read up on this concept is Slicing and Dicing Seasonality, which appeared in the ChartWatchers newsletter on 12/20/2019. In that article, I highlighted the seasonal strength for the Healthcare sector going into January and showed the accompanying strong rotation for XLV on the Relative Rotation Graph for US sectors.
At the end of January, I presented a pair trading idea in Sector Spotlight, again involving Healthcare but also the Consumer Discretionary sector. This idea came from combining info found on the RRG with the seasonal pattern(s) that showed up for the month of February. The seasonal patterns for February are highlighted on the chart below:
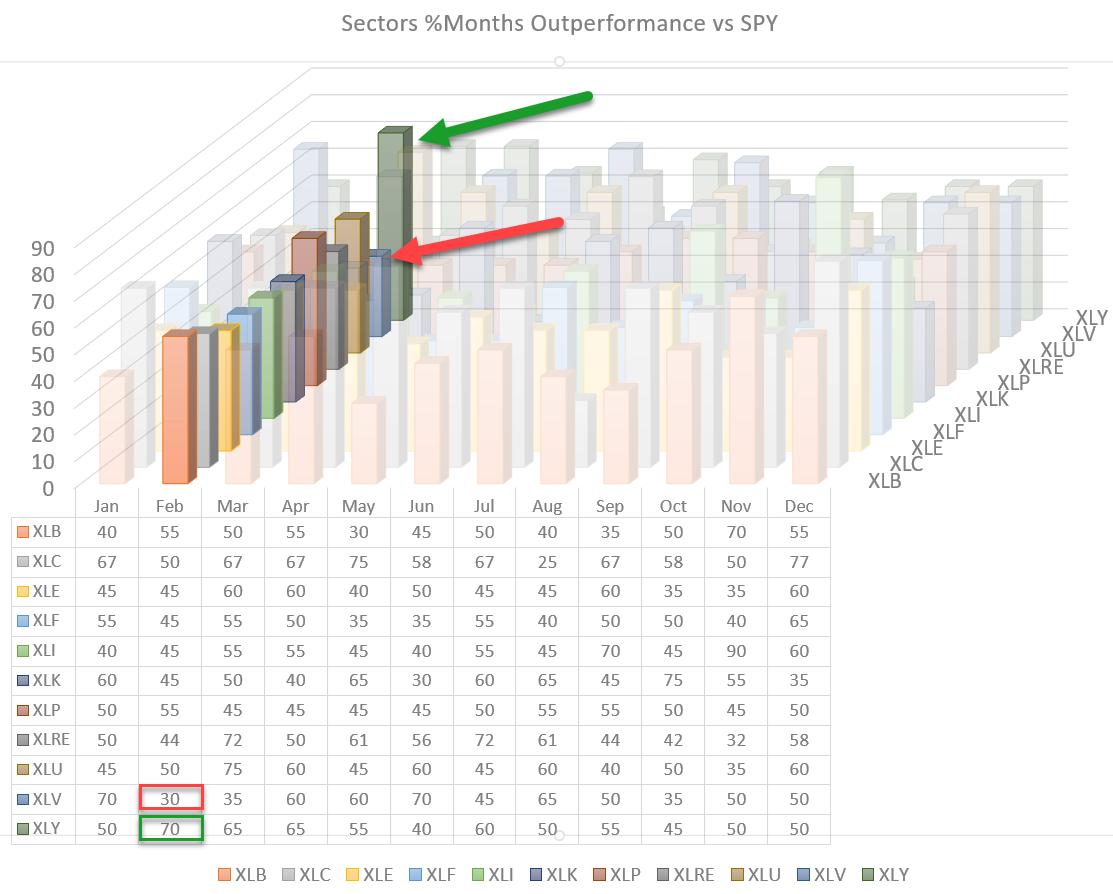
Most sector (out-)performances in February are like a coin toss, around 50%. However, two sectors stand out. The first one is Consumer Discretionary, XLY, which historically has outperformed SPY 70% of the time. Healthcare has outperformed SPY only 30% of the time. This means that the sector has UNDERperformed SPY 70% of the time. These are interesting odds.
The Relative Rotation Graph
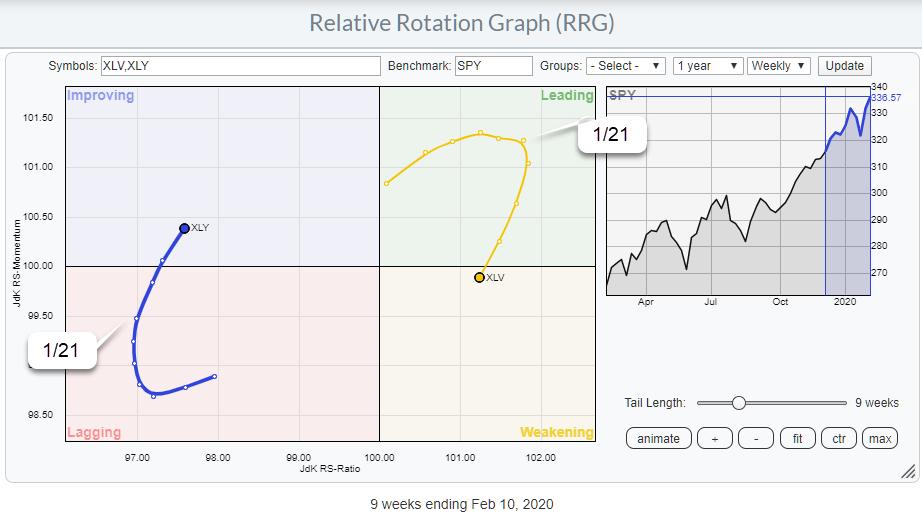
The RRG above shows the rotations for XLY and XLV against SPY. The highlighted observation is the week beginning on 1/21*. This means that the Friday for that week was 1/24. Sector Spotlight aired the following Tuesday 1/28.
*1/21 was a Tuesday because markets were closed on 1/20 due to MLK day.
What was interesting to me was that the tail of XLV had just begun to roll over inside the leading quadrant and move lower, while the tail for XLY had just started to curl up and move higher. Usually, this would be a pretty aggressive call, but, with the help from the seasonal stats, it came out as a good idea.
The Final Check
Moving to the final check on the price charts for both these sectors showed these pictures:
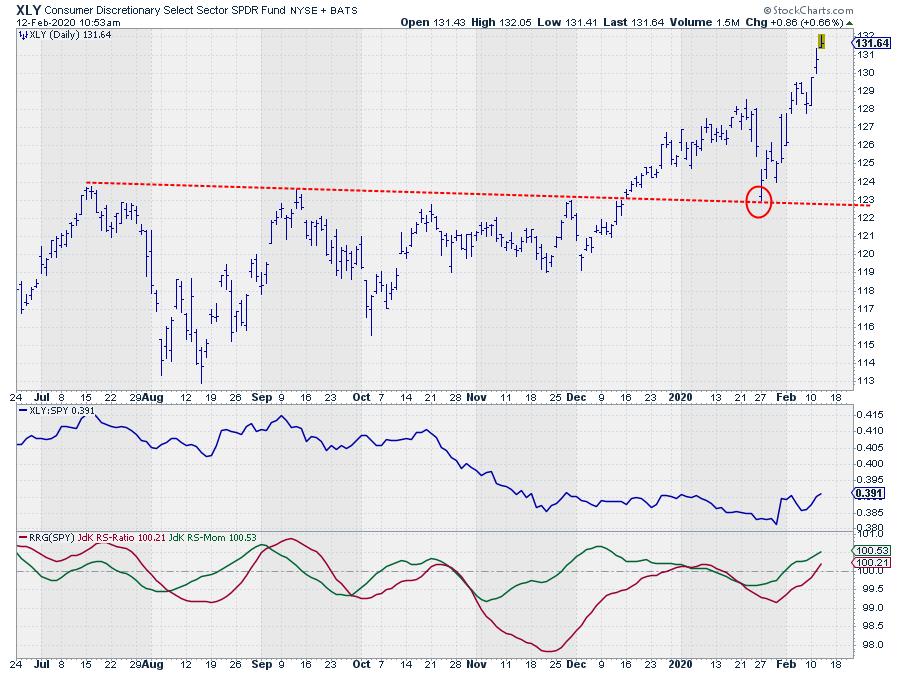
XLY tested and bounced off a former resistance level that started to act as support at around $123. This confirmed the breakout that occurred in the middle of December.
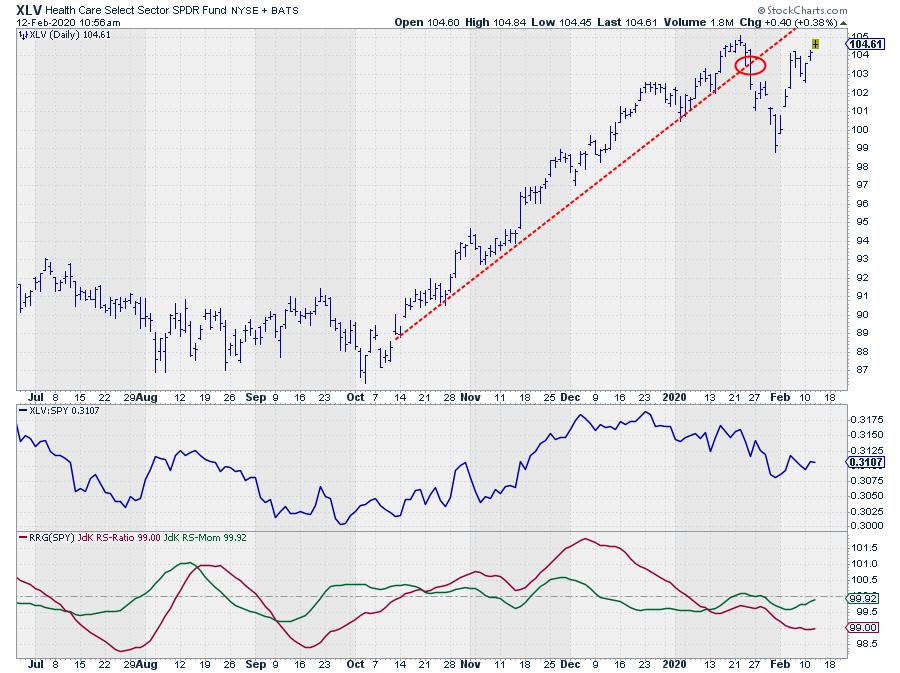
XLV, on the other hand, had just broken a steep rising support line and started to show weakness.
The last thing you then want to check is the raw ratio of XLY vs XLV.
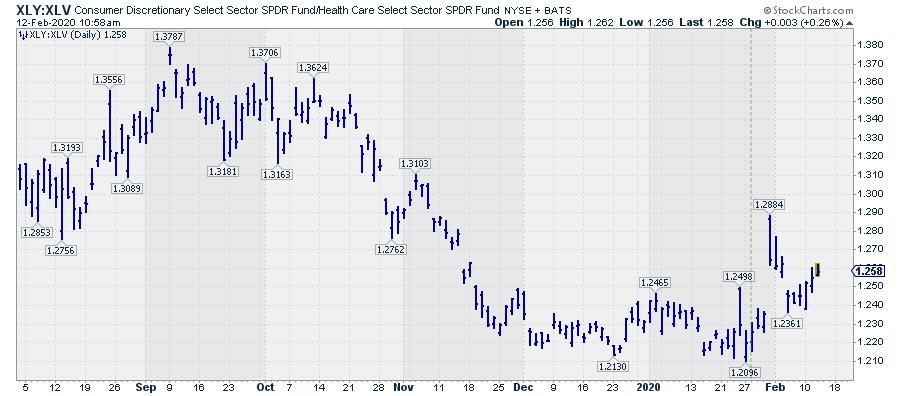
The opaque dashed line is on 1/28, the date when Sector Spotlight aired. The ratio had just come to a rest at the level of the previous low and started to work its way higher. This meant that support had held for that ratio and that at least a small rally from that support level could be expected.
Also, if you want to think in stop-loss terms for pair-trades like this, it meant that downside was protected around 1/21, while first resistance to the upside was at 1/25 but pretty much way open after a break of that barrier.
Shortly after 1/28, the ratio gapped away, confirming the change in trend. The pullback to close that gap a few days later is only supporting the scenario for further upside.
Daily Rotation Since 1/28
The RRG below is the daily RRG for both sectors against SPY, with the tail starting on Monday 1/27 and ending today 2/12.
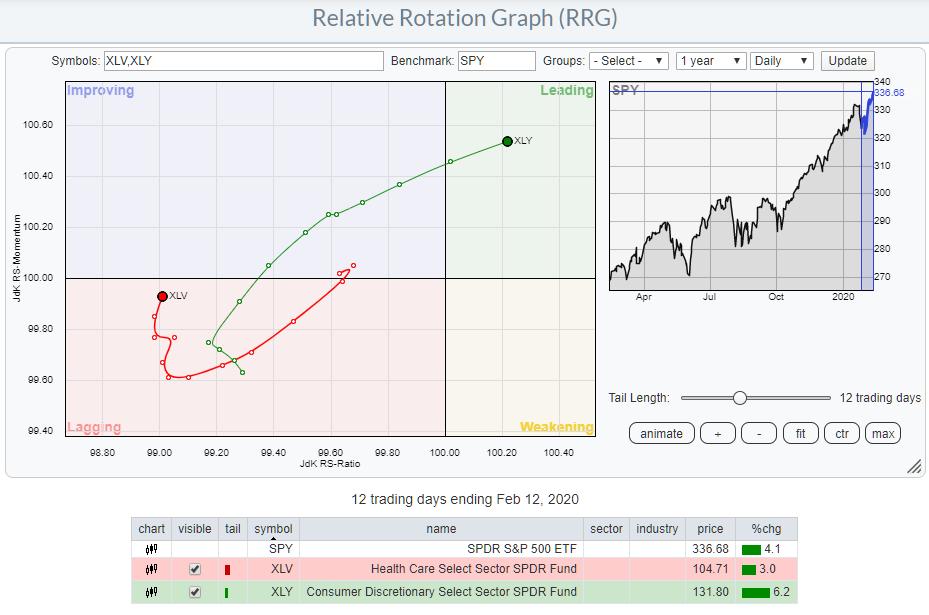
The table below shows the performance for both sectors since 1/27, indicating an outperformance of Discretionary over Healthcare of 6.2% - 3.0% = 3.2% so far.
All in all, the combination of rotations on the RRG and the seasonal pattern for the then-upcoming month of February, as well as the supporting price charts, lead to this idea that is working out well so far.
--Julius
Julius de Kempenaer
Senior Technical Analyst, StockCharts.com
Creator, Relative Rotation Graphs
Founder, RRG Research
Want to stay up to date with the latest market insights from Julius?
– Follow @RRGResearch on Twitter
– Like RRG Research on Facebook
– Follow RRG Research on LinkedIn
– Subscribe to the RRG Charts blog on StockCharts
Feedback, comments or questions are welcome at Juliusdk@stockcharts.com. I cannot promise to respond to each and every message, but I will certainly read them and, where reasonably possible, use the feedback and comments or answer questions.
To discuss RRG with me on S.C.A.N., tag me using the handle Julius_RRG.
RRG, Relative Rotation Graphs, JdK RS-Ratio and JdK RS-Momentum are registered trademarks of RRG Research.
Julius de Kempenaer
Senior Technical Analyst, StockCharts.com
Creator, Relative Rotation Graphs
Founder, RRG Research
Host of: Sector Spotlight
Please find my handles for social media channels under the Bio below.
Feedback, comments or questions are welcome at Juliusdk@stockcharts.com. I cannot promise to respond to each and every message, but I will certainly read them and, where reasonably possible, use the feedback and comments or answer questions.
To discuss RRG with me on S.C.A.N., tag me using the handle Julius_RRG.
RRG, Relative Rotation Graphs, JdK RS-Ratio, and JdK RS-Momentum are registered trademarks of RRG Research.


