Relative Rotation Graphs can show many different relationships. They do not necessarily have to come from regular price data-series like stocks or indexes.
In my weekly show on Stockcharts TV, Sector Spotlight, which airs every Tuesday from 10.30-11.00 am ET I spent time on pair trades on a regular basis.
Usually I work from a standard RRG showing stocks or ETFs to find a long and a short candidate that I can put together as a pair(trade). While doing that a question/suggestion came in to plot the pair as such on a Relative Rotation Graph.
This can help a pair-trader monitor different pairs on a RRG and see if they are still worth holding on to.
On a default Sharpchart we can simply enter the two securities separated by a colon and the system will draw the ratio.
A pair could for example be the ratio between SPHB and SPLV. SPHB is an ETF that tracks High BETA stocks inside the S&P 500. SPLV is an ETF that tracks Low Volatility stocks in the S&P 500.
The general idea is that High Beta stocks will outperform in bull markets while Low vol stocks will outperform during bear markets as they are seen as more defensive.
Another pair could be SPY:TLT, the ratio between stocks and bonds, or offense vs defense. Or the Discretionary vs Staples ratio as I described in this article.
There are many pars/relationships that are worth keeping an eye on. Plotting a few of those on a Relative Rotation Graph can be helpful and provide information from another angle.
But how can we do that?
The RRG input bar does not accept ratio symbols so we need to get creative.
The solution is to use the UDI function, User Defined Indexes. Here we can create custom data-series/indexes.
In order to create a UDI for a pair, let's say SPHB vs SPLV these are the steps to follow.
Bring up a sharpchart showing this relationship.
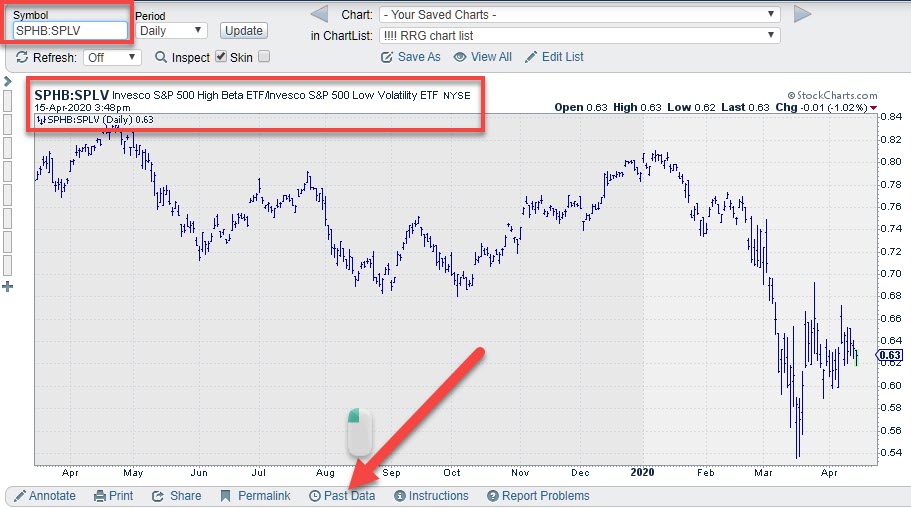
Then click on the "Past Data"link below the chart
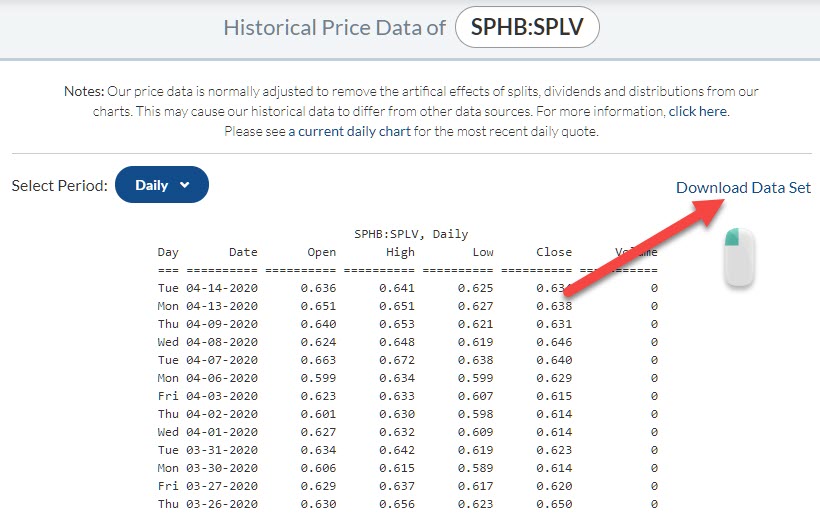
That will open up a page with the underlying data for this ratio in tabular format. Click on the link at the top right to download this data set to a csv file on your own computer.
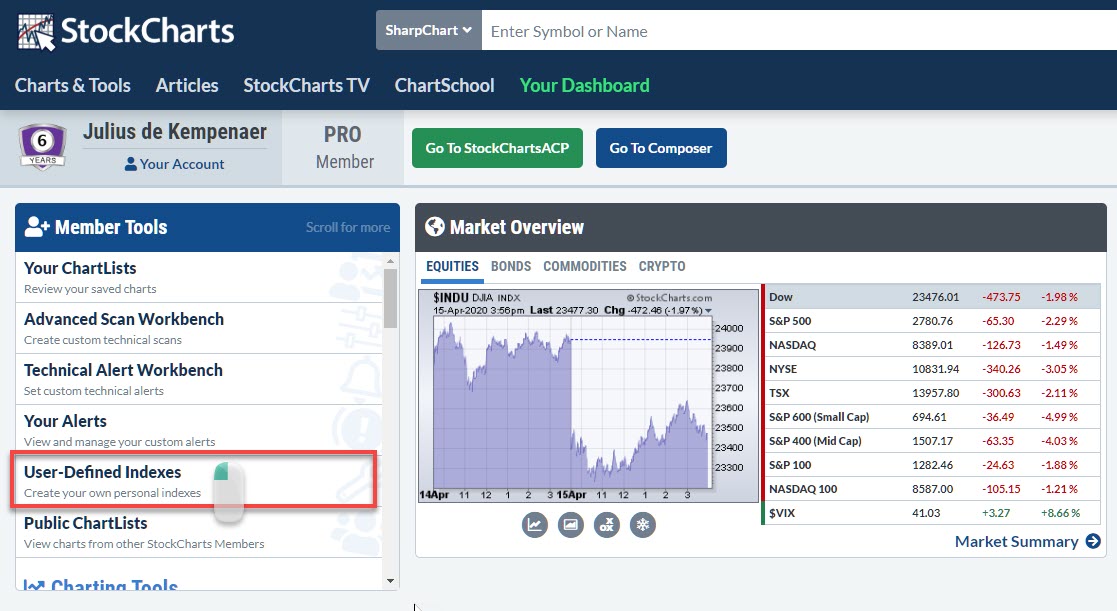
The Go to your dashboard and open the User Defined Indexes workbench.
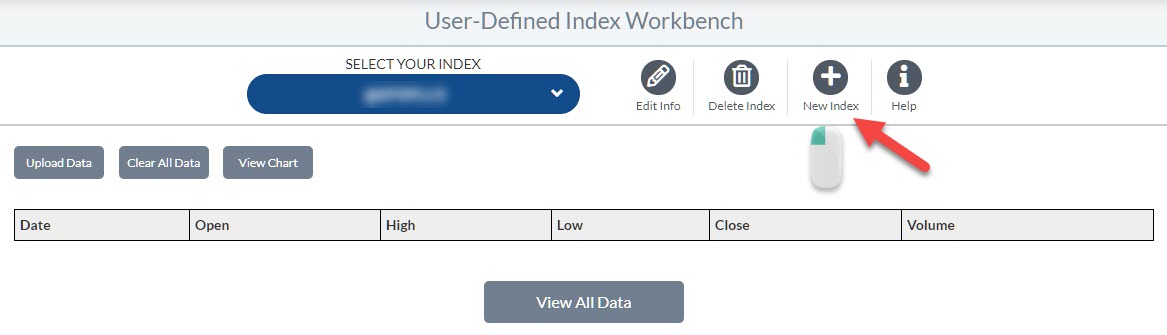
On the UDI workbench click on the + sign to create a new index.
And fill in the required fields to recognize the UDI that we are setting up later on in the process to use it. I am calling this index SPHBLV. Note that all UDIs are preceded by the @ sign.
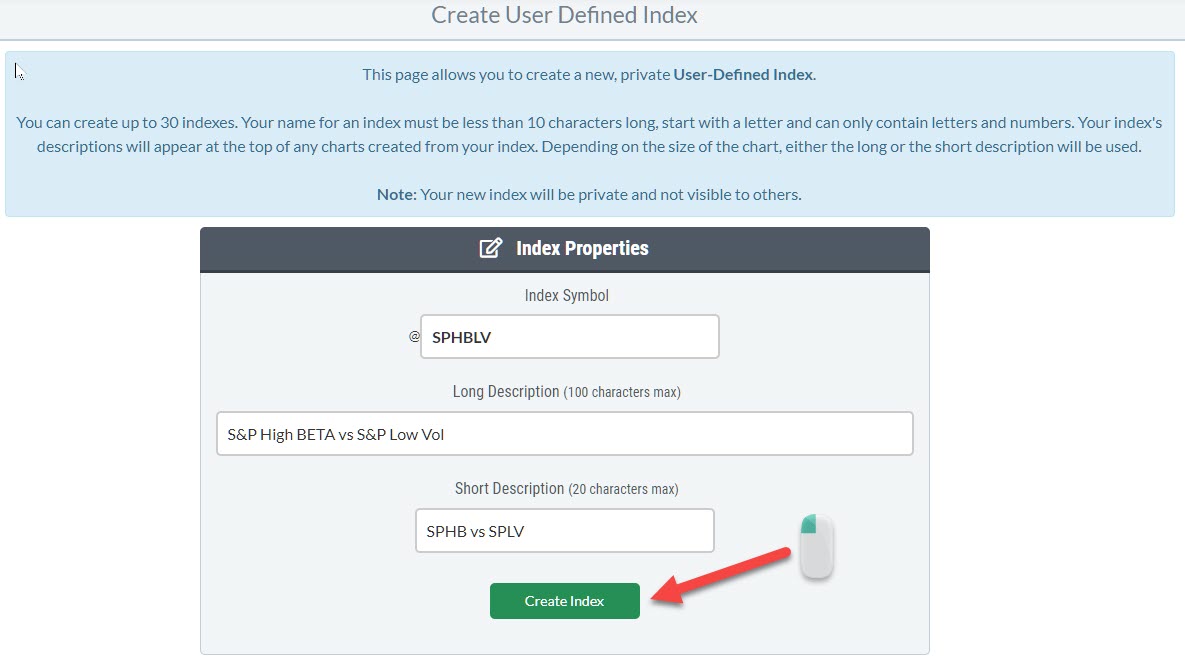
Finish by clicking "Create Index" after which the index will be created.
The index still does not hold any valuews at this point in time.
In order to fill our index with data we are going to upload the data-set that we previously downloaded.
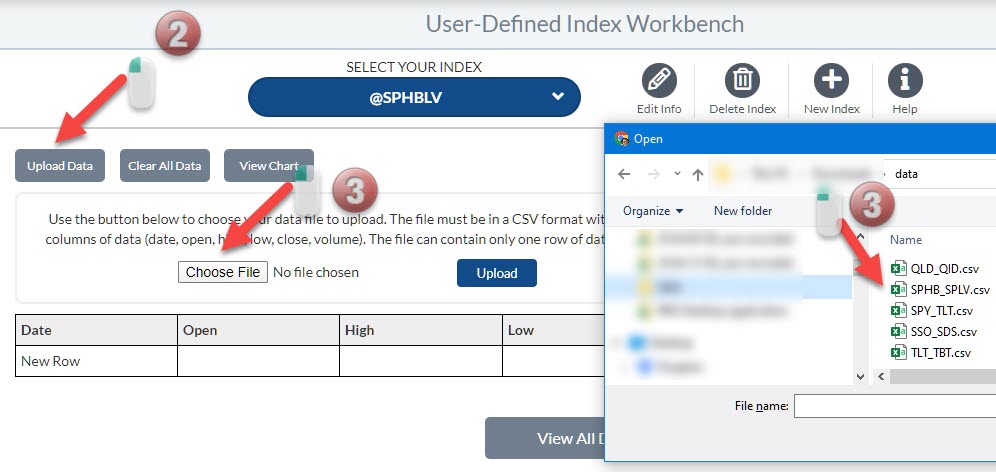
To do that click on upload data which will open a dialog that allows you to choose a file on your local machine. Find the data file holding the ratio values that was previously downloaded and select it.
Finally click the blue upload button to load the values into the UDI.
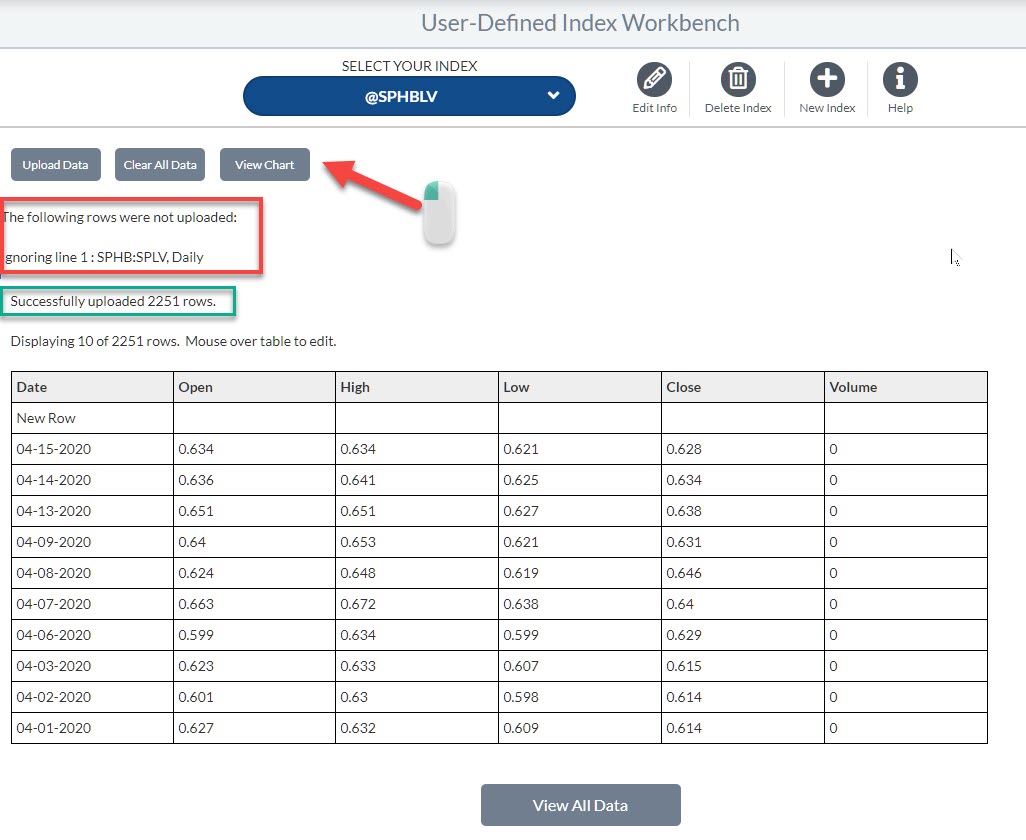
When the upload is complete the screen underneath will show. You can ignore the warning in the red box. To check how the created UDI look, click on the "view chart" button.
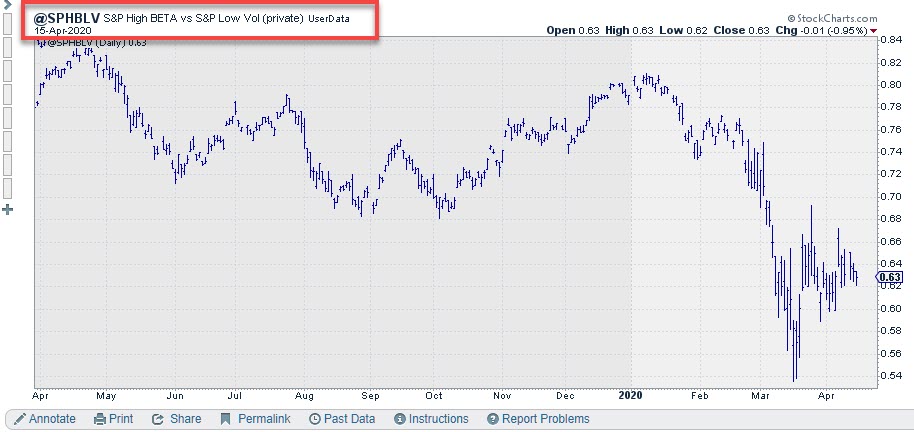
As you can see it is the exact same chart as when we entered the symbols as a ratio in the sharpchart (at the top of this article) but now it is showing our newly created UDI symbol.
The fact that this is now a single ticker symbol allows us to use it as an input for RRG.
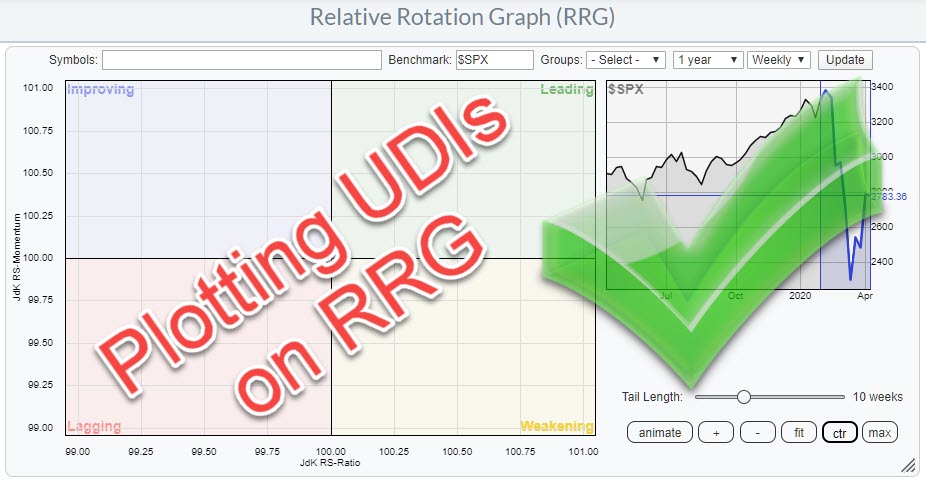
The RRG below shows a few ratios that I have created UDIs for.
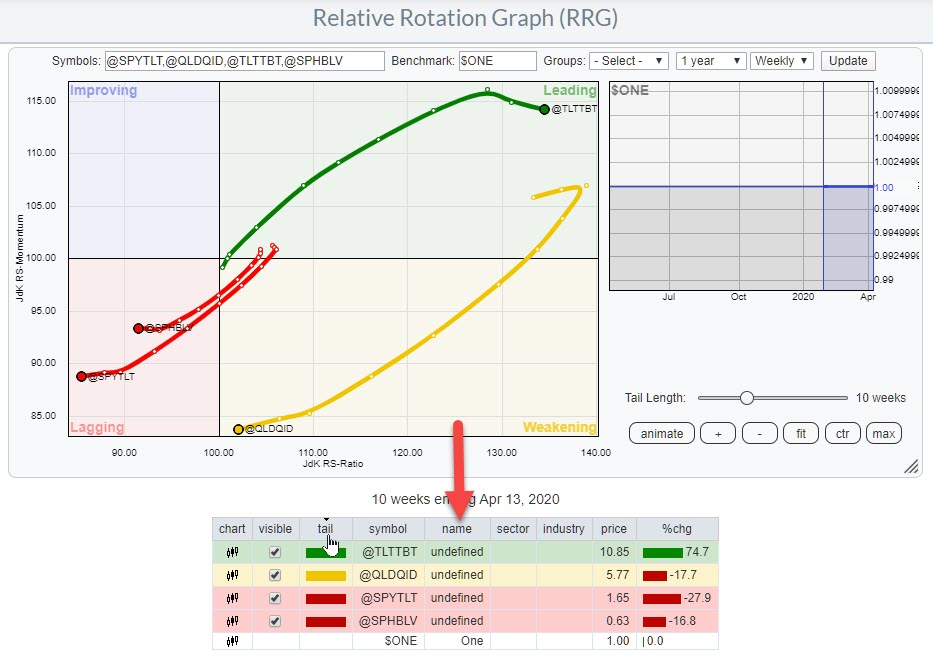
Because these pairs are market agnostic I have entered $ONE as the benchmark to get a proper view of the trend in the returns for these pairs.
Please let me know what you think of this usage for RRG and if you have created a setup for yourself, which pairs you are monitoring.
#Staysafe, Julius
Julius de Kempenaer
Senior Technical Analyst, StockCharts.com
Creator, Relative Rotation Graphs
Founder, RRG Research
Host of: Sector Spotlight
Please find my handles for social media channels under the Bio below.
Feedback, comments or questions are welcome at Juliusdk@stockcharts.com. I cannot promise to respond to each and every message, but I will certainly read them and, where reasonably possible, use the feedback and comments or answer questions.
To discuss RRG with me on S.C.A.N., tag me using the handle Julius_RRG.
RRG, Relative Rotation Graphs, JdK RS-Ratio, and JdK RS-Momentum are registered trademarks of RRG Research.


