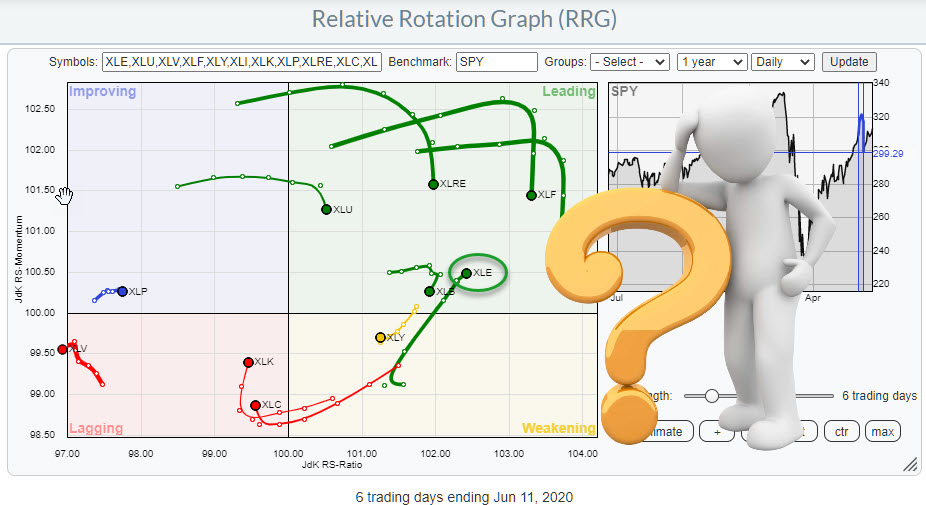
This question was forwarded to me by Dave Keller after he received it in the mailbag for his show The Final Bar.
"The RRGs attached all make sense except for XLE. It was down nearly 9% the last two days, but the RRG has it moving up from weakening. What am I missing? XLI, XLF sloping down towards weakening makes sense."
You need to know that Dave was one of the very early adapters of Relative Rotation Graphs while he was still a director of technical research at Fidelity. At that time, RRGs were only available in my head and in my spaghetti VBA-coded Excel spreadsheets, and I published them in my own research reports for my institutional clients.
When RRGs were launched on the Bloomberg professional terminal in 2011, I visited Dave and his team in Boston, where they have their famous Chart Room. I took some pictures, but they are probably buried among the gazillion other pics that I have scattered all over my phone, iPad, and various hard drives, but you can get an idea of how that room looks in this blog post ("The World's Most Awesome Room") by JC Parets, who visited the site in 2012 and was smart enough (unlike me) to put the pics online.
One of Dave's accomplishments (I believe) was the installation of a mega-big plasma screen in one of the offices/rooms that is connected to the chartroom. In my mind, it was something like a 10-foot screen, probably less but still huge, and we loaded up the Bloomberg implementation of RRG on that screen. You could see anything in the finest details.
You know what, here's the image from an old tweet:

I'd love to see the, much more modern, StockCharts version of RRG on such a screen, including the animations, etc. which were not available at that time.
All of this history is basically to tell you that Dave is perfectly capable of answering questions on RRG, which he also did for this one in his show of Friday, 6/12. Here is the segment.
I'll try to add some extra color in this written article. There are two important reasons why the (absolute) performance of a security doesn't always reflect the most intuitive position on the RRG, i.e. positive performance, security is in leading, weak performance security is in lagging.
- RRG looks at relative performance, so it is very possible that a security shows up in the leading quadrant while the market is falling but the security is falling less fast. Or, the other way around; a security with a positive performance shows up in lagging while the market is rising - but that security is just not rising fast enough to beat the benchmark.
- RRG looks at relative trends. And just like trends in price charts, trends in relative charts do not follow a straight line. They go up and down, make (higher) highs and (higher) lows or vice versa. So, when a relative up-trend is ongoing, a few days of weak(er) performance will not immediately hurt the rotation on the RRG.
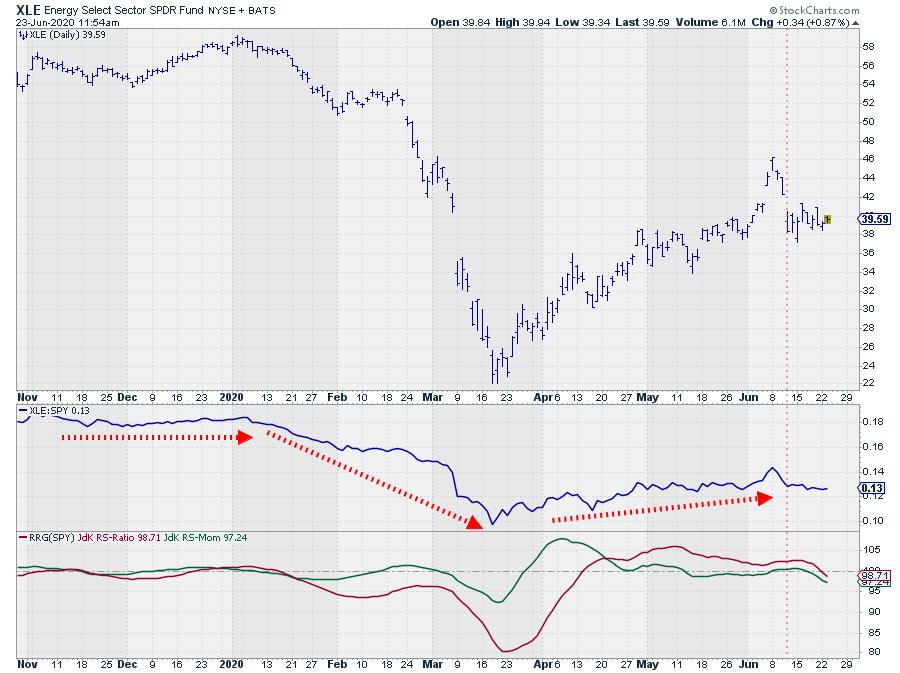
In order to understand the rotations on a Relative Rotation Graph, you need to look at the Relative Strength line, which is the middle pane in the graph above. The dotted arrows indicate three "trends" that are present in this graph. It's a great coincidence that all three are present in the graph on which the question was about.
The first one is a sideways trend/move in November and December 2019. At that time, the RRG Lines remain close together, translating into a short tail on the RRG.
Then, from January to mid-March, the Energy sector really started to underperform the S&P and the RS Line declines strongly, which is picked up by the RRG-Lines that both drop below 100 and start moving wider apart. This translates into a longer tail on the RRG and signals that there is strength (momentum) behind the rotation.
Then, out of the March low, the RS-Line starts to recover, albeit slowly and shallow. The RRG-Lines also pick up this move and crawl back above 100, but they remain closer to the 100-level and to each other, signaling that the trend is not very strong; this again cause a shorter tail to be visible on the RRG.
The vertical dotted line marks 11 June, the date when the question came in and XLE was still moving up inside the leading quadrant.
As you can see, it did not take too much (more) weakness and days for the RRG-Lines to adapt and pick up the weakening developments in the RS-Line. The tail has rotated back into the weakening quadrant - and, as of yesterday (6/22), has even entered the lagging quadrant.
Another way to look at this is by using the tail length and the table below the RRG. The images below show the RRG, including the table with 3-, 9- and 20-day tail lengths.
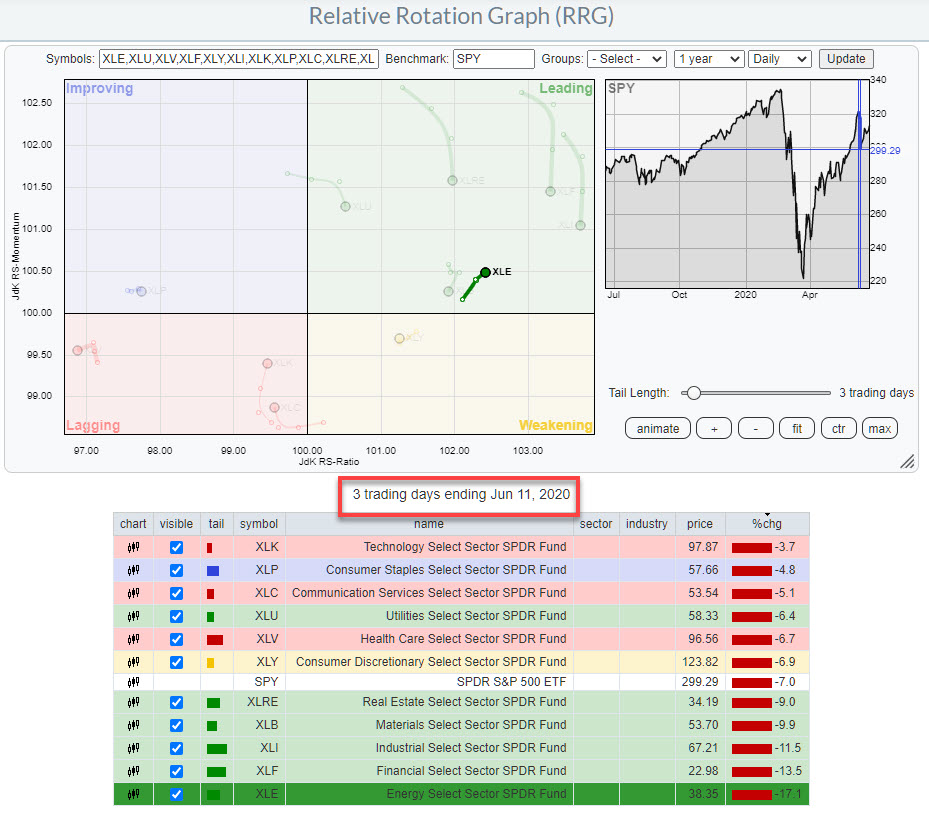
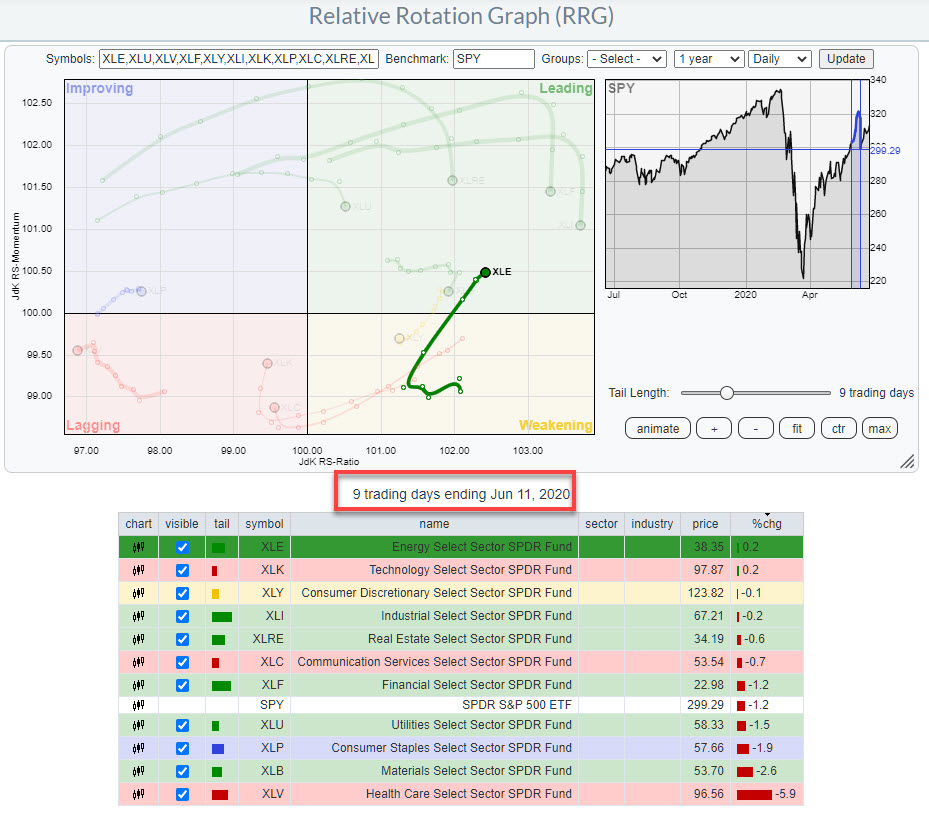
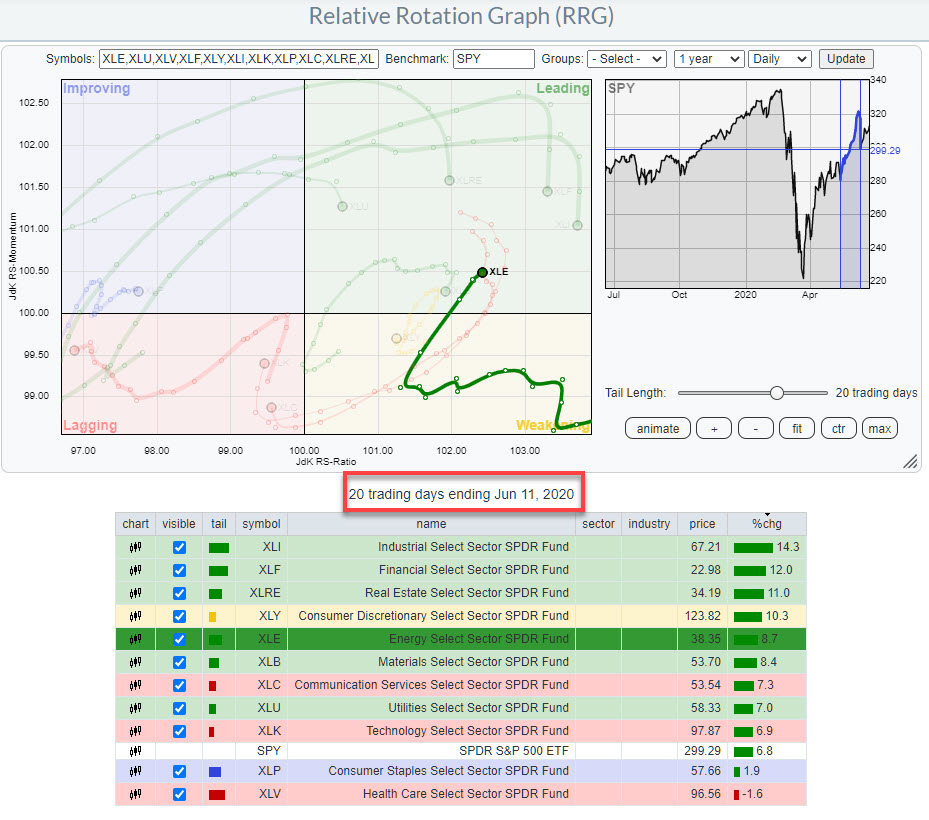
As you can see, the 3-day performance on 11 June was very negative and XLE was at the bottom of the table. But, if you go back 9 days, XLE leads the chart and also, for the 20-day tail, XLE is in the upper half of the universe and well above the benchmark.
As always, the way you look at things can make a big difference. I hope the combination of Dave's explanation in his show and this written article will help you understand the dynamics of the RRG chart a little better.
#StaySafe, --Julius
Julius de Kempenaer
Senior Technical Analyst, StockCharts.com
Creator, Relative Rotation Graphs
Founder, RRG Research
Host of: Sector Spotlight
Please find my handles for social media channels under the Bio below.
Feedback, comments or questions are welcome at Juliusdk@stockcharts.com. I cannot promise to respond to each and every message, but I will certainly read them and, where reasonably possible, use the feedback and comments or answer questions.
To discuss RRG with me on S.C.A.N., tag me using the handle Julius_RRG.
RRG, Relative Rotation Graphs, JdK RS-Ratio, and JdK RS-Momentum are registered trademarks of RRG Research.


