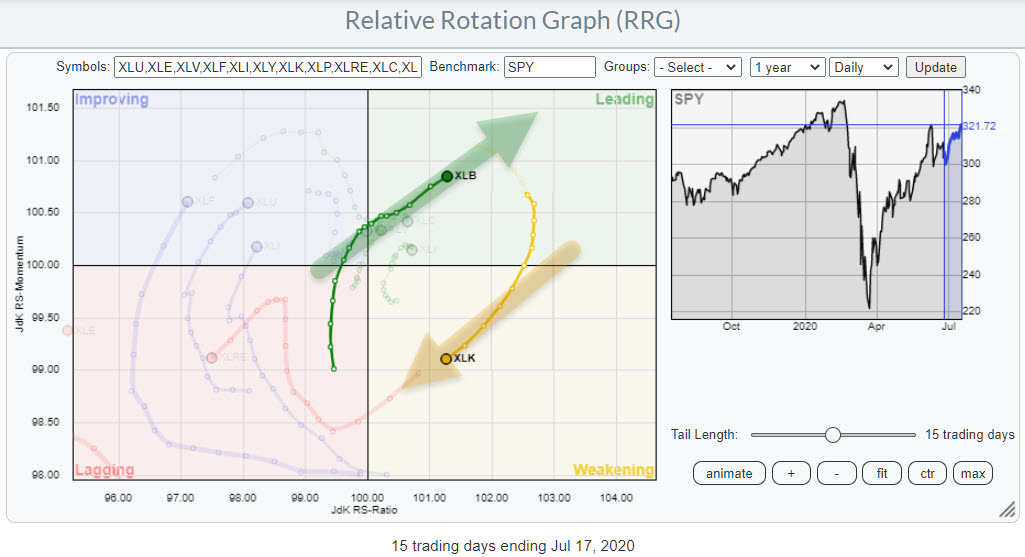
On the weekly Relative Rotation Graph for US sectors, there are five sectors rotating at the right hand side of the graph, either inside the leading quadrant (XLB,XLC,XLK,XLY) or inside the weakening quadrant (XLV). On the daily RRG, it's also only these sectors at the right hand side of the plot, just in a slightly different order. On this time frame, XLK is inside weakening and XLV is inside leading.
As you can see from the highlights in the RRG above, XLB and XLK are now on opposite trajectories, which suggest a preference for Materials stocks over Technology in coming week(s).
Please note that these are daily tails which rotate faster than their weekly equivalents.
For these five sectors, I have stacked their weekly bar charts on top of each other so we can get a proper perspective on the price breakouts that they are showing.

Out of these five sectors, XLK already broke above its resistance 4/5 weeks ago. XLC and XLY broke out last week - see this article (XLY Simultaneously Breaking to New Highs in Price and Relative Strength). This week, XLB and XLV (Materials and Health Care) are breaking above their resistance levels offered by the January/February highs.
The latter two sectors look most interesting to me from a buying perspective at the moment - but for different reasons. I am inclined to avoid Technology for the near term.
The chart below shows the weekly RRG for those sectors.

Technology
Technology is positioned to the far right of the RRG, almost AT the 100 level on the JdK RS-Momentum scale with some un-direction movements over the last few weeks. The daily tail on the RRG at the top of this article shows a clear rotation through weakening and heading towards lagging.
The combination of the weekly tail at high levels going nowhere and the daily tail rotating at a negative trajectory suggests that we are dealing with a temporary loss of (relative) momentum for this sector here. But because of the massive up moves that we have see in this sector recently, even a temporary setback maybe significant, measured in absolute terms.
Health Care
The Health Care sector shows a wide rotation from leading into weakening and now almost into lagging. Looking at the (stacked) bar chart, you can see that XLV was one of the first sectors to recover almost all of its losses after the sharp decline. In April, XLV was already almost back at pre-COVID-19 levels, but then started to stall and therefore lose relative strength as the other sectors continued to catch up.
The upward break of last week will certainly add positive fuel to the Health Care sector in relative terms as well. On the weekly tail, you can see that the RRG-Velocity, the week-to-week distances on the tail, became significantly shorter recently. This is often a preliminary sign for an upcoming turn.
When XLV is able to hold and carry over the strength of last week into this week's price action, a complete rotation at the right hand side of the plot up and into the leading quadrant is certainly possible for XLV. Alternatively, there could a short rotation through lagging, going almost immediately back upward. I am watching for support around $103-$104 to hold.
Materials

The materials sector shows an almost horizontal tail on the weekly RRG. This implies a stable (relative) uptrend with no positive momentum pushing it higher but also no negative momentum slowing it down; just gradually moving higher.
A look at the chart of XLB above, in combination with Relative Strength and the RRG lines, shows the process of relative strength turning around after a two-year down trend. The low in RS was set late March. After that, the RS-Line started to gradually ease up and move sideways after testing former support as resistance. The higher lows during that period indicate upward pressure, and last week that upward pressure translated into a break above that horizontal barrier fueled by the break on the price chart.
On the weekly RRG and RRG-Lines, that sideways move in relative strength has caused JdK RS-Momentum to go flat, but not down, while the daily version of that chart shows both RRG-Lines moving higher and above 100 in tandem, pushing the sector further into the leading quadrant. You can see this on the RRG at the top of this article.
Assuming that this daily rotation will continue a bit more, I expect the weekly tail to pick up on the RS-Momentum scale as well, pushing XLB further into the leading quadrant on the weekly RRG as well.
#StaySafe, --Julius
Julius de Kempenaer
Senior Technical Analyst, StockCharts.com
Creator, Relative Rotation Graphs
Founder, RRG Research
Host of: Sector Spotlight
Please find my handles for social media channels under the Bio below.
Feedback, comments or questions are welcome at Juliusdk@stockcharts.com. I cannot promise to respond to each and every message, but I will certainly read them and, where reasonably possible, use the feedback and comments or answer questions.
To discuss RRG with me on S.C.A.N., tag me using the handle Julius_RRG.
RRG, Relative Rotation Graphs, JdK RS-Ratio, and JdK RS-Momentum are registered trademarks of RRG Research.


