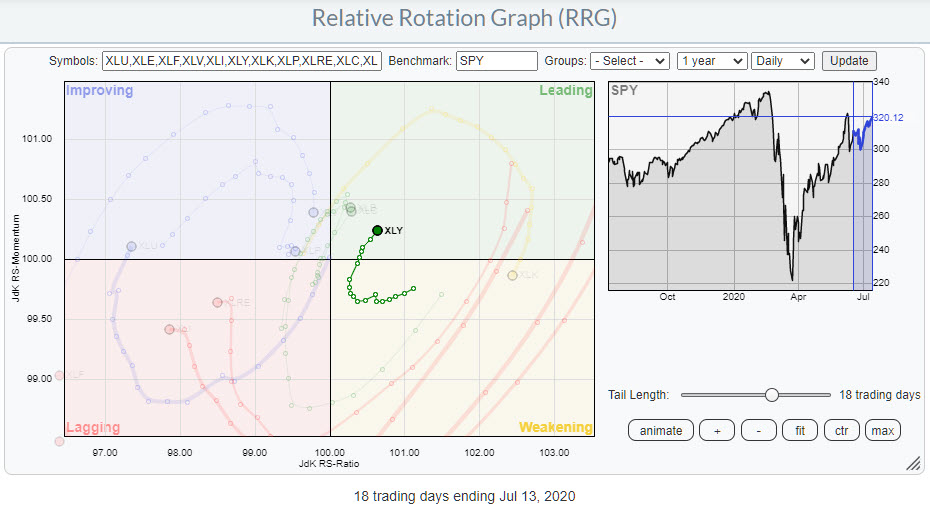
On the daily Relative Rotation Graph for US sectors, the Consumer Discretionary sector rotated back into the leading quadrant last week, coming up from weakening. Generally, this is a positive/strong rotation as it reflects the second (or third, etc.) leg within a relative uptrend that is already underway.
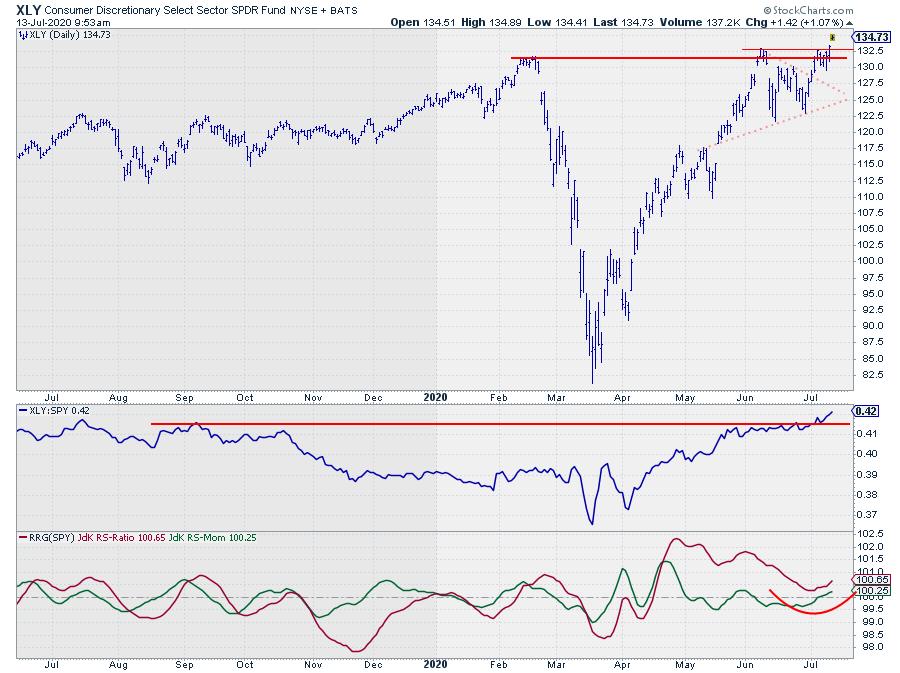
Looking at the underlying price chart for XLY, we can see that the sector stalled against overhead resistance in the area between $130-$132.50 at the start of June, then consolidated sideways in a triangle-like formation.
At the start of July, XLY managed to get out of that consolidation to the upside and once again stalled around $132.50. After another few days of slightly declining consolidation (flag?), the price managed to close above resistance last Friday at $133.30. The opening (breakaway) gap this morning confirms the underlying strength for the sector at the moment.
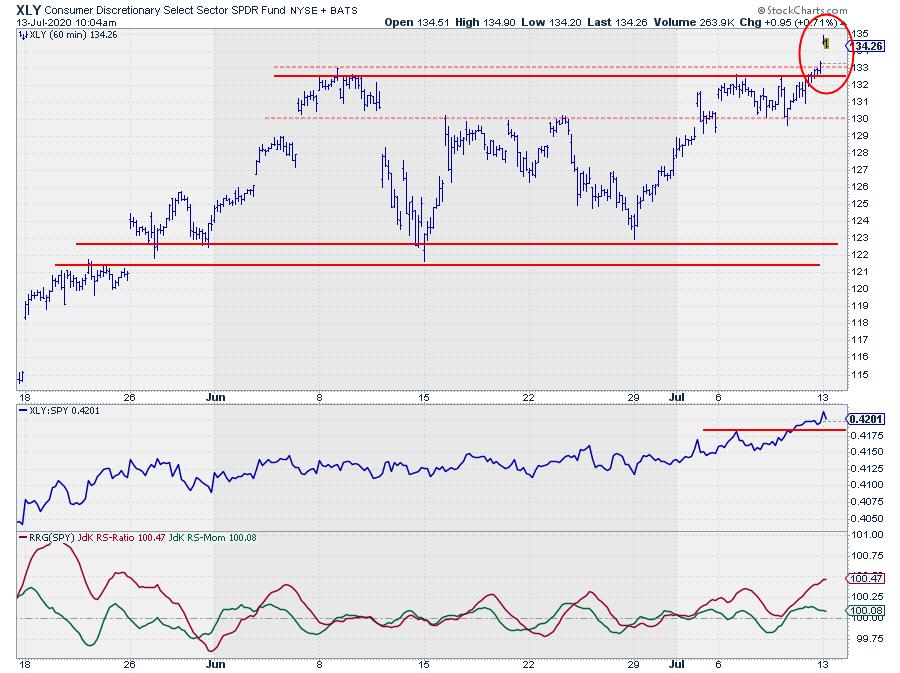
The hourly chart for XLY shows this price and relative action in more detail.
In order to keep up the current strength and maintain positive rotation, XLY should hold up above the breakout area, which should start to act as support now in case of any setbacks. This goes for both price and Relative Strength.
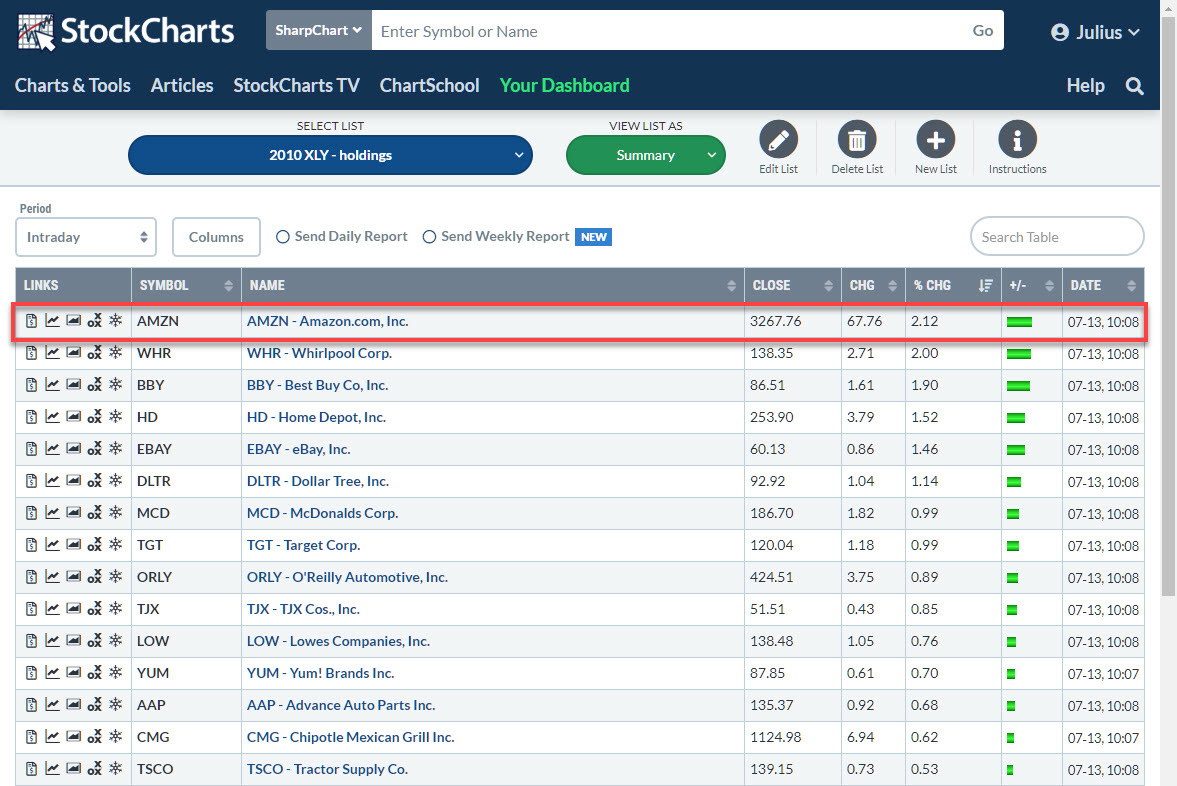
As you can see in the table below (snapshot 7/13 10:10 am ET), the driver for this rally is once again AMZN, the Consumer Discretionary heavyweight.
However, an inspection of the (daily) RRG for the members of the Discretionary sector shows a rotational picture where AMZN is inside the leading quadrant but slowly dropping on the JdK RS-Momentum scale while still adding a bit of relative strength.
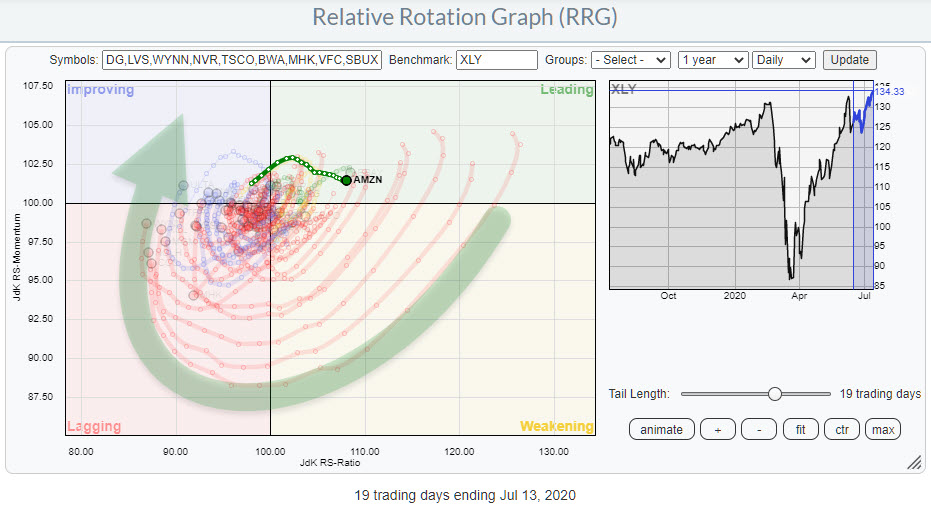
Opposite the AMZN tail, there is a whole heap of stocks that have started to curl upward and move up towards the improving quadrant. This is where the momentum is building/picking up; while AMZN is still strong (don't get me wrong), others are rapidly catching up and could possible overtake it in the coming weeks.
That is also the subject of an article that I wrote recently on the rotation of AMZN and its impact on the Consumer Discretionary sector, making a comparison with its equal-weight counterpart RCD. Read it here: AMZN Move Over Please ... Coming Through
All in all, the outlook for the Consumer Discretionary sector (XLY), including AMZN, is positive.
#StaySafe, --Julius
Julius de Kempenaer
Senior Technical Analyst, StockCharts.com
Creator, Relative Rotation Graphs
Founder, RRG Research
Host of: Sector Spotlight
Please find my handles for social media channels under the Bio below.
Feedback, comments or questions are welcome at Juliusdk@stockcharts.com. I cannot promise to respond to each and every message, but I will certainly read them and, where reasonably possible, use the feedback and comments or answer questions.
To discuss RRG with me on S.C.A.N., tag me using the handle Julius_RRG.
RRG, Relative Rotation Graphs, JdK RS-Ratio, and JdK RS-Momentum are registered trademarks of RRG Research.


