
One of the ratios that a lot of market watchers and commentators look at is the relationship between Consumer Staples and Consumer Discretionary stocks. The assumption or rationale behind watching this pair is that Consumer Discretionary stocks usually do well in a rising market (SPY), while Consumer Staples stocks tend to do better in a weak market environment.
Thus, when Discretionary (XLY) starts to (or is) outperforming Staples (XLP), that is seen as positive for the S&P and the other way around.
Personally, I believe that this specific ratio has lost a little bit of its value, as it is strongly dominated by the performance of AMZN, which makes up around 25% of the Discretionary sector. I wrote about this in a blog article back in April: How One Stock is Holding up an Entire Sector.
In that article, I also suggested bringing the equal-weight sectors into the mix to potentially get a better, or more realistic, handle on the relationship between Discretionary and Staples stocks.
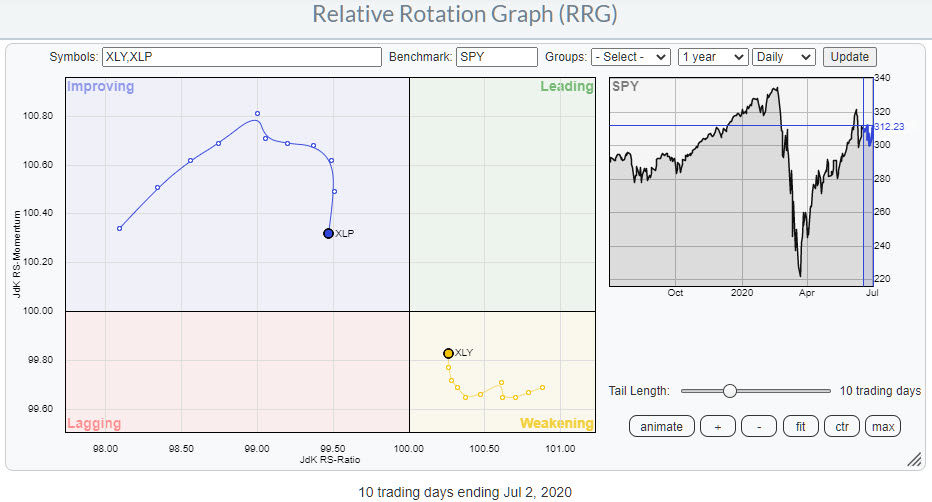
Looking at the daily Rotation Graph for US sectors at the end of this week, we can see the Staples sector inside the improving quadrant, but rolling over and rotating back down to lagging. Meanwhile, Discretionary is positioned inside weakening and curling back up towards leading.
Equal-Weight Instead of Market-Cap Weight
To eliminate, or at least minimize, the AMZN effect in this rotation, I added RHS and RCD, the equal-weight versions of XLP and XLY, to this RRG.
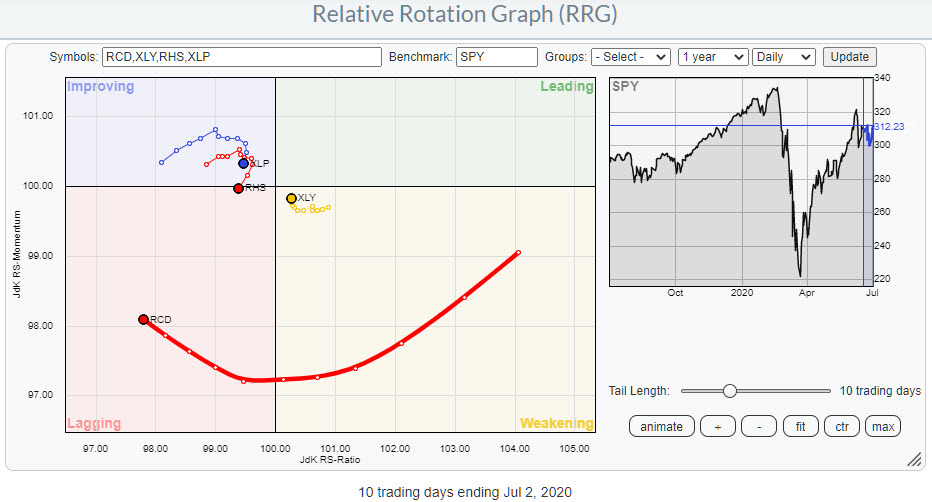
What we see now is that XLP and RHS (Staples) are showing a closely correlated rotation. XLY and RCD (Discretionary), on the other hand, are wide apart.
The good news, however, is that the rotation of RCD is a magnified version of XLY; both tails are tracing out a similar pattern. They both started to curl up a few days ago. RCD is still moving lower on the JdK RS-Ratio scale, while XLY has already made the turn around the corner and into 0-90 degrees.
All in all, things seem to be improving for the Discretionary sector.
Another interesting twist/angle can be created when we change the benchmark for this RRG from SPY to RSP, the equal-weight S&P 500.
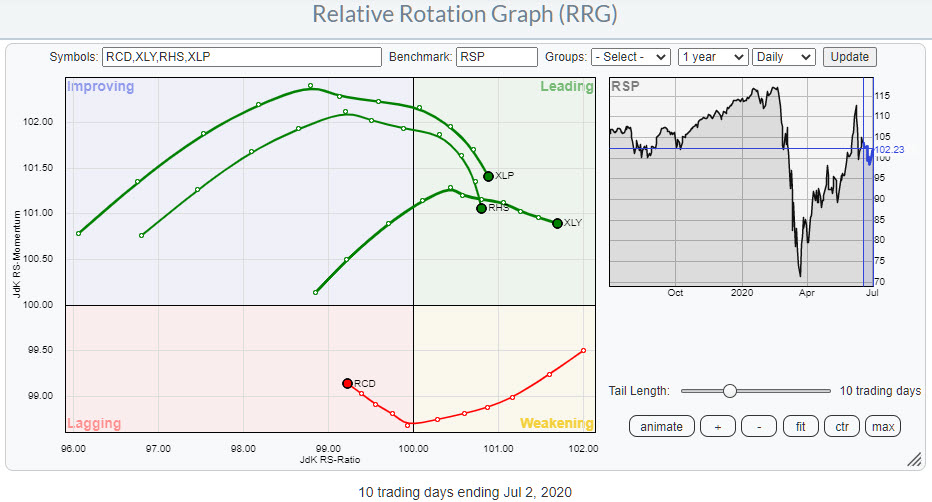
The rotation between Staples and Discretionary stocks is now becoming even more pronounced. Staples, represented by XLP and RSP, is inside improving, but is clearly rolling over and losing relative momentum. The broader, equal weight, discretionary sector is inside lagging but curling upward.
AMZN Leadership Fading
If we then change this RRG to a weekly version to get a slightly longer perspective, we see this:
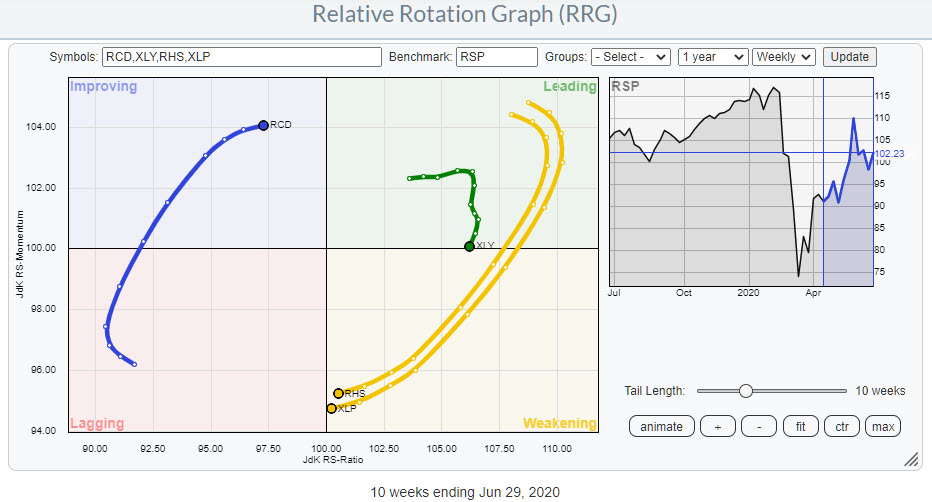
Both Staples ETFs are about to hit the lagging quadrant while RCD is approaching the leading quadrant. This rotation perfectly lines up with the rotations seen on the daily RRG.
What is notable to see on both the daily and the weekly RRGs is the disconnect between XLY and RCD; they are almost moving opposite to each other. These opposing rotations lead to the conclusion that AMZN is losing its leadership. And this is exactly what you see when you open up the RRG for the stocks inside the Consumer Discretionary sector.
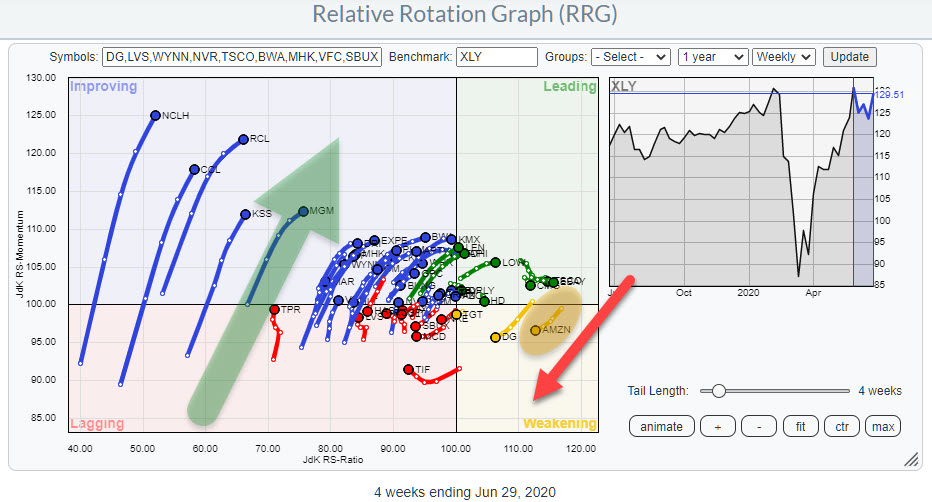
AMZN is positioned inside the weakening quadrant and heading towards lagging, while a whole contingent of stocks are rotating inside the improving quadrant and heading for leading.
All in all, it looks like the positive rotation for the discretionary sector is getting a broader participation which, I think, is good news, as it means that the inherent single-stock risk for this sector is now getting lower.
And, based on the assumption that a rising Discretionary/Staples ratio is supportive for the general market, it is sending a bullish signals for SPY as well.
#StaySafe, --Julius
My regular blog is the RRG Charts blog. If you would like to receive a notification when a new article is published there, simply "Subscribe" with your email address.
Julius de Kempenaer
Senior Technical Analyst, StockCharts.com
Creator, Relative Rotation Graphs
Founder, RRG Research
Host of: Sector Spotlight
Please find my handles for social media channels under the Bio below.
Feedback, comments or questions are welcome at Juliusdk@stockcharts.com. I cannot promise to respond to each and every message, but I will certainly read them and, where reasonably possible, use the feedback and comments or answer questions.
To discuss RRG with me on S.C.A.N., tag me using the handle Julius_RRG.
RRG, Relative Rotation Graphs, JdK RS-Ratio, and JdK RS-Momentum are registered trademarks of RRG Research.


