Happy New Year!!!
Those of you who watch my weekly show Sector Spotlight on StockCharts TV will know that, towards the end of every month, I look at the seasonality for sectors going into the new month and then try to combine that with the actual rotations that are taking shape on the Relative Rotation Graph.
With the holiday season, the transition into the new year and no (semi) live shows for Sector Spotlight in the later part of December, I will therefore write up my observations in this article.
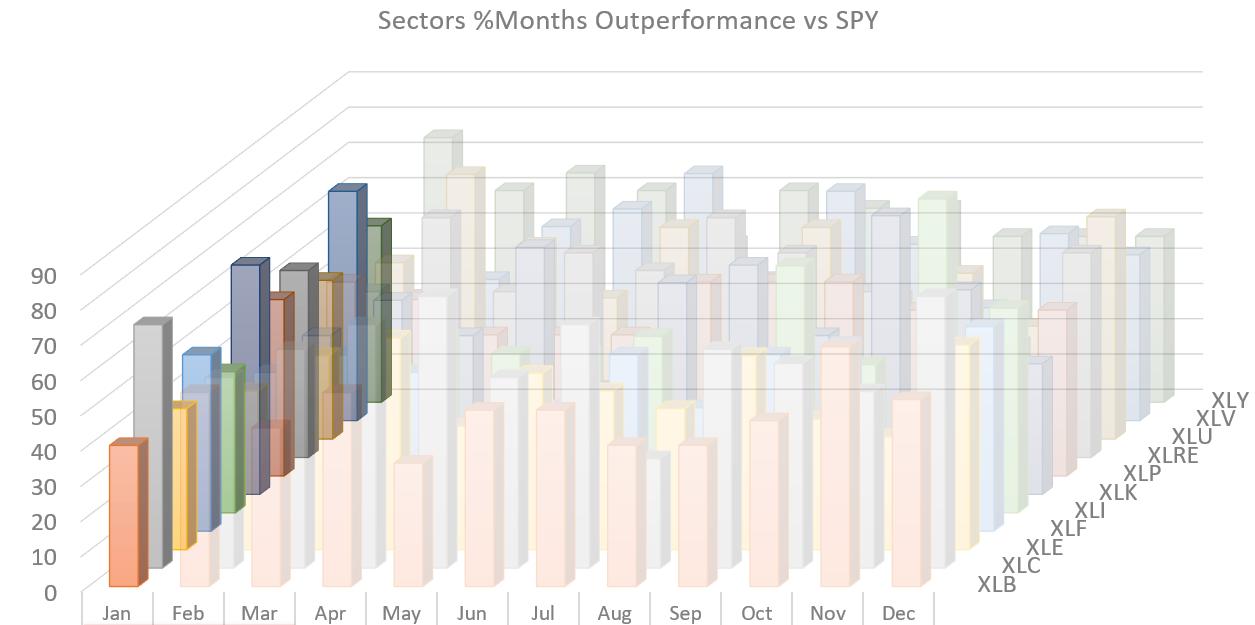
The image above shows the average outperformance per sector against SPY over the last 20 years in percentages. So the 40 for XLB in January means that the Materials sector has outperformed SPY 40% of the time in January. Or, in other words, has UNDERperformed SPY 60% of the time.
Now please be aware that seasonality is no exact science and should not be treated as such. But it does give helpful information on the general (relative) performance of sectors throughout the year, which can benefit us as another piece of the puzzle that we need to solve.
What I particularly like about seasonality is the forward-looking aspect of it which we do not get from our usual technical tools. Including a monthly seasonality segment in Sector Spotlight has also made me realize that it is probably better to look ahead for 2, maybe 3 periods, instead of just looking at the next month. These seasonal patterns are indeed seasonal and not really tied to a specific month.
Sometimes a move starts early and ends early, or the other way around. So, going forward, I am planning to peek slightly further ahead and try to see if I can gauge a bit of a "trend" in the seasonal data, looking beyond the next month.
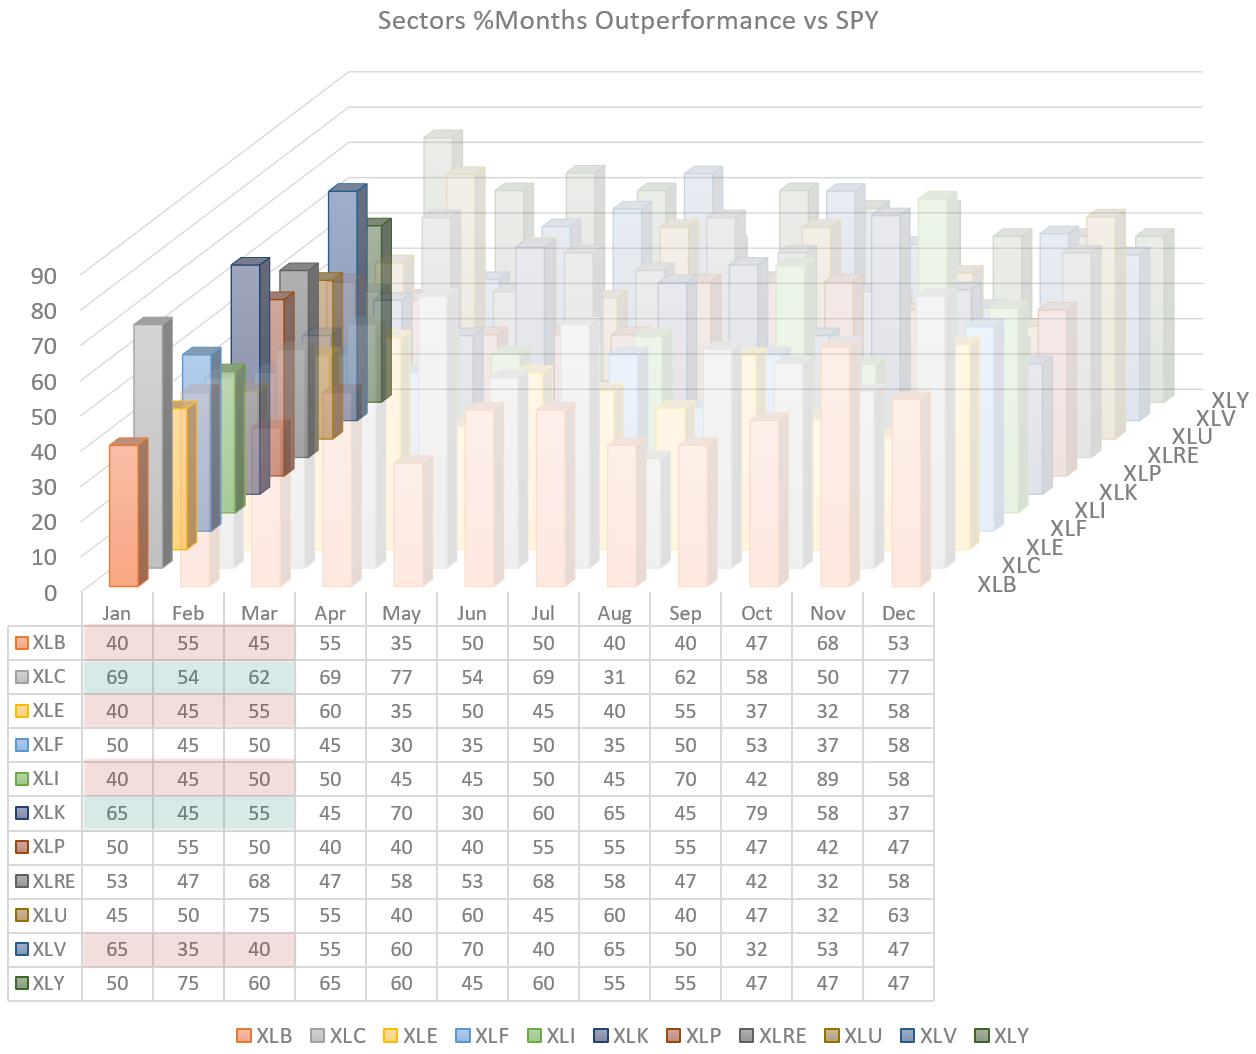
The 3D-seasonality chart above shows the data for the entire year and highlights the month of January. XLC, XLK and XLV are showing the highest numbers at 69%, 65% and 65%. Not extremely strong and clear, but well above flipping a coin. XLB, XLI, and XLE are the lowest at 40%; they are also not particularly strong in terms of reliability.
To get a better sense of what can be expected over the course of the next three months, I have shaded the numbers for the sectors 3 periods ahead.
Materials - XLB
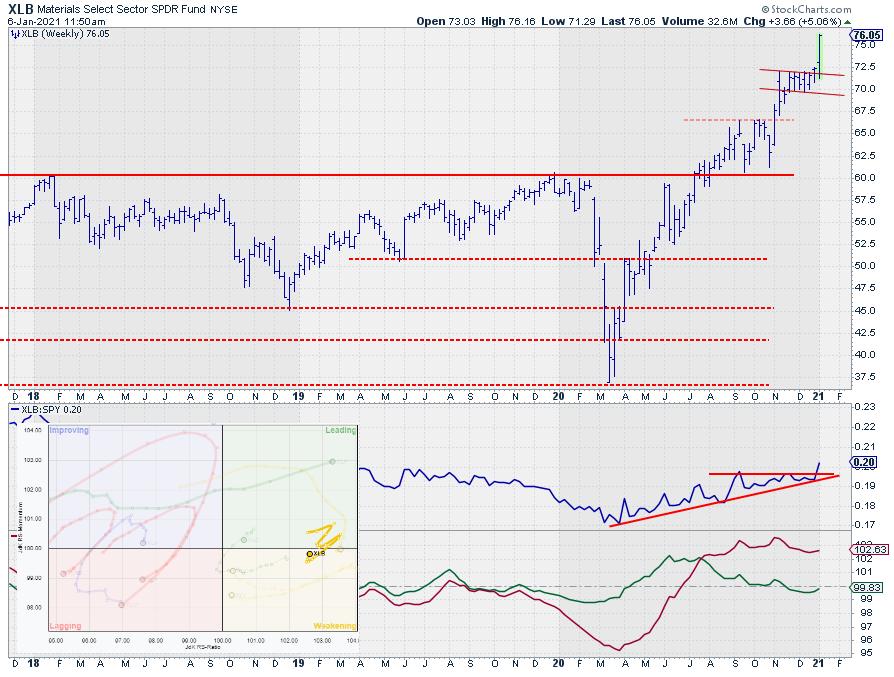
Based on seasonality, XLB should be one of the weaker performers in January, followed by indecisive numbers for Feb and March. However, looking at the price chart in combination with the position of the XLB tail on the RRG chart makes me very reluctant to see XLB as an underperformer in coming weeks.
Industrials - XLI
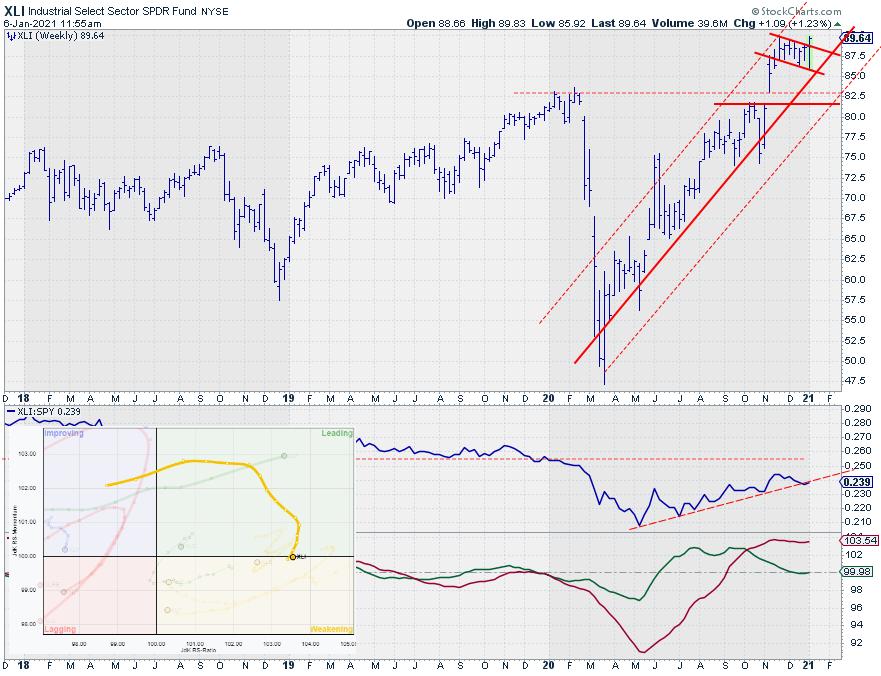
The Industrials chart is telling a similar story. Based on seasonality, there is no clear trend, maybe some underperformance in January but undecided after that. And, here also, the price chart and the positioning of the tail on the RRG are suggesting a pretty bullish outlook going forward.
Price seems to be breaking out of a small consolidation pattern inside the rising channel, while the tail is far to the right, highest on the RS-Ratio scale actually. The recent loss of relative momentum after rolling over indie leading is now also losing power, according to the declining RRG-Velocity (the distances between the observations on the tail).
Again, not a very likely underperformer in the coming weeks/months.
Energy - XLE
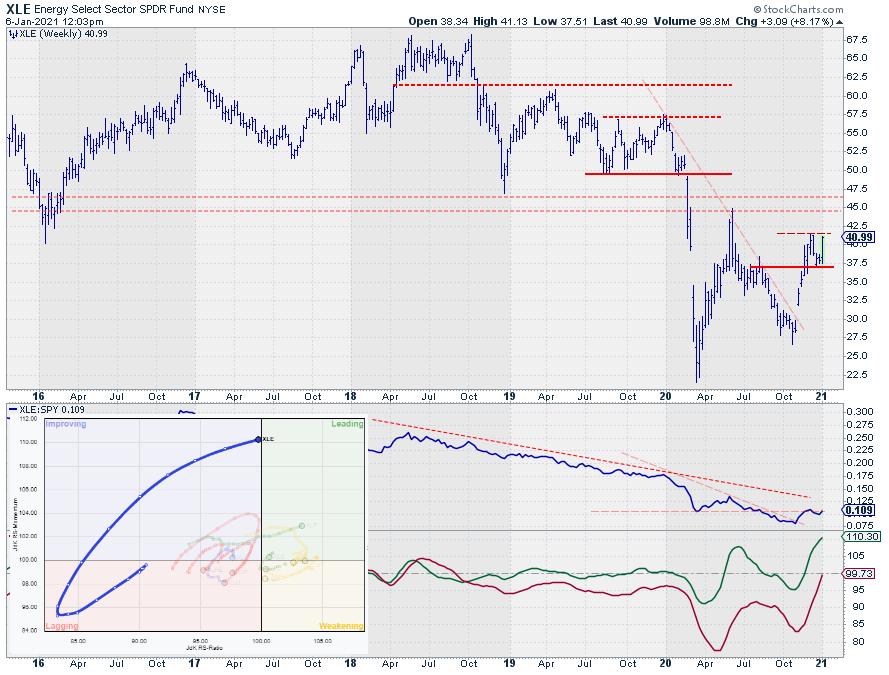
For the Energy sector, the seasonal behavior seems to be out of whack. The sector was performing very badly after the sharp increase from March to June, but started to rally again after the early November low. The turn back up on the XLE tail while deep inside the lagging quadrant occurred in the first week of November and has been pretty strong since then.
All in all, I find this sector (rotation) hard to read at the moment. Both the price and the relative charts are showing early signs of the reversal of the long-standing downtrends in both, with the tail moving into the leading quadrant but leveling off in terms of RS-Momentum, while seasonality is showing weak to indecisive figures. So no clear call here.
Communication Services - XLC
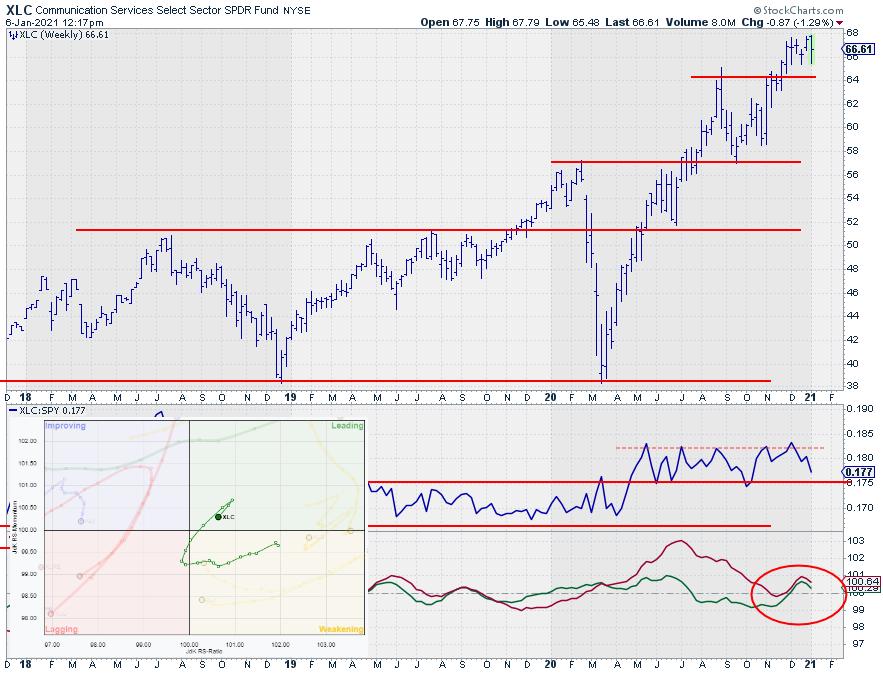
XLC is a sector that shows a high percentage of outperformance in January, but it also showed that for December. And, in December, the month indeed started off really well for XLC, but things started to turn around halfway through. This one of these situations where I think the period of outperformance started early, sometime in October, and ended early. Although the chart and the rotation on the RRG are not looking extremely bad or weak, XLC seems to have trouble taking out its recent high and is now losing some relative strength, causing the tail to turn down inside leading.
For Feb and March, the numbers are indecisive, but, after that, the odds are increasing. So if this indeed is a shifted seasonal pattern, we must keep an eye on the rotation of XLC and pay attention when the tail starts to curl back up and start moving into 0-90 degree RRG-Heading in coming weeks/months.
Information Technology - XLK
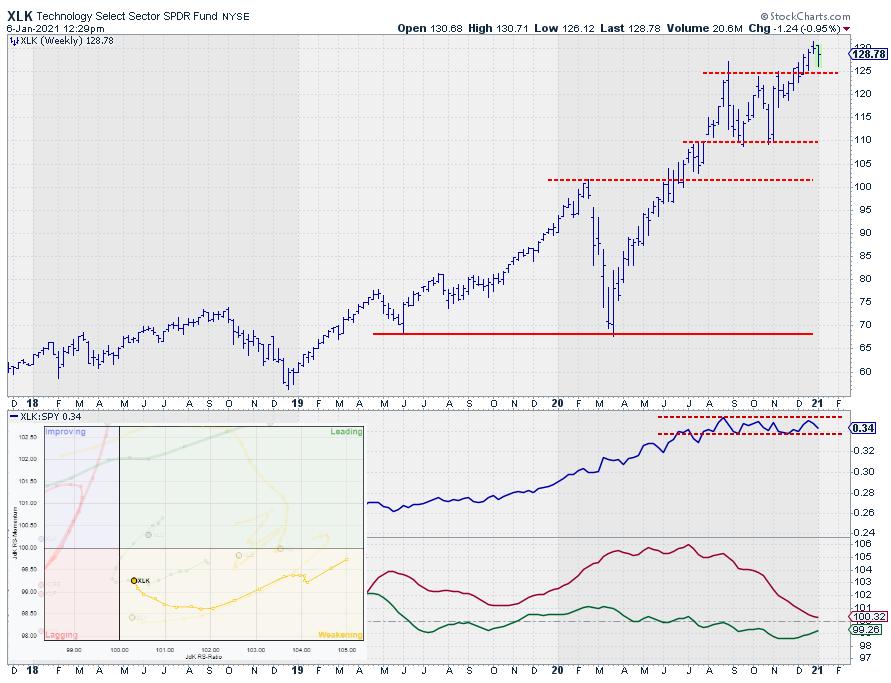
The outlook for December was weak at 37% and, in the first two weeks of December, XLK shows a flat performance vs. SPY but started to pick up again towards the end of the year.
If we take a look at the RS-Line in the chart above, it is very clear that it is moving in a range for a few months already, hence no clear trend against SPY. Especially with Feb and March at 45% and 55%, I am going to take the 65% for January with a grain of salt, especially also because of the current sideways move for XLK vs SPY.
The gradual move back up on the RS-Momentum scale while the tail is inside weakening suggests that another leg up might be underway, but that will only be confirmed when the RS-Line can break out of that range in an upward direction.
Health Care - XLV
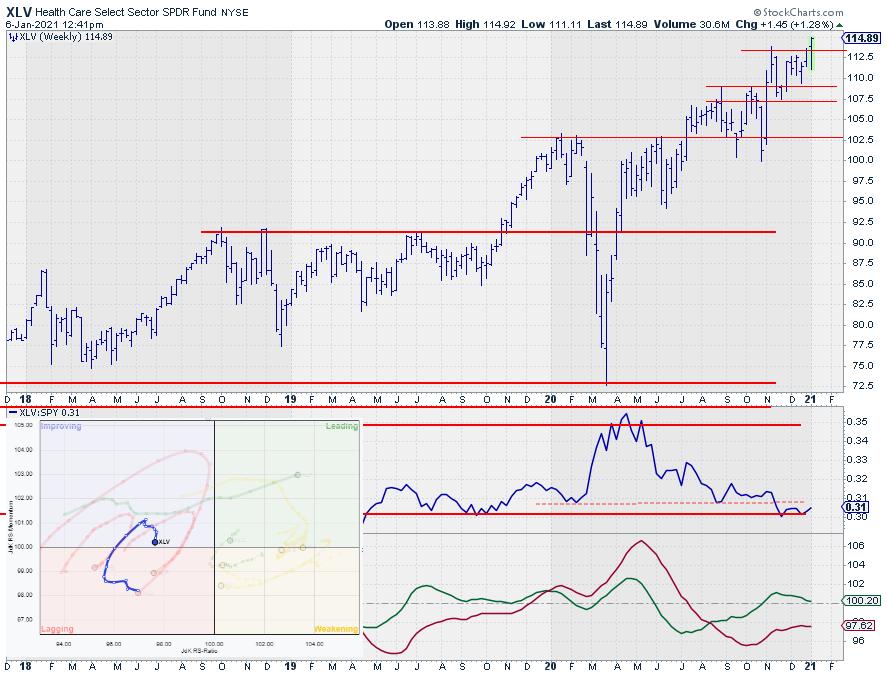
The seasonality reading for Health Care in January is pretty high at 65%. In the first few days of trading so far, this is not yet playing out. BUT! This could be a delayed move.
The current break to new highs is certainly a positive while the RS-Line seems to be putting in a low against a long-term support level. The tail on the RRG is still positioned at the left side of the chart and moving lower towards lagging, but the length of the tail is shrinking rapidly, indicating a loss of power for this move. This can result in a stable position close to 100 on RS-Momentum at the left hand side, which means a stable/gradual relative downtrend.
However, when the improvement of Relative Strength continues - and will be fueled by a rally after the break on the price chart - this rotation can complete clockwise and get the tail back on track towards the leading quadrant. This will surely need some time, but, with seasonality at 65%, I am watching XLV towards the second half of the month. With Feb and March at 35% and 40% seasonality it will very likely be a short-lived move of outperformance.
All in all, there are no very clear seasonal signals at the moment and nothing is nicely matching up with the current rotations on the RRG; maybe XLV, but even that is not super convincing.
So the conclusion for now is that our focus must be with the Reality that rules!
Stay tuned as we will continue to monitor these seasonal patterns either in Sector Spotlight or in this blog.
Many of you already have asked and received the spreadsheet that drives the 3-D visualisation of seasonality. Over the holiday, I have updated that sheet will all the new data that came in during the last year, and it is now completely up-to-date again.
If you have ever received this sheet, you will receive the updated version later this week. If you do not have it yet but would like to have a copy, just drop me an email and I'll be happy to include you!
#StaySafe, --Julius
Julius de Kempenaer
Senior Technical Analyst, StockCharts.com
Creator, Relative Rotation Graphs
Founder, RRG Research
Host of: Sector Spotlight
Please find my handles for social media channels under the Bio below.
Feedback, comments or questions are welcome at Juliusdk@stockcharts.com. I cannot promise to respond to each and every message, but I will certainly read them and, where reasonably possible, use the feedback and comments or answer questions.
To discuss RRG with me on S.C.A.N., tag me using the handle Julius_RRG.
RRG, Relative Rotation Graphs, JdK RS-Ratio, and JdK RS-Momentum are registered trademarks of RRG Research.


