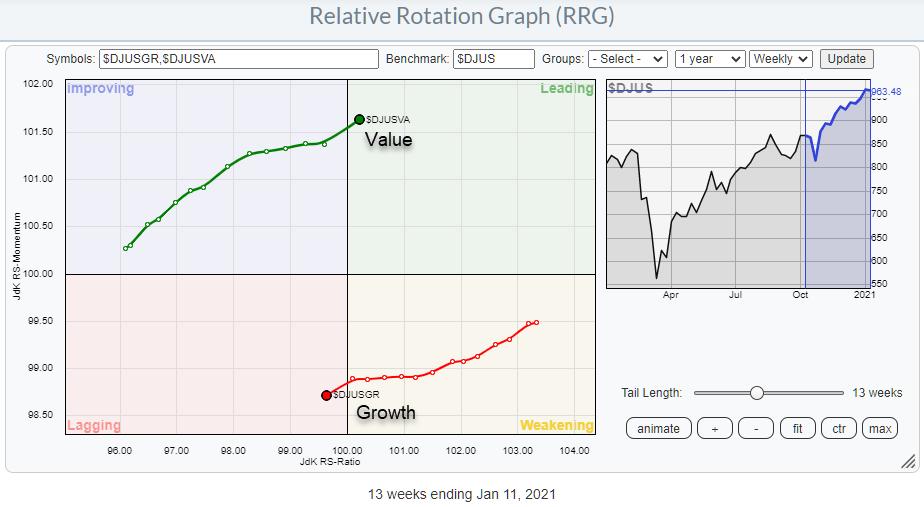
This week, the tails for Growth and Value are crossing over. Value is moving into the leading quadrant while Growth crosses from weakening into lagging.
This rotation has been going on for quite some time already and was picked up by the RRG Lines and the rotation of the tails on the Relative Rotation Graph itself around the end of May/start of June. The tail for Growth was inside the leading quadrant at that time, but started to roll over and move towards weakening while Value, at the time, was inside lagging but started to curl upward and move towards the improving quadrant.
Over the last 13 weeks, this rotation continued and picked up steam, resulting in the crossing over to the other side of the RRG as mentioned above.
Growth
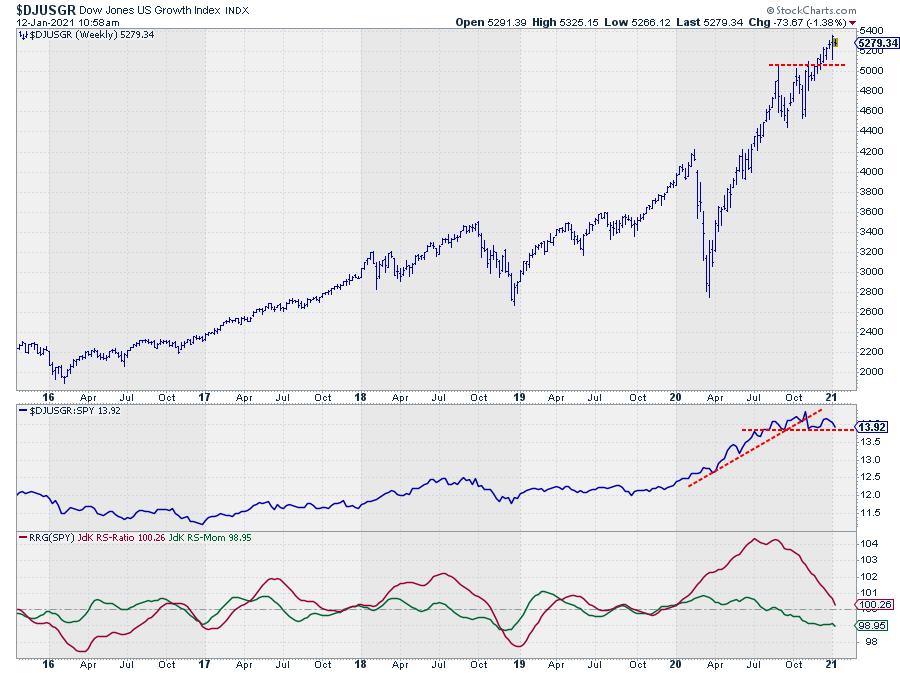
The chart of the Dow Jones US Growth index does not look too bad at all when just viewed by itself. The "problem" arises when you look at the relative strength of this index vs. SPY, as shown in the middle pane.
The rally in relative strength leveled off a few months ago and started to move sideways. This loss of relative momentum has then caused the RRG-Lines to turn around and head lower. The Jdk RS-Momentum line already crossed below 100 in August, and now JdK RS-Ratio is on the verge of breaking below that barrier too, positioning the Growth stocks inside the lagging quadrant.
Value
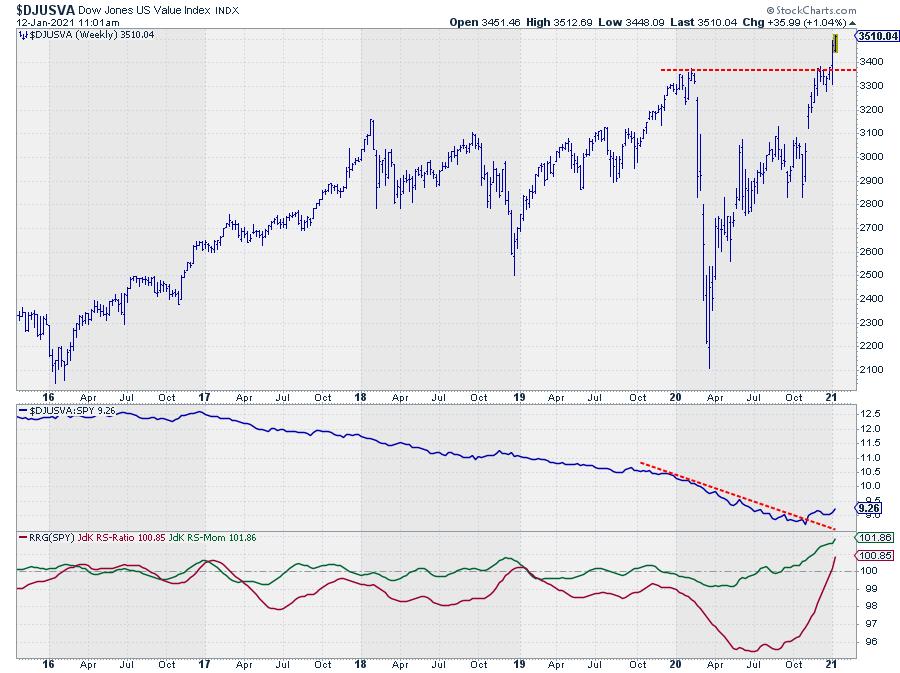
The chart for the DJ US-Value index looks quite different. Where Growth already moved beyond its February 2020 peak, Value has only just managed to do that. For the last 5-6 weeks, that early 2020 peak provided plenty of resistance for Value stocks.
However, now that this barrier has been cleared, there is renewed upside potential for this group of stocks.
Value / Growth
The magnitude of this turnaround can be seen even better when we put the two against each other in a 1-1 graph.
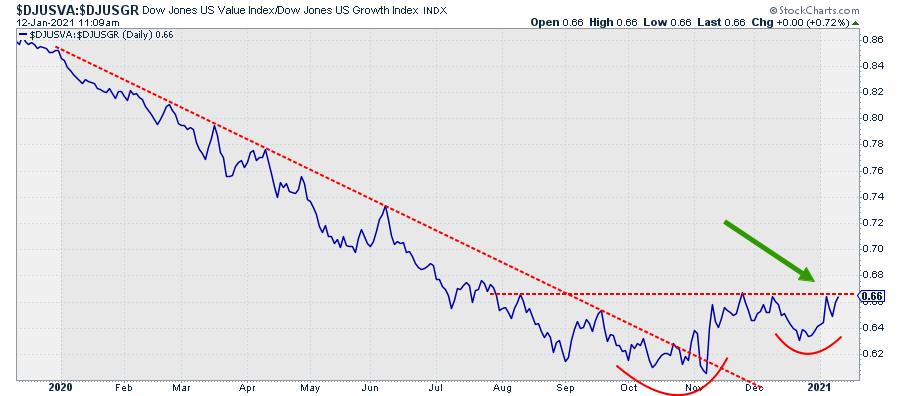
This daily chart shows the last year of a multi-year downtrend in more detail. Things started to improve in November, when this ratio stopped making new lows and eventually broke above its long-term falling resistance. After peaking late November and early December, a new higher low was put into place at the end of the month.
Currently, the relative strength line is pushing against this horizontal resistance level. Once broken upwardly, expect a further rally in favor of Value over Growth and a further push into the leading quadrant for value and vv into the lagging quadrant for growth.
How To Play
There are plenty of ETFs that track either Value or Growth stocks, which can all be used to put on positions that create exposure to these groups of stocks, either long or short.
A good trick to see if a particular ETF "matches" or tracks the performance of the indexes used in the analysis is to simply add them to the RRG and compare the rotation of the tails.
Two ETFs that are widely used and known are IVE and IVW managed by iShares. The RRG below shows the rotation of these ETFs in combination with the indexes.
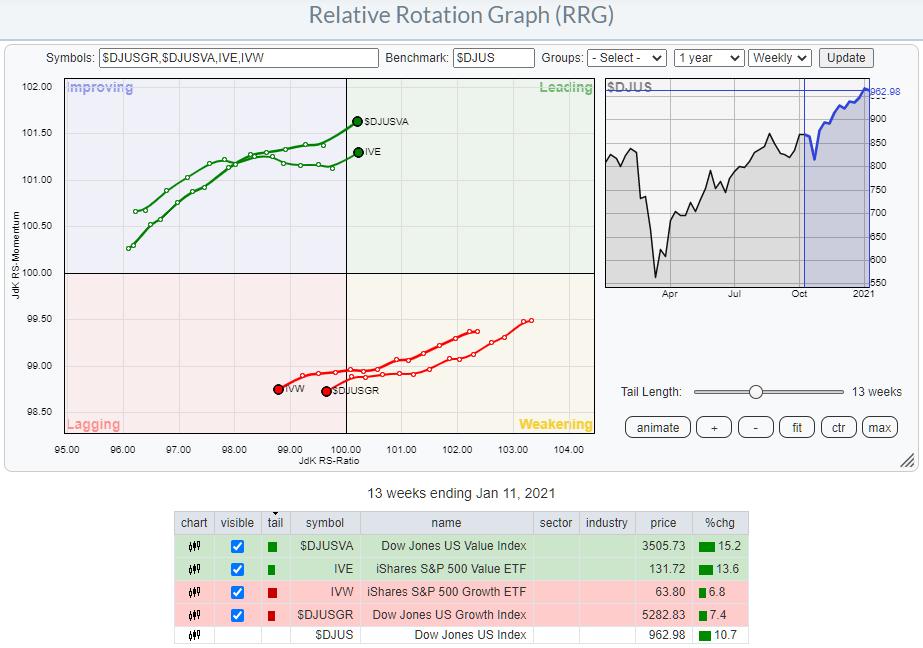
The rotation and the shape of these tails are largely alike, which makes them good proxies to "play" the rotation between these groups.
IVE and IVW, along with many other ETFs, also have options traded on them, which allows you to put together pretty sophisticated combinations to acquire a position that reflects your view and ideas. Particularly when you are not set up to sell stocks short in your account, options can help you to create a negative (short) exposure.
Following the reasoning above, we would need a long exposure to Value (IVE). This can be easily achieved by just buying the ETF.
A short exposure to growth (IVW) could be achieved by creating a "synthetic" short position on IVW. This is a strategy where you'd BUY At-The-Money Puts, say $64 at the moment and at the same time SELL ATM Calls. The cash outlay for such a position will be minimal, but you will need to hold enough margin to cover the short Put position, which you also would need to do when outright selling short.
#StaySafe, --Julius
Julius de Kempenaer
Senior Technical Analyst, StockCharts.com
Creator, Relative Rotation Graphs
Founder, RRG Research
Host of: Sector Spotlight
Please find my handles for social media channels under the Bio below.
Feedback, comments or questions are welcome at Juliusdk@stockcharts.com. I cannot promise to respond to each and every message, but I will certainly read them and, where reasonably possible, use the feedback and comments or answer questions.
To discuss RRG with me on S.C.A.N., tag me using the handle Julius_RRG.
RRG, Relative Rotation Graphs, JdK RS-Ratio, and JdK RS-Momentum are registered trademarks of RRG Research.


