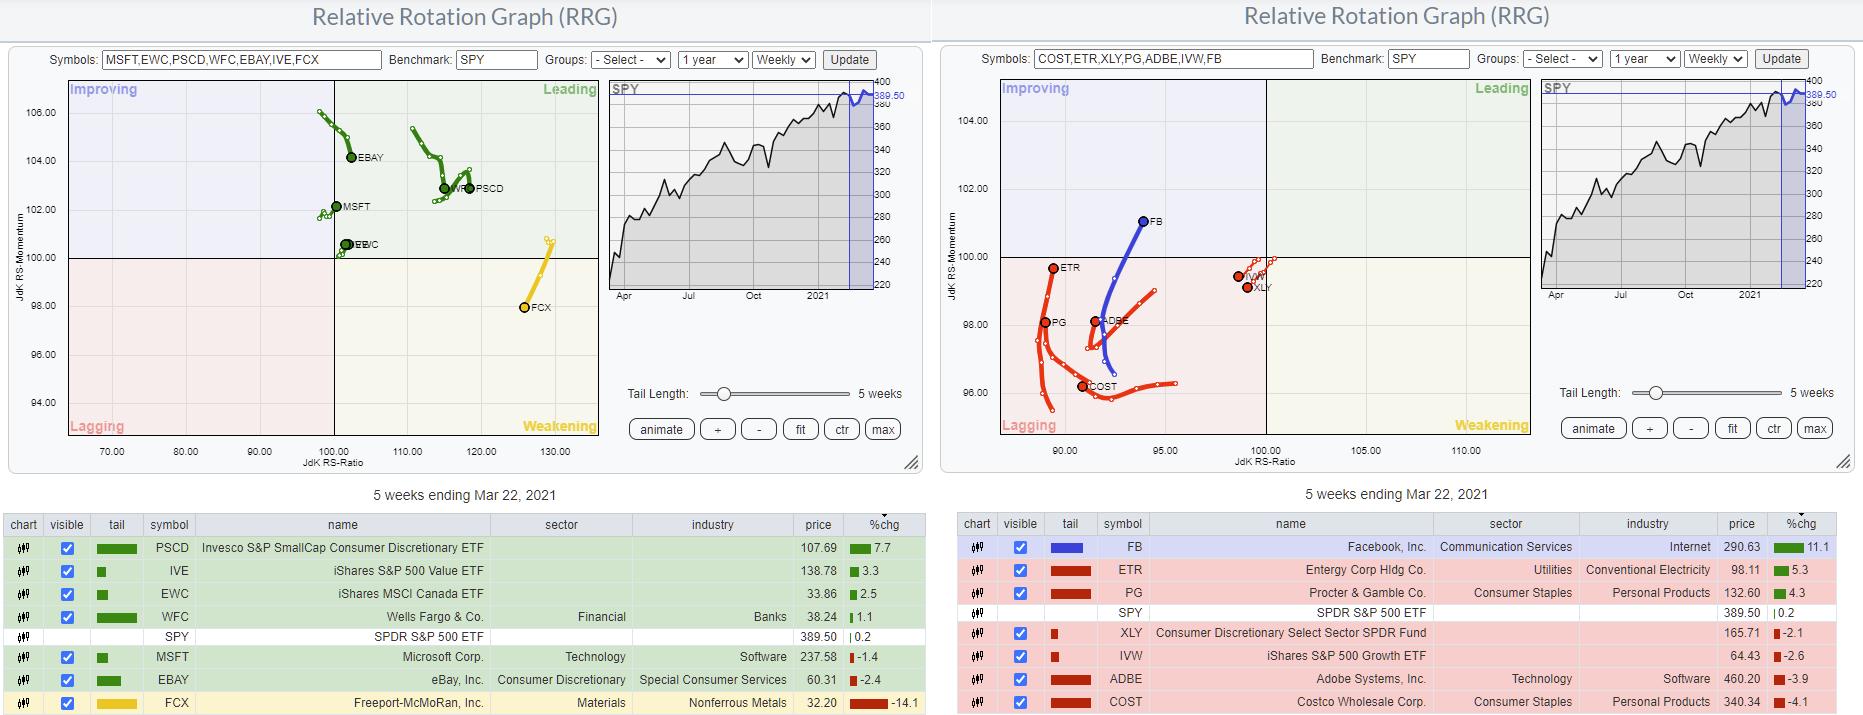
The two RRGs above show the long positions in the RRG L/S basket on the left and the short positions on the right. Going over these rotations, combined with the recent performance (dropping around 4% in a few days), two tails stood out.
On the long side, we have FCX and FB; on the short, FB.
Removing
FCX - Freeport-McMoRan Inc
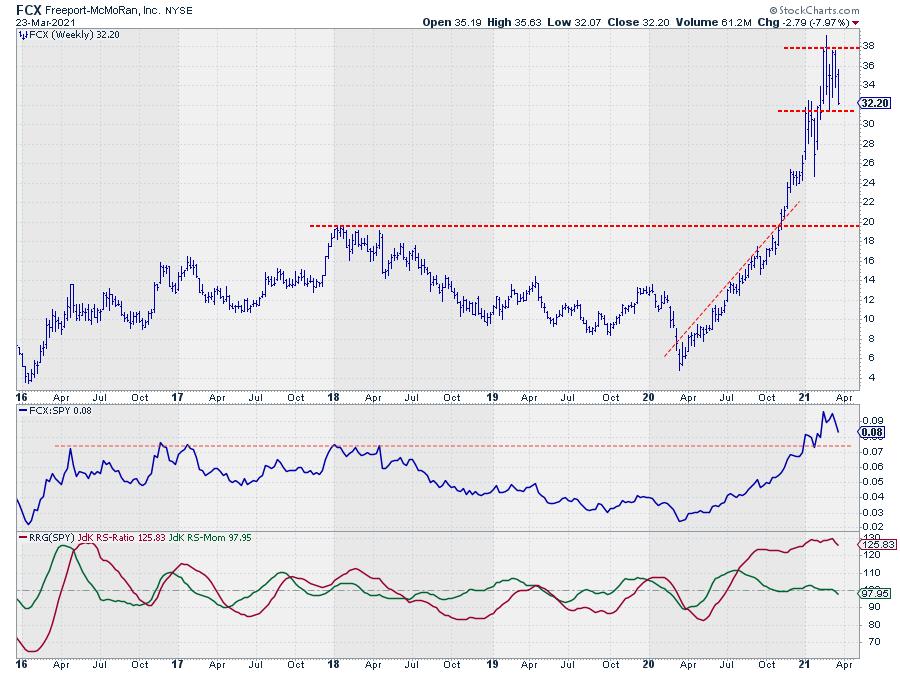
FCX has been one of the better-performing and contributing positions -- and to be honest, the long-term trend still looks good. However, on the price chart, $38 is developing as a more serious resistance level, and we're close to breaking below ~$31, which means the completion of a double top on the weekly chart. Combining that with an over-stretched RS-line and an RS-Ratio at extremely high-levels, a corrective move is beginning to become more likely. At a sector level, materials are now heading towards the lagging quadrant and ready to cross over.
All in all, enough reasons to remove FCX from the basket. Maybe it's only temporary, but time will tell.
FB - Facebook Inc.
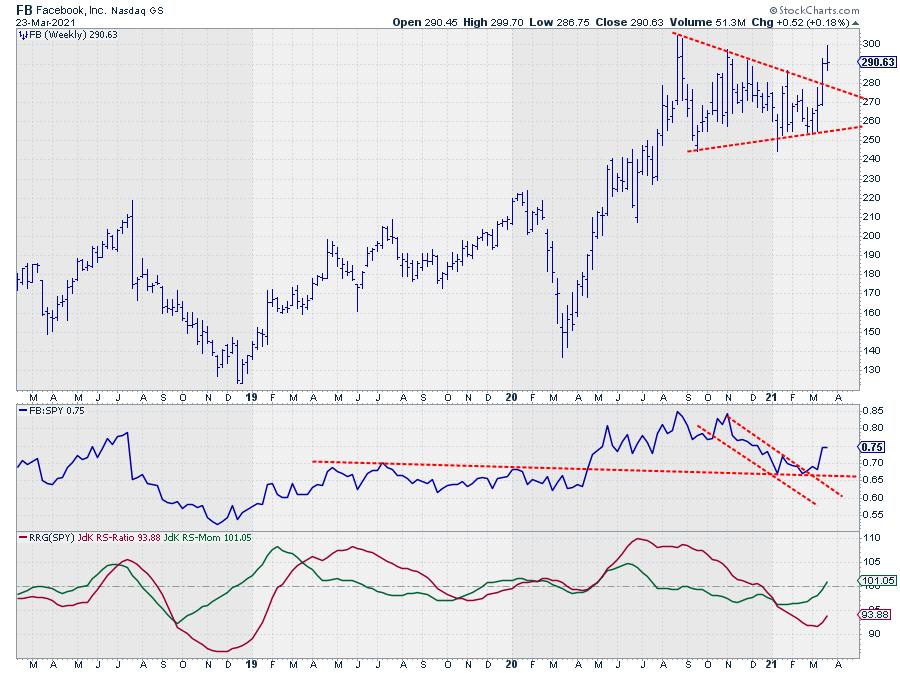
FB has found support in relative strength, which stopped the decline that started in late October 2020. With the upward break from the consolidation pattern (triangle) in price, that's enough reason to cover the short position in the basket.
Adding
EXR - Extra Space Storage Inc.
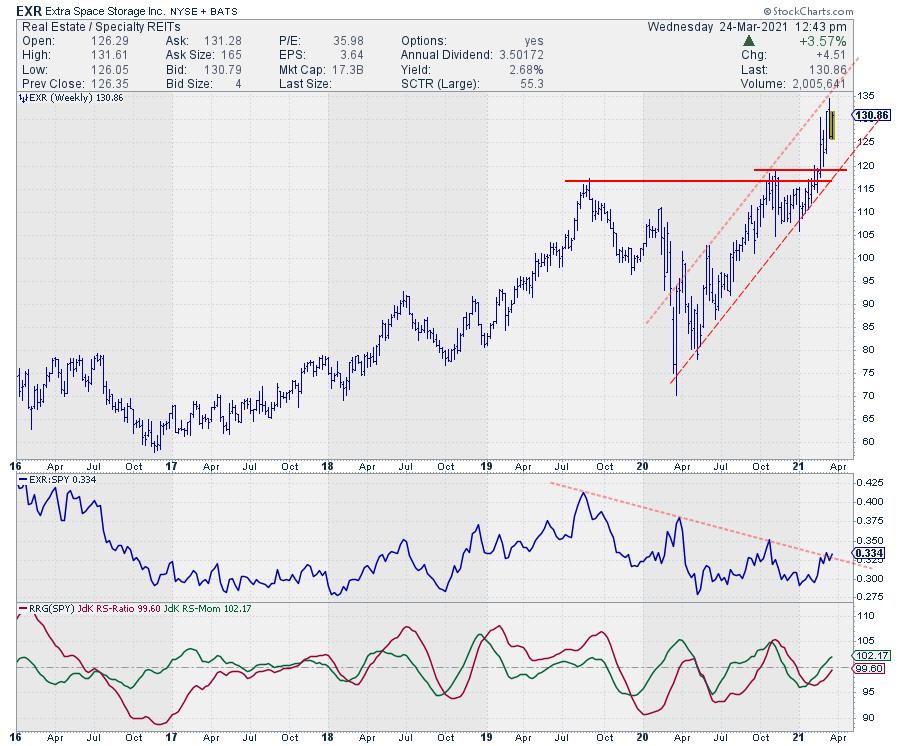
With a positive view on the Real Estate sector both in Sector Spotlight and a blog article this week, it is only logical to search for a new addition to the basket in that sector. From the article, I decided to go for EXR.
The stock broke to new highs in February and managed to hold up very well, continuing its up-move within the boundaries of a rising channel. On the RRG (vs. SPY), EXR is about to cross over into the leading quadrant from improving while the RS-Line is pushing against its falling resistance line. When RS can clear that relative resistance, a further appreciation for EXR is likely.
With the downside well-protected by former resistance near $120 and no meaningful resistance to the upside, EXR is expected to bring a positive contribution to the Long/Short basket.
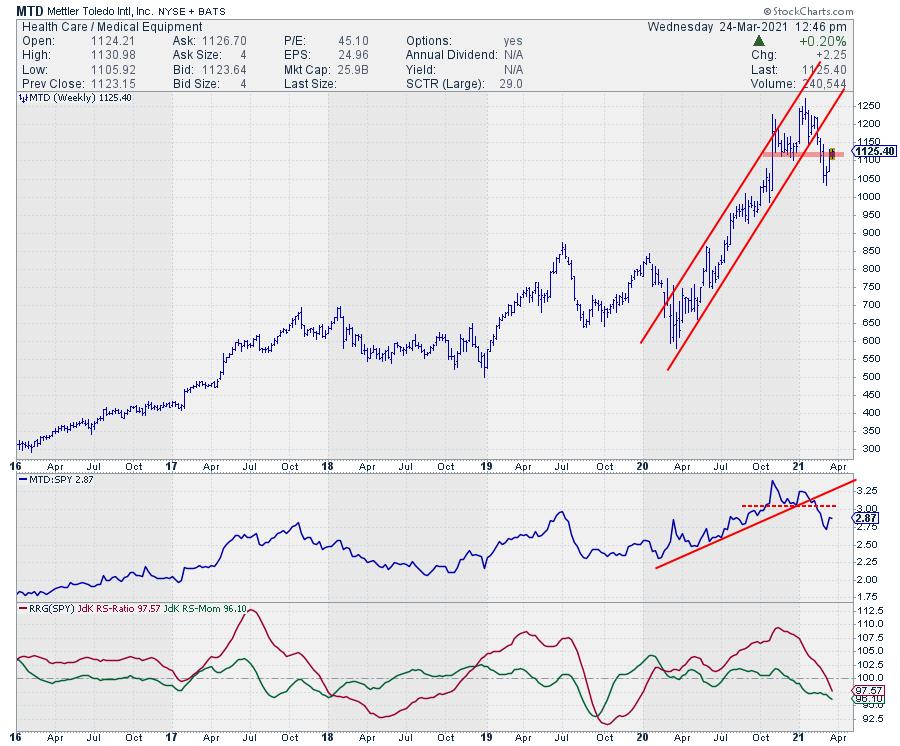
MTD - Mettler Toledo Inc.
The Health Care sector is rotating back into lagging from improving, suggesting that a new down move within the relative downtrend is about to get underway. So my search for a replacement on the short side concentrated on this sector.
Looking at the RRG for Health Care constituents, I found a few stocks that could be interesting as additions on the short side: BDX, ABBV, MTD, HOLX, TMO, WST. I picked MTD.
The stock recently dropped out of its rising channel and, in the process, dropped below its previous low. Simultaneously, the uptrend in relative strength got broken and resulted in a rotation into the lagging quadrant from weakening. The current pull-back towards resistance offered by the former support level around $1125 looks like a good opportunity to add MTD to the short side of the basket.
Current Basket
With the new changes in place, the RRG L/S basket now looks like this:
Long:
- EBAY
- EWC
- IVE
- MSFT
- PSCD
- WFC
- EXR
Short:
- ADBE
- COST
- ETR
- IVW
- PG
- XLY
- MTD
Julius de Kempenaer
Senior Technical Analyst, StockCharts.com
Creator, Relative Rotation Graphs
Founder, RRG Research
Host of: Sector Spotlight
Please find my handles for social media channels under the Bio below.
Feedback, comments or questions are welcome at Juliusdk@stockcharts.com. I cannot promise to respond to each and every message, but I will certainly read them and, where reasonably possible, use the feedback and comments or answer questions.
To discuss RRG with me on S.C.A.N., tag me using the handle Julius_RRG.
RRG, Relative Rotation Graphs, JdK RS-Ratio, and JdK RS-Momentum are registered trademarks of RRG Research.


