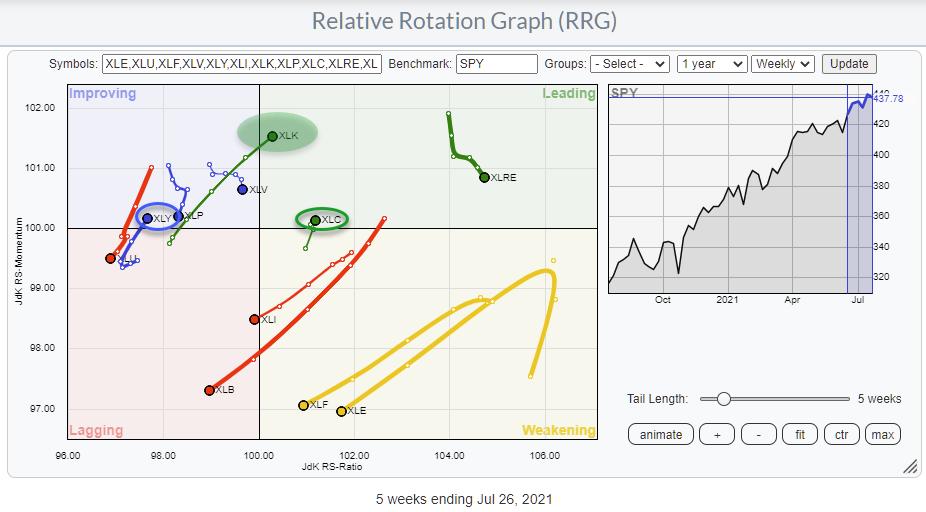
At the start of this week, the technology sector is rotating into the leading quadrant on the weekly RRG. Clearly, the endpoint of the tail is not fixed until Friday's close. Still, the improvement is visible and follows the improvement that was already visible for a few weeks when XLK started to move through the improving quadrant at a strong RRG-Heading.
Will this be the signal for a full Risk-On situation again? I doubt it.
As you can see on the RRG above, only 3 out of the 11 tails are at an RRG-Heading between 0-90 degrees. Only XLK, XLY and XLC are pointing in that direction. This tells me that only these three sectors are "pulling" in the right direction. In terms of market capitalization, it comes down to around 50%.
Another observation is that quite a few sectors are at a very well-defined NEGATIVE trajectory.
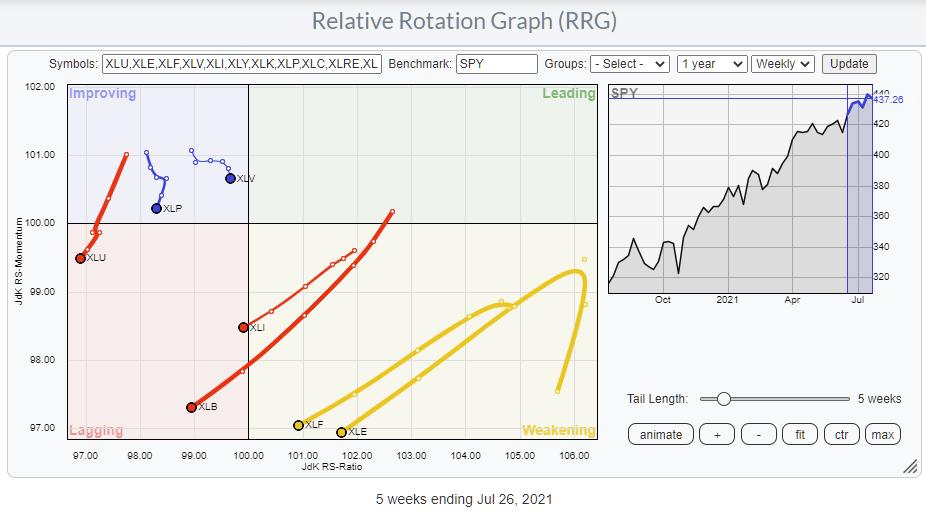
In the RRG above, I have taken away the three tails for the sectors at a strong heading and XLRE, as it is inside the leading quadrant but going through a setback. You can now see several long powerful tails moving into or rapidly towards the lagging quadrant for XLE, XLF, XLI and XLB. XLU has just completed a rotation through improving and is now back in lagging while XLV and XLP are rolling over inside the improving quadrant.
It's not the type of rotation we'd like to see for a full-fledged bull market.
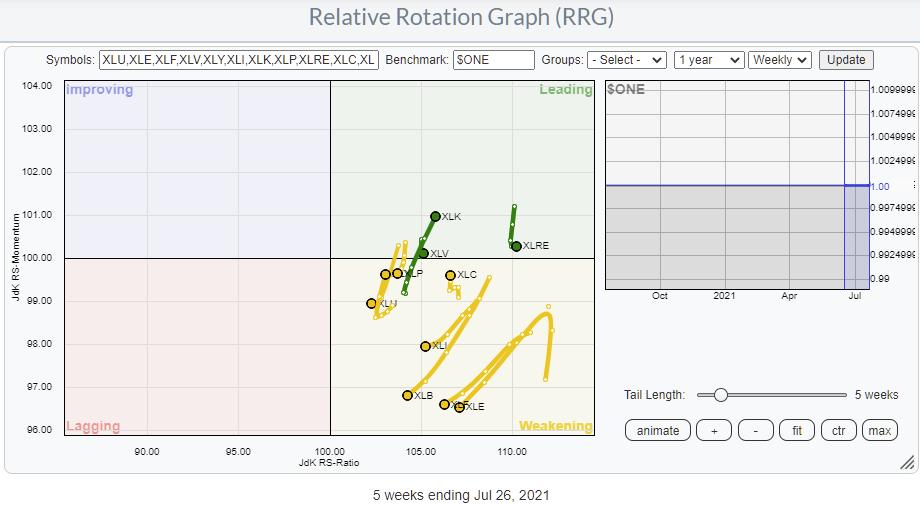
Switching the benchmark to $ONE can give a sense of the underlying breadth that is supporting, or not supporting, the general market. The RRG above shows the majority of sectors inside weakening and at a negative heading, underscoring the continued lack of support from the broader market.
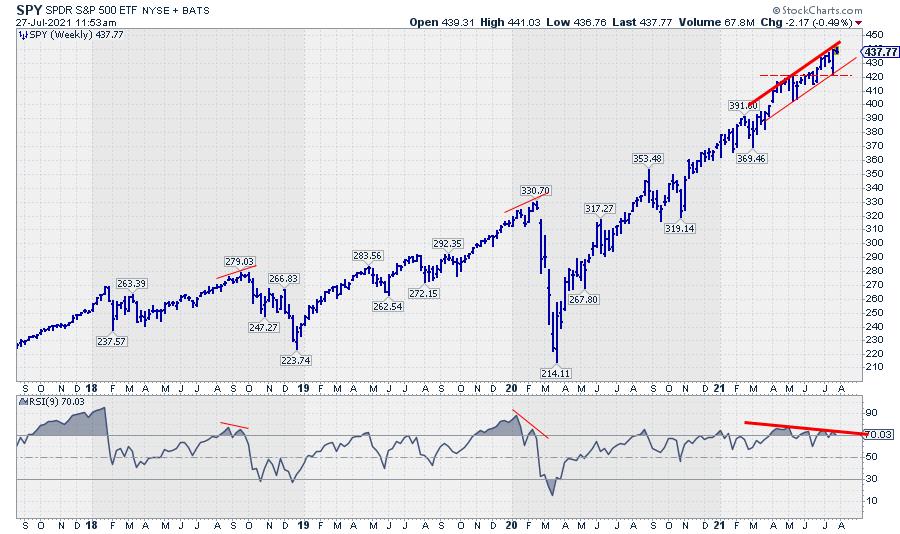
Finally, here's the chart of SPY itself. This one is keeping me on my guard. The negative divergence between price and RSI continues to build up. Not a situation that is seen in the middle of a strong uptrend.
Stocks vs. Bonds
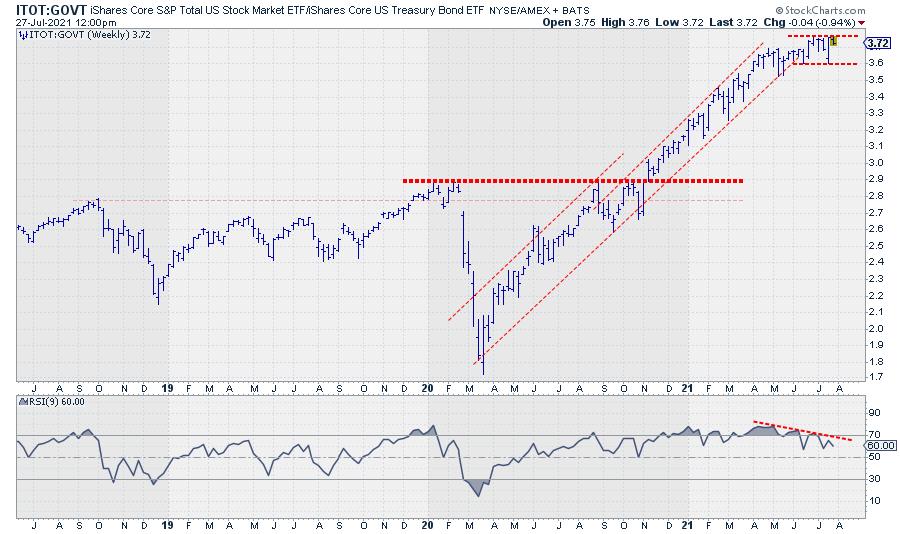
The chart of the ITOT:GOVT ratio is also sending us warning signals. The most recent high (late June) did not manage to reach the upper boundary of the solidly rising channel in play for well over a year. This ratio is now challenging the rising support line that marks the lower boundary of this channel and looks to start trading in a narrow range.
Last week's low at 3.6 has now become an important support level. A break lower, combined with the negative divergence still building up in the RSI, will likely cause a rapid deceleration of this metric, indicating a move out of stocks into bonds.
All in all, there are still plenty of warning signals that justify continued caution with regard to (new) positions in stocks.
#StaySafe, --Julius
Julius de Kempenaer
Senior Technical Analyst, StockCharts.com
Creator, Relative Rotation Graphs
Founder, RRG Research
Host of: Sector Spotlight
Please find my handles for social media channels under the Bio below.
Feedback, comments or questions are welcome at Juliusdk@stockcharts.com. I cannot promise to respond to each and every message, but I will certainly read them and, where reasonably possible, use the feedback and comments or answer questions.
To discuss RRG with me on S.C.A.N., tag me using the handle Julius_RRG.
RRG, Relative Rotation Graphs, JdK RS-Ratio, and JdK RS-Momentum are registered trademarks of RRG Research.


