First of all, I'm sorry I had to cancel today's episode of Sector Spotlight. I've been battling a nasty cough/cold and a sore throat with not much voice left for a week now, and things did not improve enough to do a decent presentation/talk for 30 minutes. The test says no COVID, but my body somewhat disagrees... I hope to be back in full swing next week.
In this article, I want to go over the RRG Long/Short baskets, which is long overdue. My bad, as not updating it enough has hurt the performance. So I will pick up the pieces, reset and start again from where we are right now.
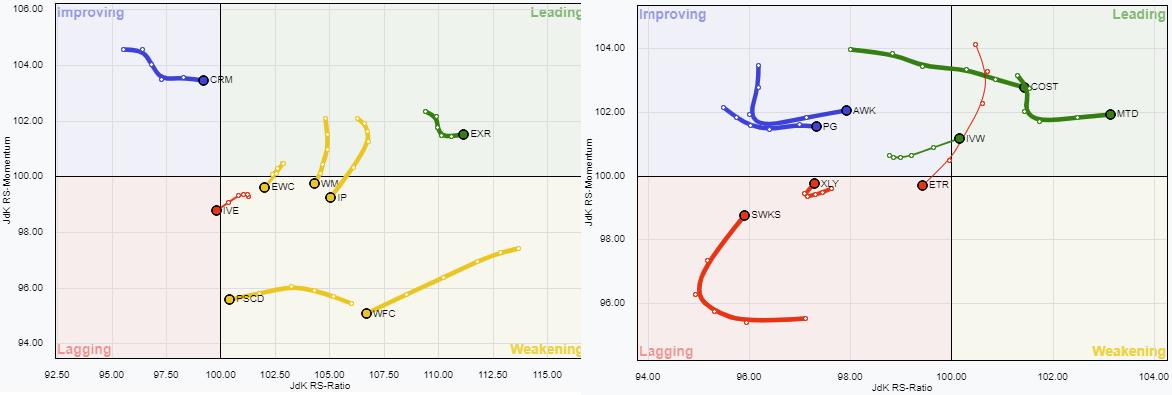
After the last update, the composition for both baskets is as follows:
- LONG: EWC, EXR, IP, IVE< PSCD, WFC, WM, CRM
- SHORT: AWK, COST, ETR, IVW, MTD, PG, XLY, SWKS
LONG

EXR

EXR is still holding up well, no reason to remove it from the long side.
WM

WM just broke away from the small consolidation pattern in price and the old resistance is now holding up as support. This should help relative strength vs. SPY to move higher and take out overhead resistance. This one can stay in the basket as well.
WFC

WFC bounced off the slightly falling resistance and is holding up above horizontal support. However, the relative strength line is having trouble pushing higher. With the general weakness for the Financial sector as a whole, I will remove WFC from the basket.
IVE

IVE dropped out of the rising channel on the price chart and dropped back below support on the RS-chart as well, which is pushing both RRG-Lines below 100 and IVE into the lagging quadrant on the RRG. No excuse to keep IVE on the long side.
IP

IP is a difficult call. The former resistance is holding up as support on the price chart together with the rising support line. On the other hand, a series of lower highs and lower lows seems to be emerging. From a relative point of view, the RS-line breaks back below its former resistance level, while the RRG-Lines are pushing the tail into the weakening quadrant at a negative heading.
Removing IP from the long basket.
CRM

In the last few weeks, CRM did what is was meant to do when it was for the long basket, outperforming the S&P 500. On the price chart, CRM is holding above the former falling resistance line. Taking out overhead resistance at $250 would be a nice kicker.
As long as the RS-Line holds up above horizontal support and the RRG lines keep rising, there is no reason to remove CRM from the basket.
PSCD

This is an excellent example of a position that did very well and turned around due to lack of attention. A few weeks ago, the price dropped below some rising support levels while, at the same time, took out some previous lows. Relative strength also dropped below its rising support line a few weeks back and it is pushing the tail for PSCD towards and almost into the lagging quadrant.
This one needs to go, long overdue.
EWC

EWC started nicely but stayed in the basket for too long. Then, two weeks ago, the price broke below the rising support line, while it had already taken out its previous low a bit earlier.
A similar thing is happening in relative strength, making the tail for EWC point towards the lagging quadrant while inside weakening but close to 100 on the RS-Ratio scale.
Removing EWC as well.
SHORT

ETR

ETR bounced off resistance on both the price chart and the RS chart. This combination has sent both RRG-Lines lower and put the tail into the lagging quadrant at a negative RRG-heading. Definitely worth holding this on the short side.
XLY

XLY got on the short side as the counterpart of the PSCD long position in an attempt to profit from the improvement of Small-Cap discretionary stocks vs. their large-cap counterparts. That did work for a while, but then XLY itself started to deteriorate even faster.
It's especially the RS-chart that helps to keep XLY in the short basket. The series of lower highs and lower lows is still intact and is causing a short tail on the RRG, which signals a stable trend - in this case, down vs. SPY.
Given the tail's position on the weekly RRG and the weakness that is already showing up in the daily rotation for XLY, I am going to keep XLY on the short side.
IVW

IVW was the counterpart of IVE on the Long side and should have been removed together with IVW. This pair in favor of value over growth stocks has been in the baskets for a long time and has added to the performance nicely, but should have been closed when the rotation turned back in favor of growth. As you can see, that happened quite a while ago and IVW is now even entering the leading quadrant again.
This one needs to go.
AWK

On the price chart, AWK completed a formation that can be labeled as an H&S continuation pattern (+bullish). Taking out resistance near $170 would confirm that view. On the relative chart, AWK is breaking away from a small bottoming formation, which suggests further relative improvement.
All in all, enough reasons to remove AWK from the short basket.
PG

PG broke resistance on the price chart, which should enable the stocks to move higher, or at least not drop sharply. The decline in relative strength has slowed down, causing the RRG-Lines to stabilize and move slowly higher. With the tail inside the improving quadrant and steadily heading higher on the RS-Ratio scale, I feel the odds favor PG to improve further vs. SPY. That warrants removal from the short side.
MTD

MTD remained in the short basket way too long. It has broken resistance levels in price and relative strength and is now positioned well inside the leading quadrant. There is no reason to keep this as a short.
COST

COST is showing a similar picture as MTD. Breaking higher on both the price and the relative charts, which puts the tail well inside the leading quadrant, is enough reason to remove it from the short basket.
SWKS

SWKS moved against me in the last few weeks but has now failed to break horizontal resistance around 195, which coincides with the level of the former rising support line, which now acts as resistance.
The RS-Line is also bouncing against the former rising support on the relative chart, which was broken weeks ago. The rhythm of lower highs and lower lows is still in play on the relative chart. Together with the heavy overhead resistance in price and the low position on the RS-Ratio scale, I will maintain SWKS on the short side for the time being.
This leaves us with the following baskets:
LONG: EXR, WM, CRM
SHORT: ETR, XLY, SWKS
Performance is not as nice as it used to be anymore. So we start looking for new additions from here on!

#StaySafe, --Julius
Julius de Kempenaer
Senior Technical Analyst, StockCharts.com
Creator, Relative Rotation Graphs
Founder, RRG Research
Host of: Sector Spotlight
Please find my handles for social media channels under the Bio below.
Feedback, comments or questions are welcome at Juliusdk@stockcharts.com. I cannot promise to respond to each and every message, but I will certainly read them and, where reasonably possible, use the feedback and comments or answer questions.
To discuss RRG with me on S.C.A.N., tag me using the handle Julius_RRG.
RRG, Relative Rotation Graphs, JdK RS-Ratio, and JdK RS-Momentum are registered trademarks of RRG Research.


