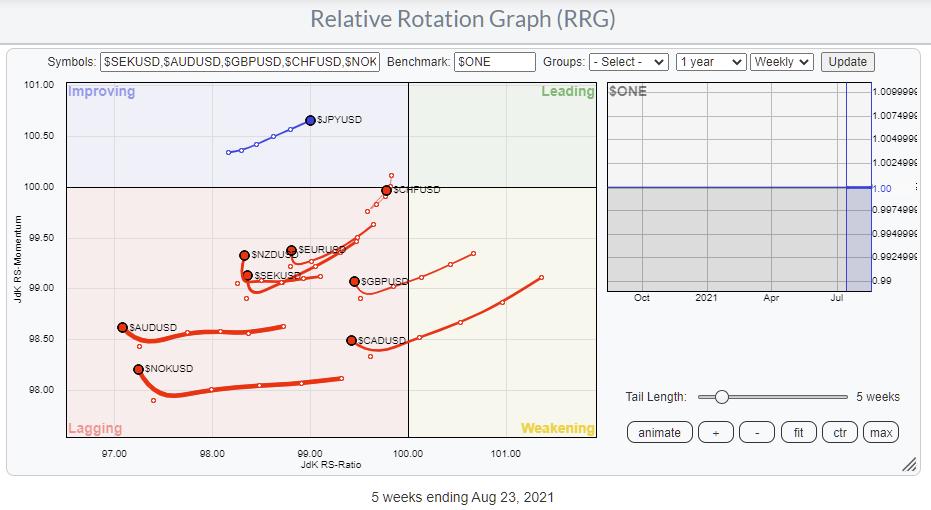
The Relative Rotation Graph above shows the rotation for the G10 currencies against the USD, which is the base (=benchmark) for this universe. Or, better, it shows nine of the G10 currencies against the USD.
The general direction for this universe is pretty clear. The majority is moving inside the lagging quadrant and heading lower on the JdK RS-Ratio scale. The small move higher on the RS-Momentum axes is the impact of price movements so far this week. But, as you know, the last observation on a weekly RRG is fluid until Friday's close, so things can still change in the remaining three days.
The general message that this image is sending is overall USD strength across the board. The only outlier seems to be the Japanese Yen, which moves at a positive RRG-Heading inside the improving quadrant.
In today's episode of Sector Spotlight, I discussed the (positive) rotation for the USD in a universe of asset classes, which shows an improvement for the USD against other asset classes, and VBINX, which I use as the benchmark for Asset Allocation.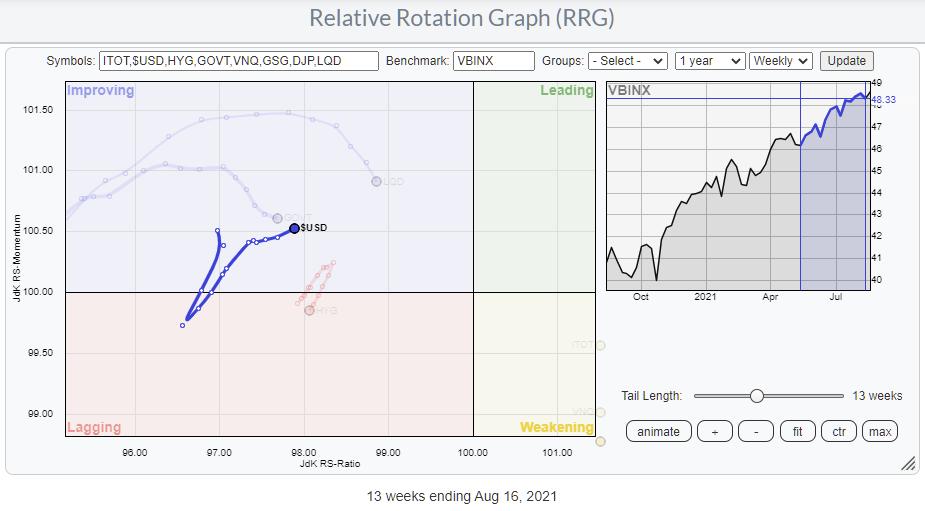
There's enough reasons to zoom in on the price charts for EURUSD and also JPYUSD, or better USDJPY, as that is the international convention for the quotation of this pair.
EUR/USD
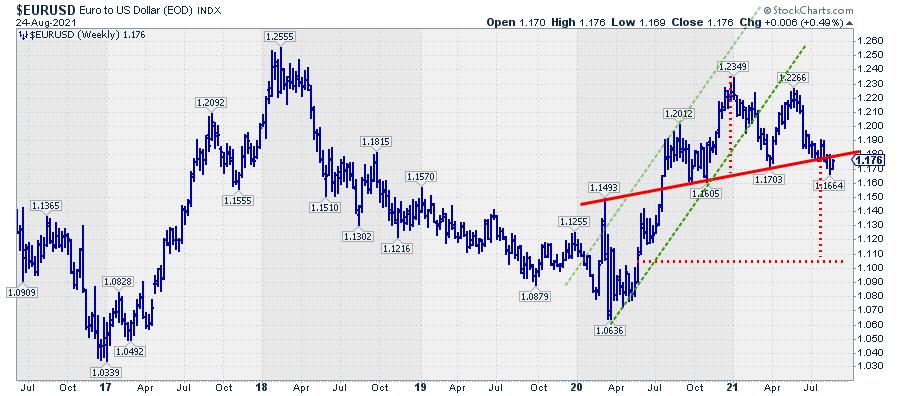
The linked chart above is the weekly EUR/USD chart as I track it in Sector Spotlight. After reaching a peak around 1.2350 at the start of 2021, at first sight, not much happened over a period of many months. But, very recently, things started to clear up, and the chart "came to life" as a pretty big Head & Shoulders formation seems to have formed and recently completed when price broke below the slight up-sloping neck-line.
For a valid H&S pattern, which is a reversal pattern, there must be a prior trend to reverse. Not every pattern that "looks like" a Head & Shoulders formation qualifies as such. The prior trend is clearly visible in this case, from the low at 1.06 in 2020 to the peak at 1.2350 in 2021.
When the rising support line was broken and the subsequent low formed at 1.17, the first contours of a possible H&S reversal started to take shape. These got stronger when the next high was set at 1.2270, lower than the peak at 1.2350. Thus, in the move down from that 1.2270 peak, we could start sketching an H&S formation and draw the neckline by connecting the two "armpits" at 1.1605 and 1.1703.
Last week, EUR/USD broke below that neckline, which completed the H&S formation opening up the way for a further down move.
As we are dealing with a well-shaped H&S formation, we can calculate a price target based on this formation. This is done by taking the height of the formation, measuring from the "head" at 1.2350 straight down to the neckline. See the red dotted line on the chart? This is 1.2350 - 1.1650 = 0.07. These 7 big figures we may project down from the break below the neckline.
That break occurred when the neckline was around 1.1750, which means that the price target for this move comes out at 1.1050. This is a serious move!!
As always, after an initial break, it is very well possible that we will see a pullback to the breakout level before the decline follows through. That will be an important move to watch, as it can negate or reinforce the validity of the H&S formation.
USD/JPY
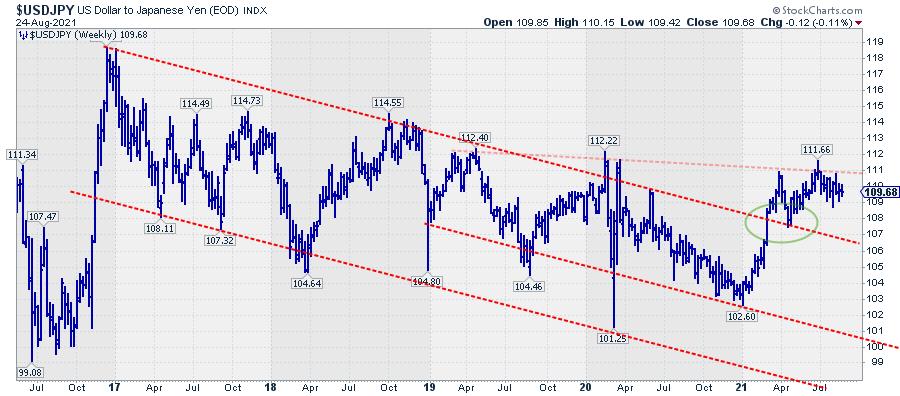
The market convention to quote the Yen is to express USD in Yen (USD/JPY). So, in this graph, a rising line means a stronger USD and a weaker JPY. This is the opposite of EUR/USD above, where the convention is to quote the EURO in USD, and a rising line means a stronger EURO and a weaker USD.
When we plot currencies on a Relative Rotation Graph, they all need to have the same denominator, so all currencies are expressed in USD, which, in some cases, goes against market conventions.
If you need a refresher on plotting and reading a Relative Rotation Graph for currencies, please check this article.
How to show "currency rotation" on a Relative Rotation Graph.
Looking at the price graph of USD/JPY above, we see a long downtrend in a series of lower highs and lower lows from the peak at 119 in 2017 all the way down to the low around 103 at the start of 2021. The break above the falling resistance and the subsequent drop back with that former resistance acting as support (see green oval), imho, marks the end of the long downtrend and the start of a longer period of strength for the USD vs. the JPY.
In the near term, USD/JPY seems to have some trouble with overhead resistance between 111-112. However, once that barrier can be cleared, much further upside is expected, bringing the JPY in line with other world currencies.
All-in-all the improvement for the USD against the major world currencies is getting more and more visible.
Julius de Kempenaer
Senior Technical Analyst, StockCharts.com
Creator, Relative Rotation Graphs
Founder, RRG Research
Host of: Sector Spotlight
Please find my handles for social media channels under the Bio below.
Feedback, comments or questions are welcome at Juliusdk@stockcharts.com. I cannot promise to respond to each and every message, but I will certainly read them and, where reasonably possible, use the feedback and comments or answer questions.
To discuss RRG with me on S.C.A.N., tag me using the handle Julius_RRG.
RRG, Relative Rotation Graphs, JdK RS-Ratio, and JdK RS-Momentum are registered trademarks of RRG Research.


