Offensive vs Defensive sector rotation always is a theme in stock markets. Sometimes a little more on the forefront, sometimes a bit more on the background. Sometimes we can read very clear messages from certain rotations, sometimes a little less.
At the moment, I believe, the offensive/defensive rotation is sending a pretty clear signal.
But before we take a look at those rotations; What are offensive sectors and what are defensive sectors. It is not always clear and even people that are much smarter than me and way above my pay grade are not on the same page.
For a long time, I have used the classification as it is published by MSCI.
OFFENSIVE:
- Consumer Discretionary - XLY
- Financials -XLF
- Real Estate - XLRE
- Industrials - XLI
- Information Technology - XLK
- Materials - XLB
- Communication Services - XLC
DEFENSIVE:
- Consumer Staples - XLP
- Energy - XLE
- Healthcare - XLV
- Utilities - XLU
I have also set up two Relative Rotation Graphs in my bookmarks specifically showing the sectors using this breakdown.
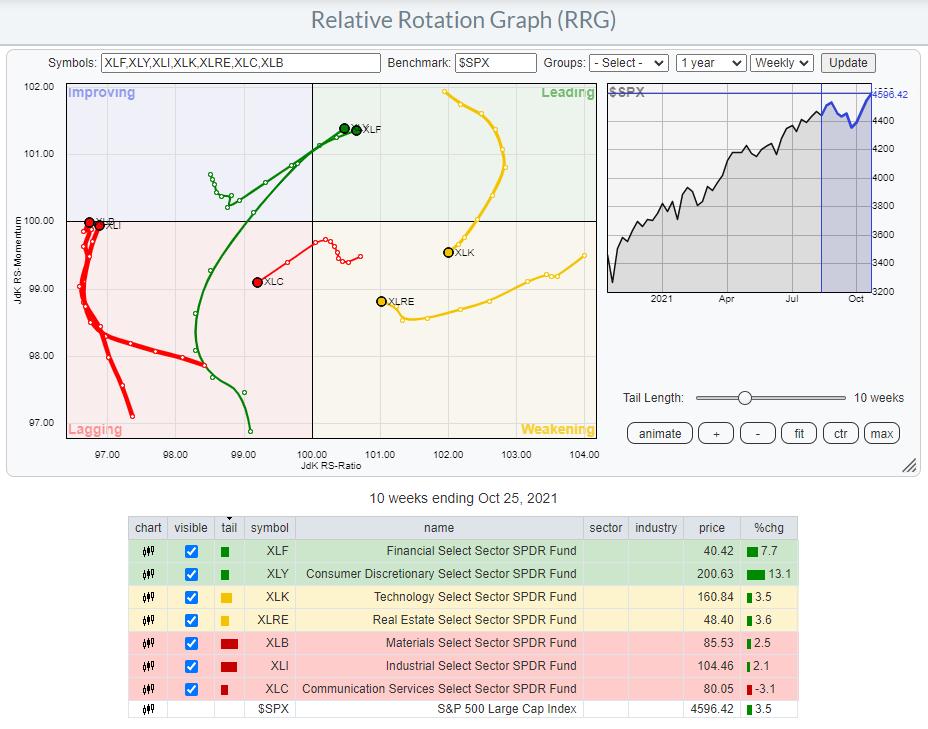
One RRG showing only the cyclical/offensive sectors;
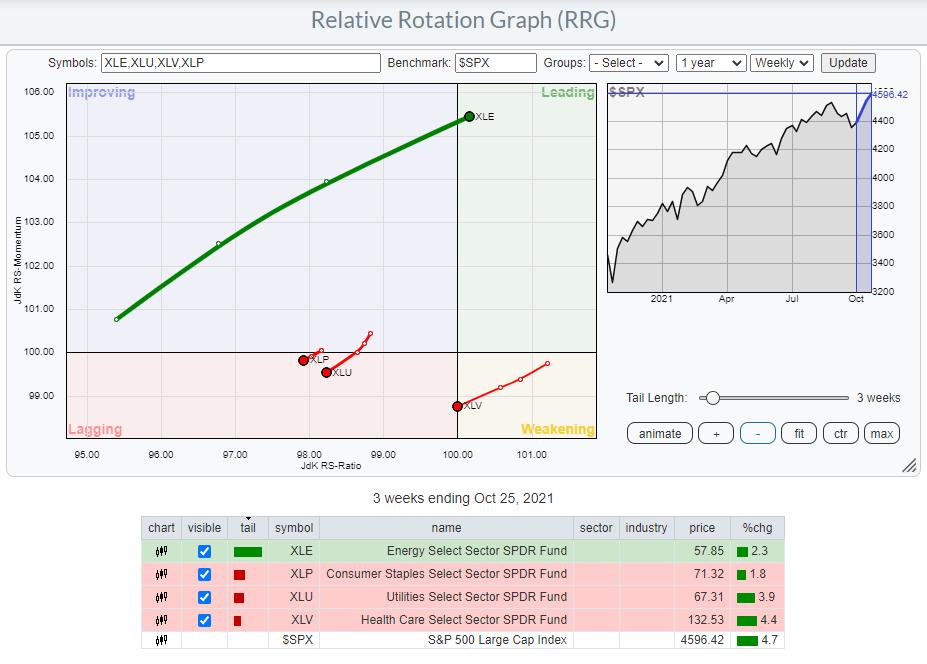
and one RRG showing only the defensive sectors;
My thought was that when I isolate these two groups I would see rotations that are generally moving in the same direction, enabling me to easily spot offensive vs defensive rotations.
Of course, things are never as easy as you think or would like them to be.
Neither of the two images is sending a very clear rotational picture.
Bring BETA into the MIX
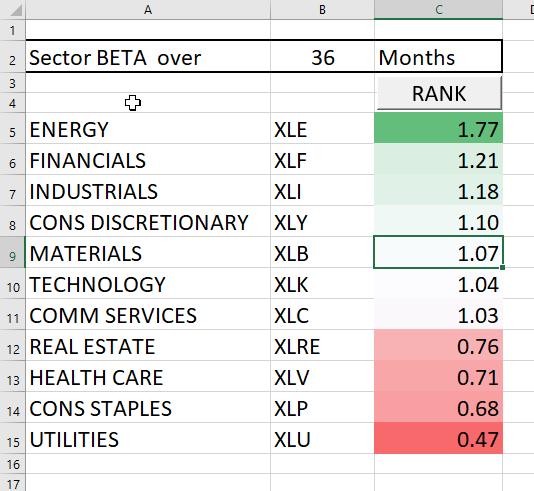
Another metric that I started using a while ago to distinguish between offense and defense is BETA, good old BETA. So from time to time I run the BETA calculations for all 11 sectors and see how they rank against each other.
At the moment this is the result for 36-month historical BETA
My next step was to add these BETA values as annotations to both RRGs above to get a sense of how they are relating to offensive and defensive rotations.
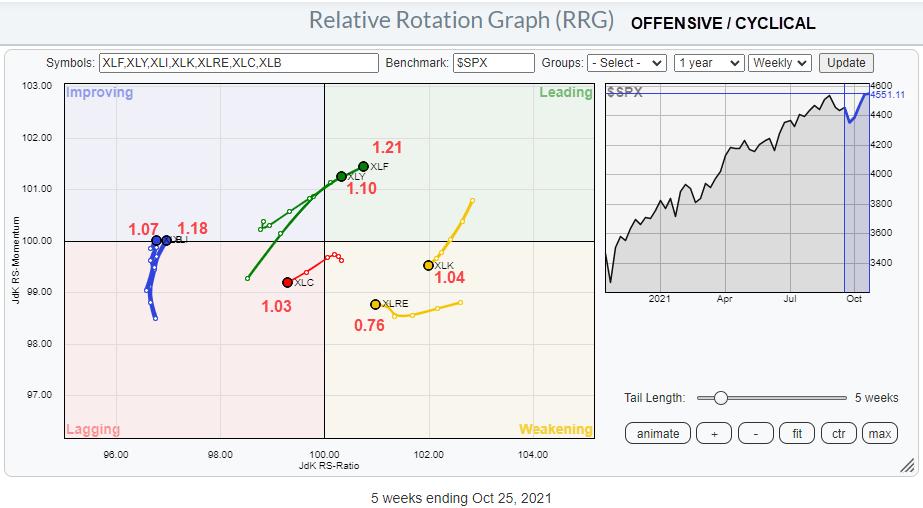
As you can see, the results are mixed.
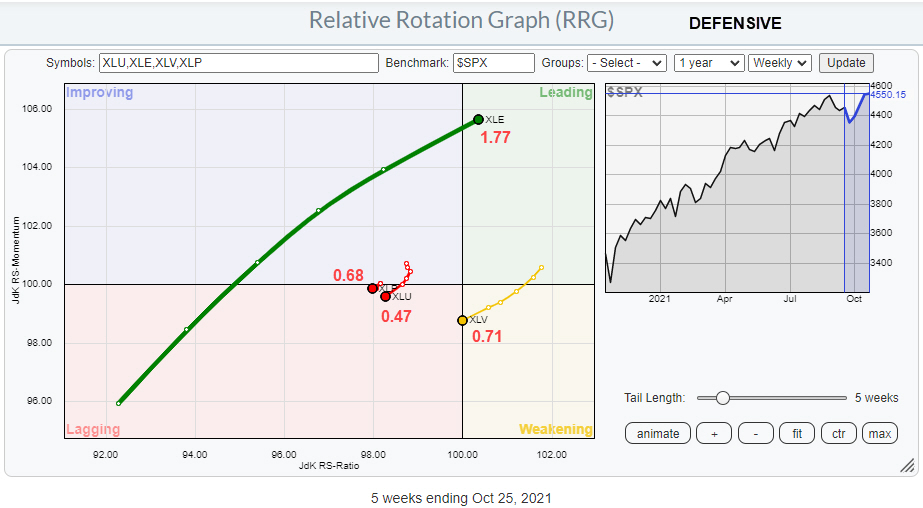
Let's start with the RRG showing defensive sectors. I think there is no doubt about the defensive character of the three sectors that are currently inside or about to crossover into the lagging quadrant: XLP, XLU, XLV.
The clear outlier here is XLE, Energy, with a BETA of 1.77 over the last 36 months. Also for other periods (24,48,60 months), the Energy sector comes out as a high BETA sector. Only for shorter periods < 12 months XLE shows low or even negative BETA. That's not really reliable to classify a sector as defensive.
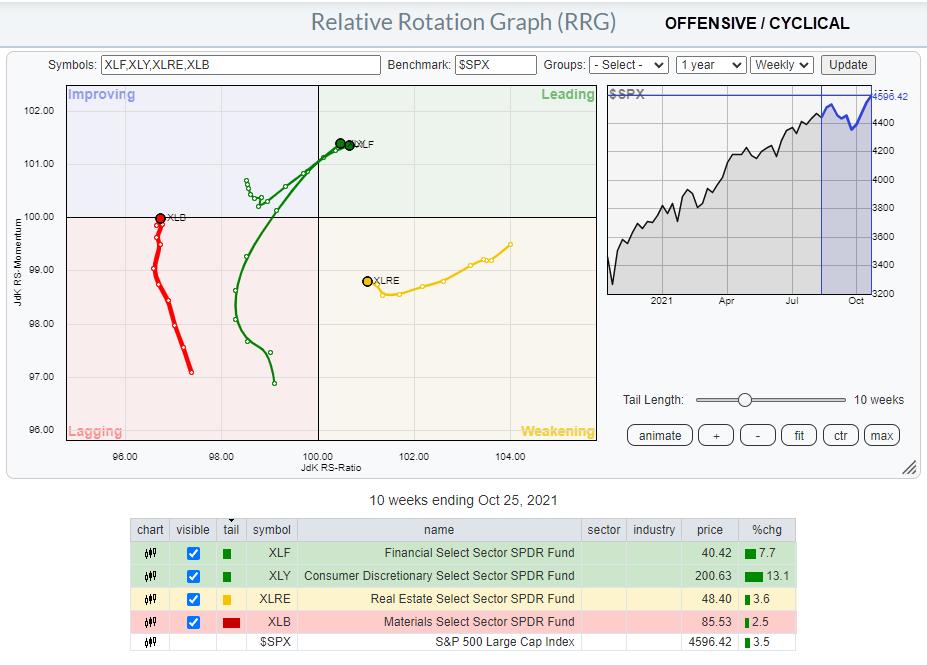
Also on the RRG showing the cyclical sectors in combination with their BETAs, it is not super-clear. However, the clearly offensive sectors like Financials and Consumer Discretionary with BETA values of 1.21 and 1.10 are popping out inside the leading quadrant at the moment. While XLI and XLB are heading into the improving quadrant at a strong RRG-Heading have BETA values of 1.07 and 1.18.
The classification of XLC (1.03) and XLK (1.04) is difficult as they are so close to 1 which means "the market" while XLRE with a BETA of 0.76 looks more like a defensive sector.
Morningstar Classification
After one of my Sector Spotlight shows in which I discussed offensive/defensive rotation using the MSCI breakdown, I got an email from one of the viewers who pointed me to the breakdown/classification as it used by Morningstar.
Instead of only distinguishing offense vs defense, they have added a third category "sensitive".
Cyclical:
- Basic Materials - XLB (1.07)
- Consumer Cyclical (Discretionary) - XLY (1.10)
- Financial Services - XLF (1.21)
- Real - Estate - XLRE (0.76)
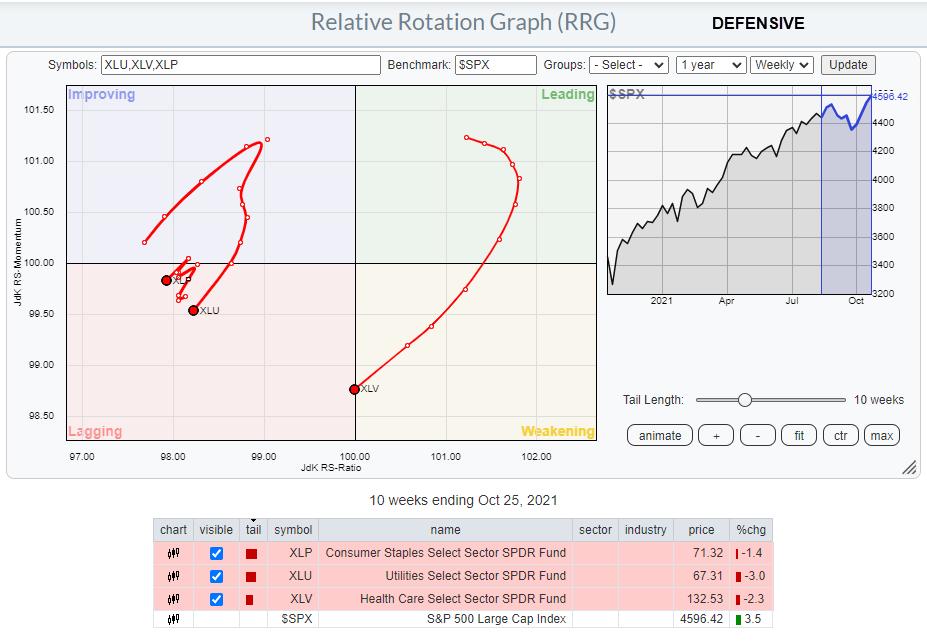
Defensive
- Consumer Defensive (Staples) - XLP (0.68)
- Healthcare - XLV (0.71)
- Utilities - XLU (0.47)
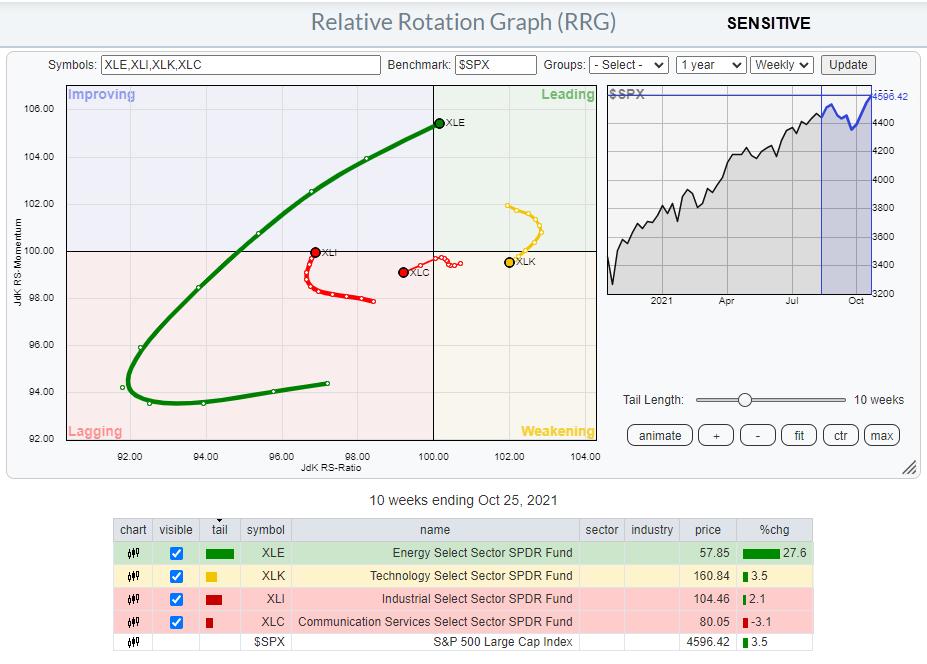
Sensitive
- Communication Services - XLC (1.03)
- Energy - XLE (1.77)
- Industrials - XLI (1.18)
- Technology - XLK (1.04)
Intuitively that makes (more) sense. IMHO, there is no doubt about the Defensive groups, they're almost a no-brainer. The same goes for Cyclicals with the exception of Real-Estate which, based on BETA, seems to lean more towards defensive.
That leaves us with the sensitives. For XLC and XLK that seems to make sense as these groups can strongly outperform or underperform while their overall BETA is very close to 1. In a similar way that goes for XLE as well as its BETA swings from very high to very low. The only odd one here seems Industrials which, with a fairly stable BETA around 1.20, could classify as cyclical.
Putting this breakdown on separate Relative Rotation Graphs gives the following images.
Going forward I am planning to use this breakdown, including the sensitives group as it gives a bit more granularity.
The takeaway for current markets.
Looking at these RRGs above I think that the clearest picture is coming from the defensive groups. They are strongly rotating into the lagging quadrant signaling their relative downtrend vs the market. This type of rotation we usually see when the general market is strong.
Except for XLRE, the offensive sectors are all at a strong RRG Heading and picking up more strength. And XLRE is still at the right-hand side of the graph inside weakening but still has enough room left to curl back up and join the other sectors in the next leg up.
The sensitive sectors are evenly spread, maybe they hold the key for the final confirmation. XLK curling back up inside weakening, without hitting lagging would be a strong sign.
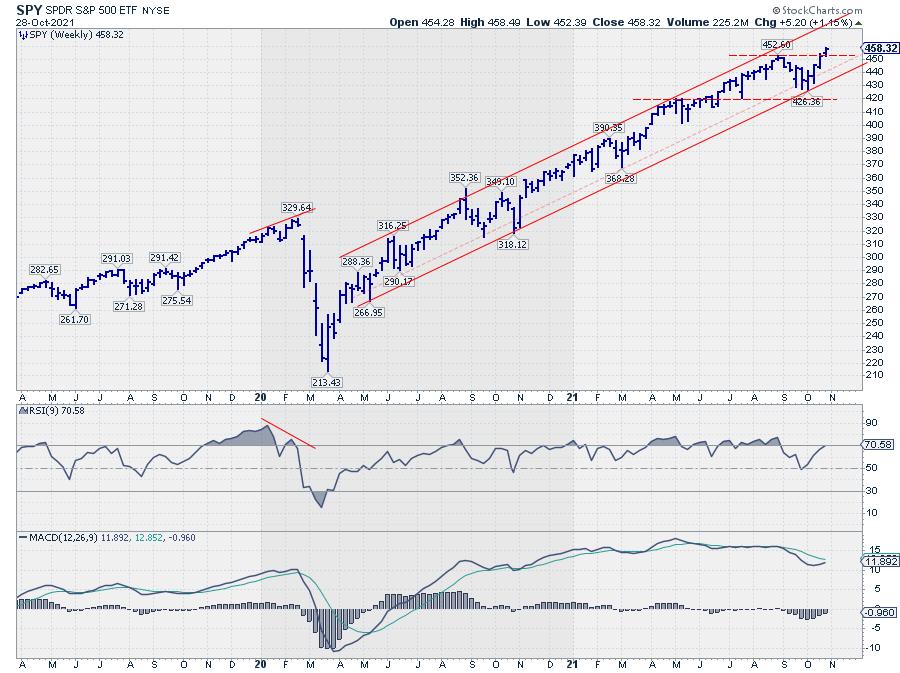
In combination with a break to new highs in the S&P 500 all of this suggests that the long-term uptrend is embarking on a new leg higher.
#StaySafe, --Julius
Julius de Kempenaer
Senior Technical Analyst, StockCharts.com
Creator, Relative Rotation Graphs
Founder, RRG Research
Host of: Sector Spotlight
Please find my handles for social media channels under the Bio below.
Feedback, comments or questions are welcome at Juliusdk@stockcharts.com. I cannot promise to respond to each and every message, but I will certainly read them and, where reasonably possible, use the feedback and comments or answer questions.
To discuss RRG with me on S.C.A.N., tag me using the handle Julius_RRG.
RRG, Relative Rotation Graphs, JdK RS-Ratio, and JdK RS-Momentum are registered trademarks of RRG Research.


