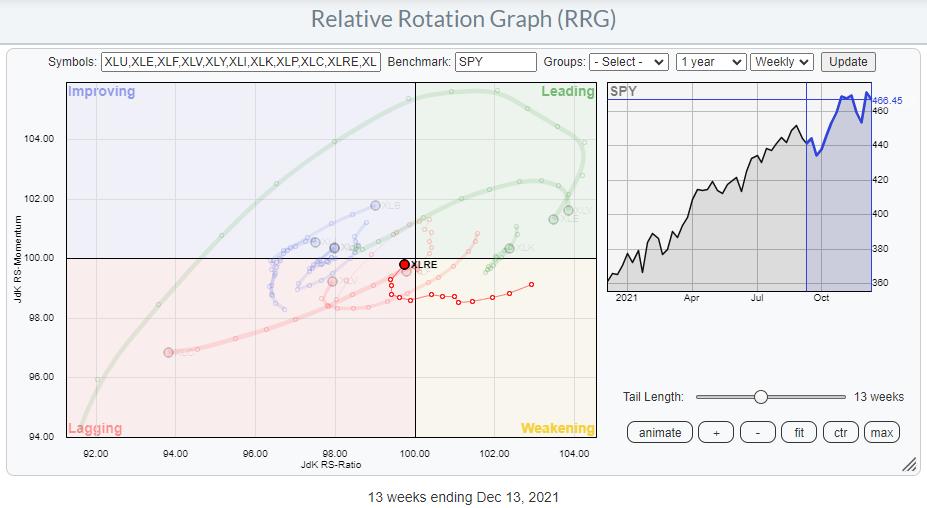
Watching the rotation of the Real Estate sector (XLRE) on a Relative Rotation Graph shows the tail inside the lagging quadrant after a long rotation through leading and weakening.
Six weeks ago, XLRE moved into the lagging quadrant, but quite rapidly started to pick up relative momentum again, pushing the tail higher and, since this week, has also started to pick up on the JdK RS-Ratio scale, causing it to travel at a strong RRG-Heading.
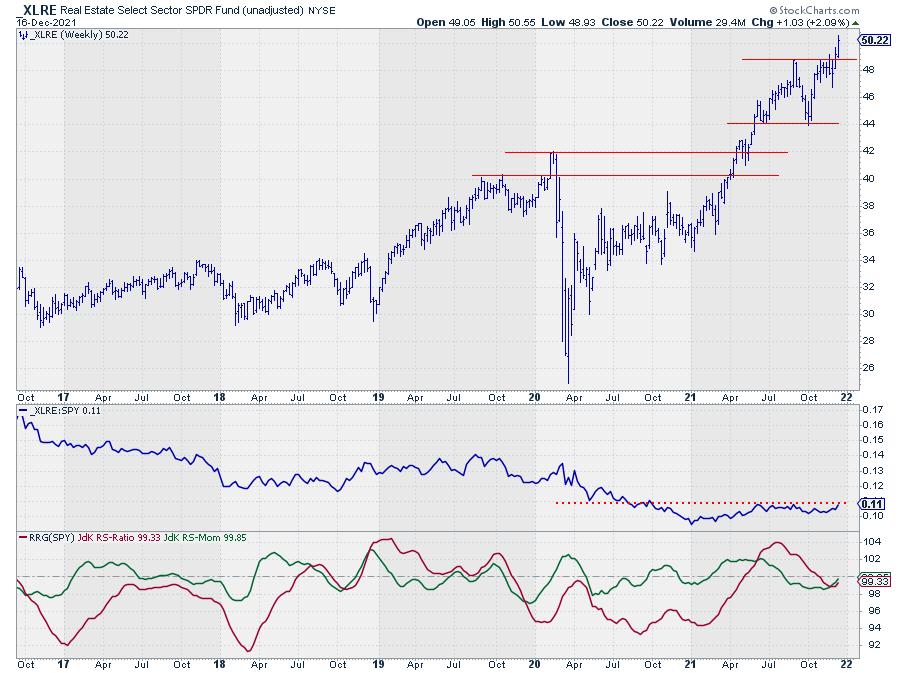
A quick look at the price chart, at the top of the article, reveals that the sector is breaking to new highs, which is unlocking fresh upside potential while keeping the downside well protected. We can expect the former breakout level to start acting as support in case of a setback.
The dotted line in the RS-line highlights the overhead resistance that is still present for the ratio. Also, breaking that barrier will almost certainly cause the RRG-Lines to push higher and drive the XLRE tail back into the leading quadrant.
Groups
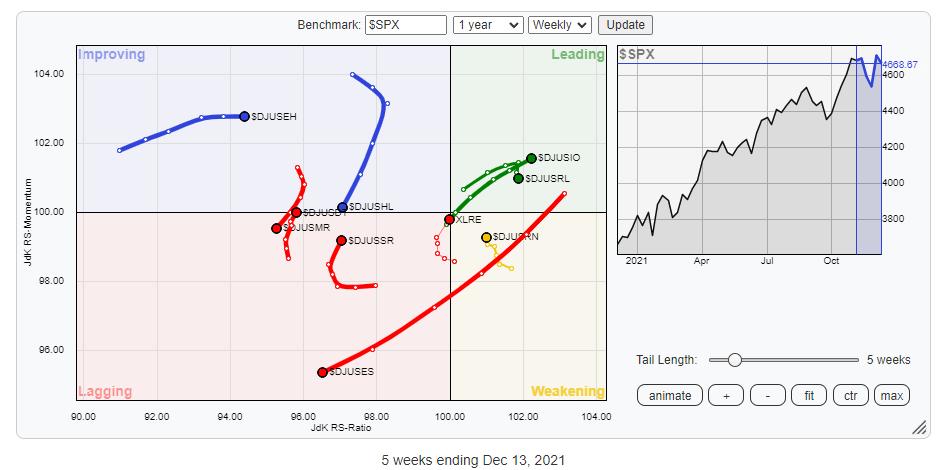
Zooming in on the groups that make up the Real Estate sector shows that there are some significant differences in rotations for the various groups. So, picking the right groups (and the right stocks in these groups) can be an important attribution to the performance of allocation to the Real Estate sector.
The longest and strongest tail in this universe is for the Real Estate Services Index ($DJUSES).
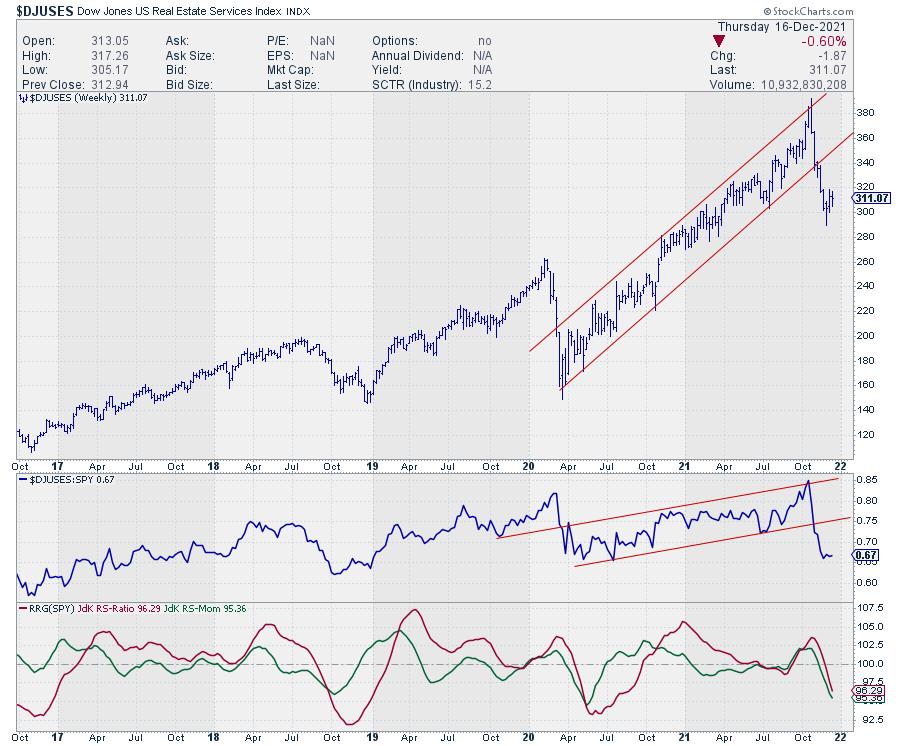
This group is rapidly deteriorating on both its price and relative graphs. In both cases, the uptrend is clearly broken. This means that any recovery rallies are now most likely selling opportunities, if not from an absolute perspective, then certainly from a relative perspective. There are better groups to be found inside the real estate sector.
This also goes for the Mortgage REITs index.
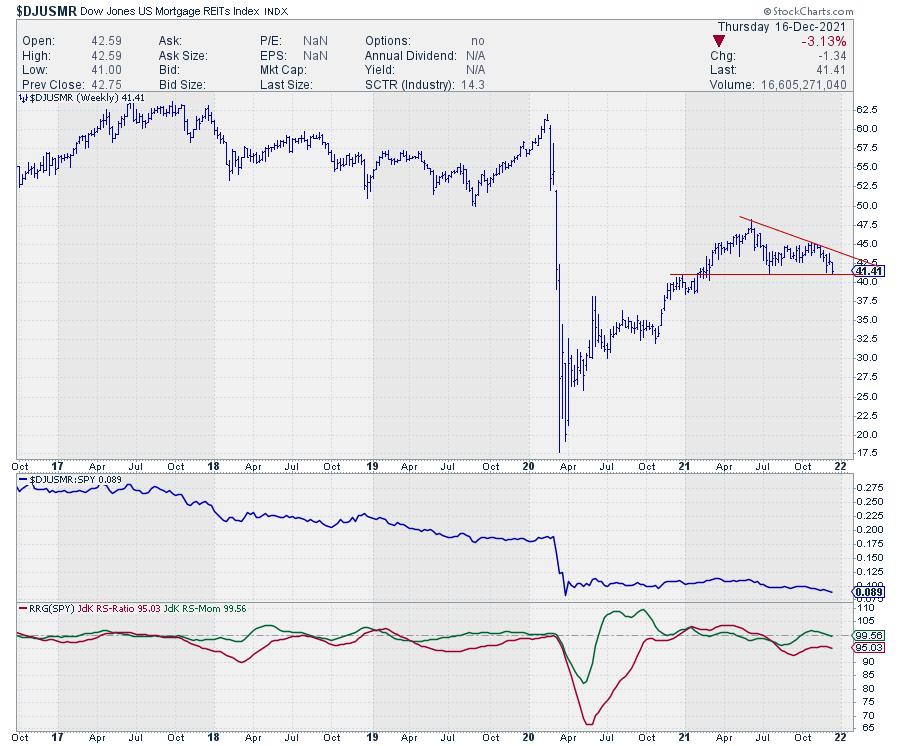
This group is resting at an important horizontal support level. The recently formed lower high indicates selling pressure is dominating. Once support around 41 gives way, an acceleration lower is expected. This will very likely cause the RRG-Lines to also accelerate lower, pushing this group deeper into the lagging quadrant.
Residential REITs seem to be offering better opportunities.
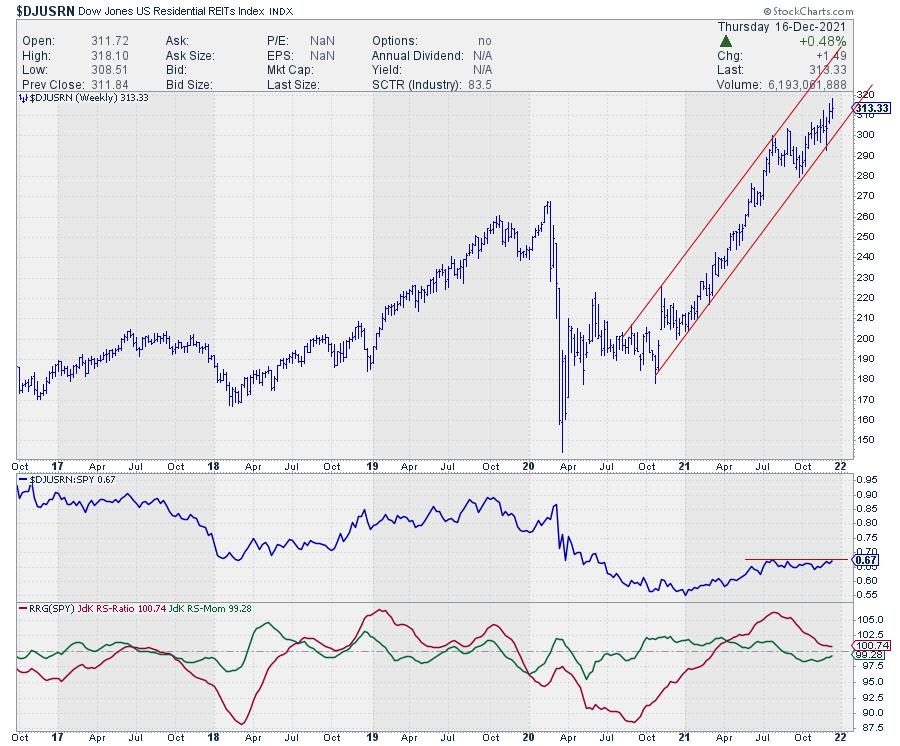
The price is still moving higher in a pretty steep channel and recently started accelerating higher off of its lower boundary. There is plenty of upside potential left within the boundaries of the channel.
The raw RS-Line is on the verge of crossing above its most recent high, which is likely to unlock new relative potential and help the tail on $DJUSRN to rotate back into the leading quadrant, becoming a leading group in the sector again.
Probably the strongest group in this sector at the moment is Industrial & Office REITs:
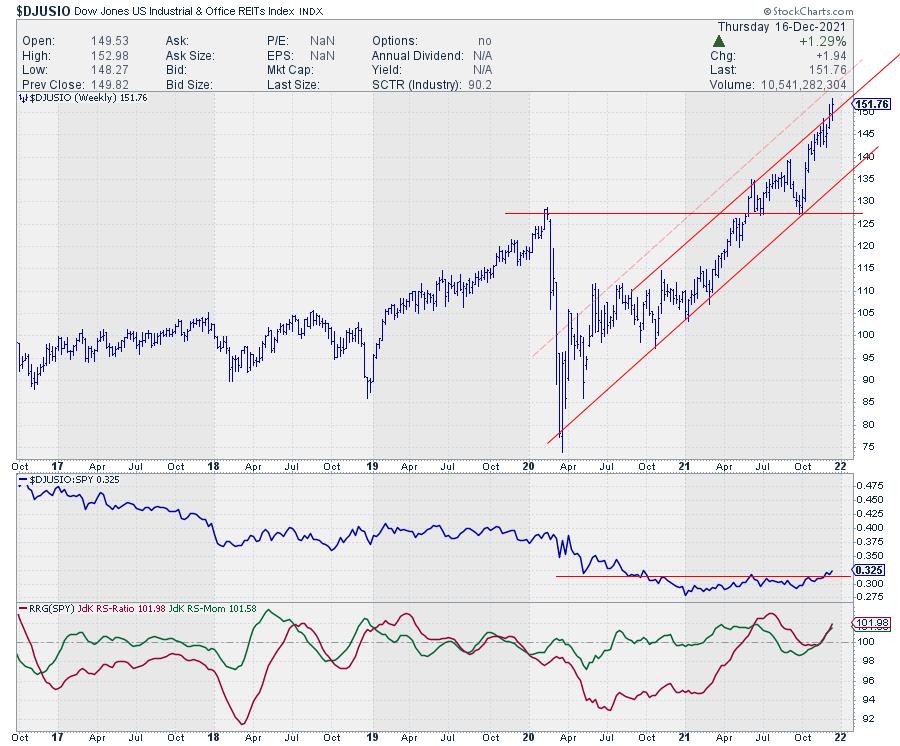
This group is now pushing above the upper boundary of its rising channel, which very often causes an even steeper acceleration higher. Relative strength has already managed to overcome horizontal resistance and is now at its highest level for this year, pulling both RRG lines further above the 100-level. This makes Industrial & Office REITs the strongest group in real estate at the moment.
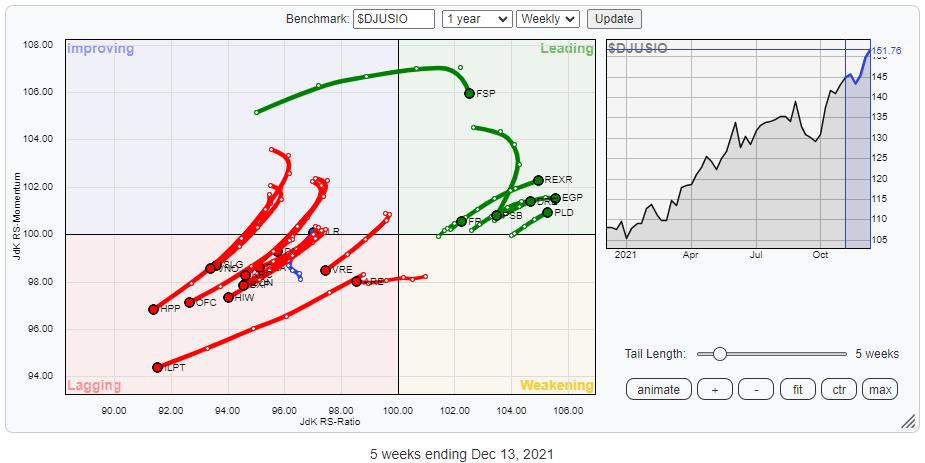
We can zoom in on the members of this group by plotting all members of $DJUSIO on an RRG; setting $DJUSIO as the benchmark, we then get the chart above. Here also, a significant split between the rotations of the individual stocks is visible.
The RRG below isolates the names of the REITs that are moving at a strong heading further into the leading quadrant, and one name that is currently rotating back up and getting back into the improving quadrant at a strong heading.
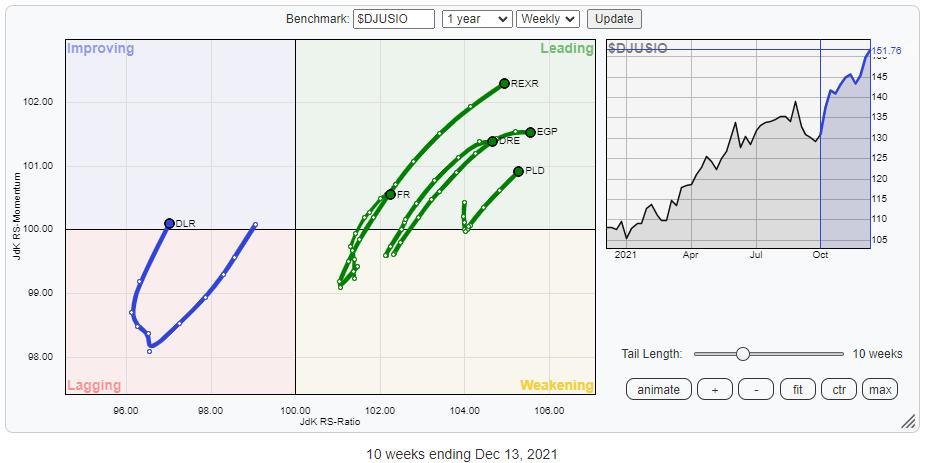
The REITs inside the leading quadrant are mostly showing very steep rising charts in terms of price. But their relative strength vs. SPY and $DJUSIO has just broken higher, which means that, even despite the steep rises, more upside is possible.
Digital Realty Trust.
From a risk/reward perspective, DLR might be the most interesting proposition in this group.
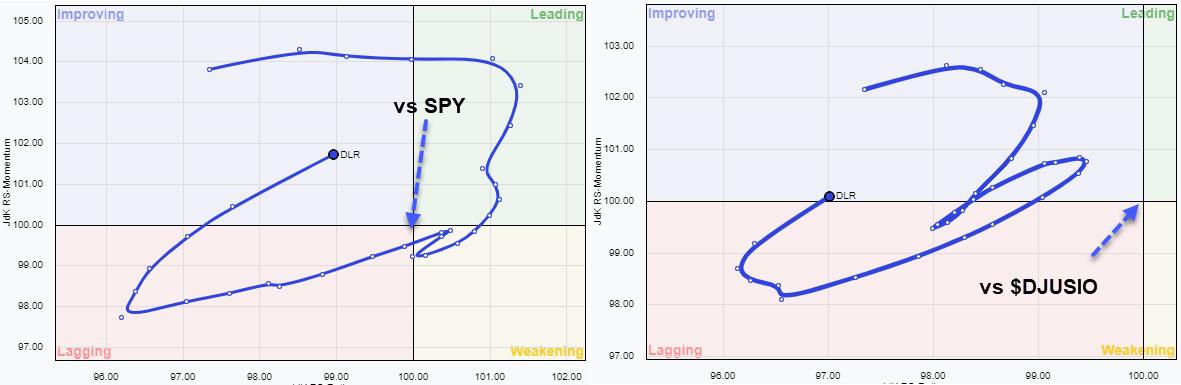
The RRGs above show the tail for DLR against SPY, as well as against $DJUSIO. Note the roughly similar rotation for both tails, but the shift to the right on the RRG vs. SPY. This is the result of the whole sector and, within the sector, this group already being a strong performer against SPY.
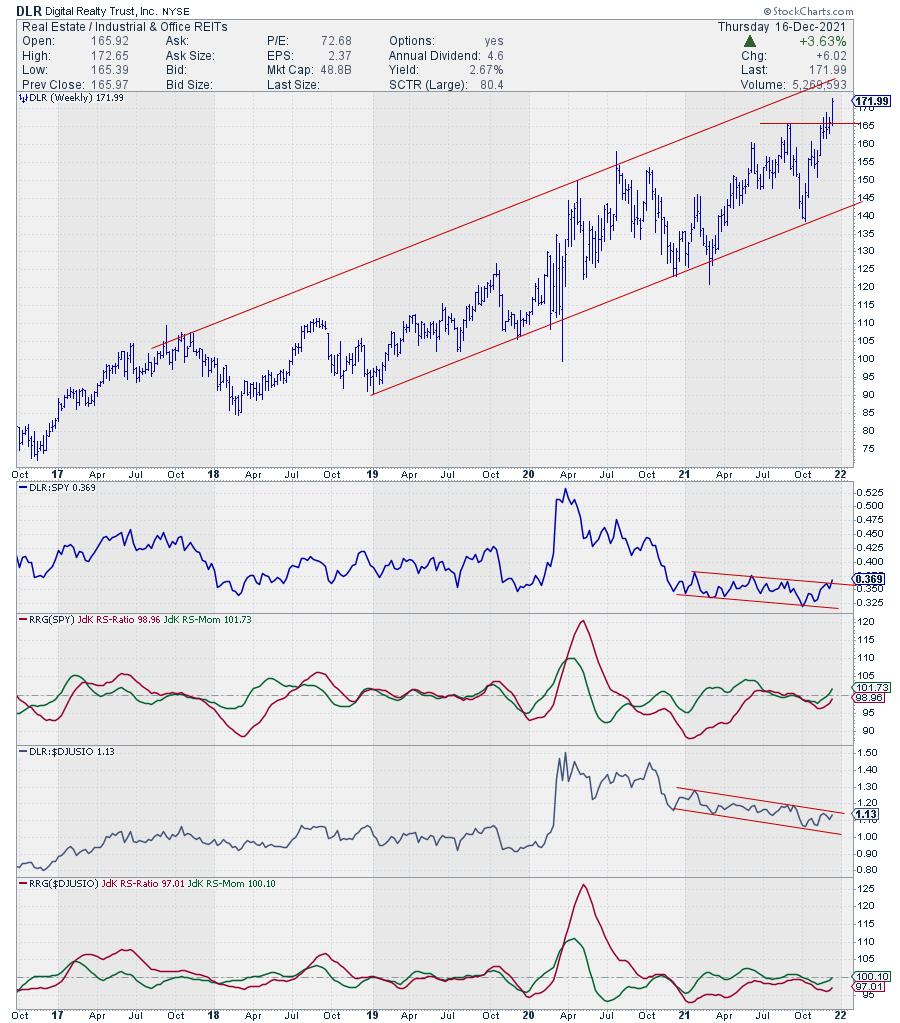
The chart above shows the price chart for DLR, but also RS and RRG-Lines, against SPY as well as RS and RRG-Lines against $DJUSIO.
The recent upward break in the price was a strong sign, signaling that further strength lies ahead. But we can get a more interesting perspective from the relative strength charts. After a long period of underperformance, DLR now seems to be turning around on a relative basis, which is putting the tail inside the improving quadrant at a strong RRG-Heading.
The combination of a recent break higher in price with the breakout level now acting as support, along with the turnaround that seems to be underway in relative strength, makes DLR an interesting chart to monitor going forward.
Julius de Kempenaer
Senior Technical Analyst, StockCharts.com
Creator, Relative Rotation Graphs
Founder, RRG Research
Host of: Sector Spotlight
Please find my handles for social media channels under the Bio below.
Feedback, comments or questions are welcome at Juliusdk@stockcharts.com. I cannot promise to respond to each and every message, but I will certainly read them and, where reasonably possible, use the feedback and comments or answer questions.
To discuss RRG with me on S.C.A.N., tag me using the handle Julius_RRG.
RRG, Relative Rotation Graphs, JdK RS-Ratio, and JdK RS-Momentum are registered trademarks of RRG Research.


