My longer-term outlook for the general market is still based on a continuing uptrend. However, over the last few weeks, defensive sectors picked up on the Relative Rotation Graph against the S&P 500.
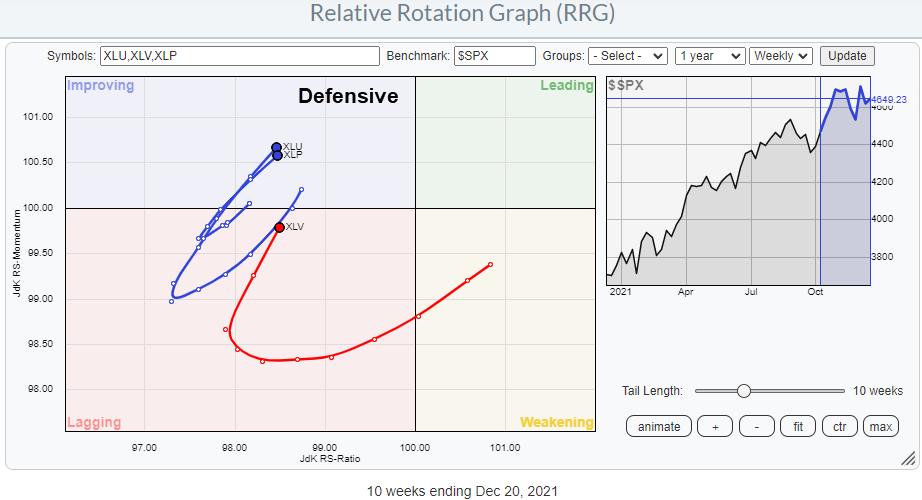
Of these three sectors, Healthcare (XLV) is the biggest in terms of market capitalization at 12.7% and bigger than Utilities (2.4%) and Consumer Staples (5.6%) together. The turn into the 0-90 degree RRG-Heading as it occurred in all three defensive sectors recently makes it worthwhile to investigate a bit deeper. In order to do so, I looked at the breakdown of the Healthcare sector into its industries, as plotted on the RRG below.
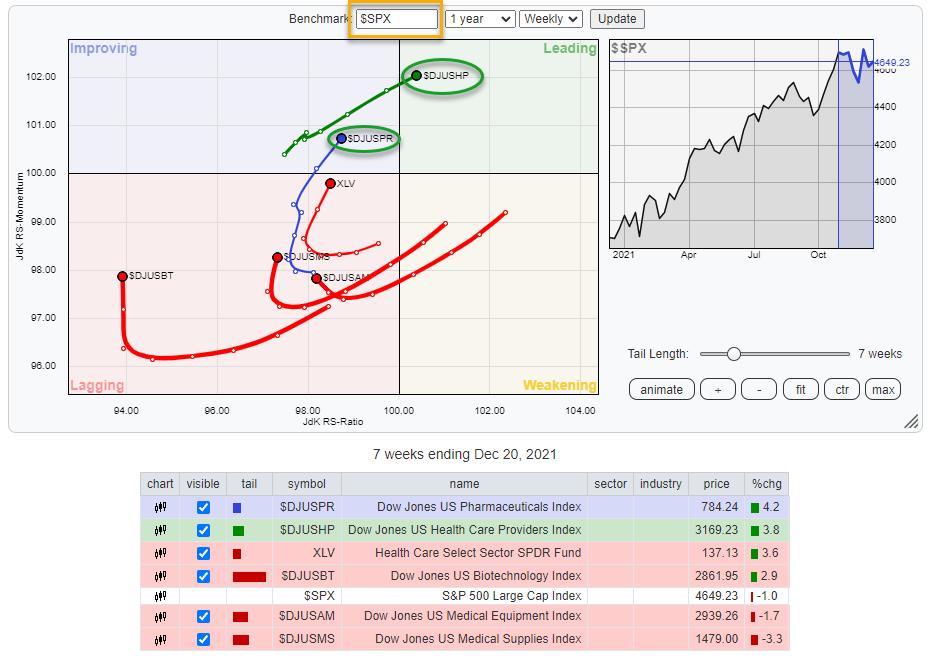
This RRG shows the industries inside the Healthcare sector against $SPX as the benchmark. The current strength for $DJUSHP, Health Care Providers (21%), and $DJUSPR, Pharmaceuticals (28%), clearly stands out. These are the two groups that are currently driving the (out-)performance for the sector.
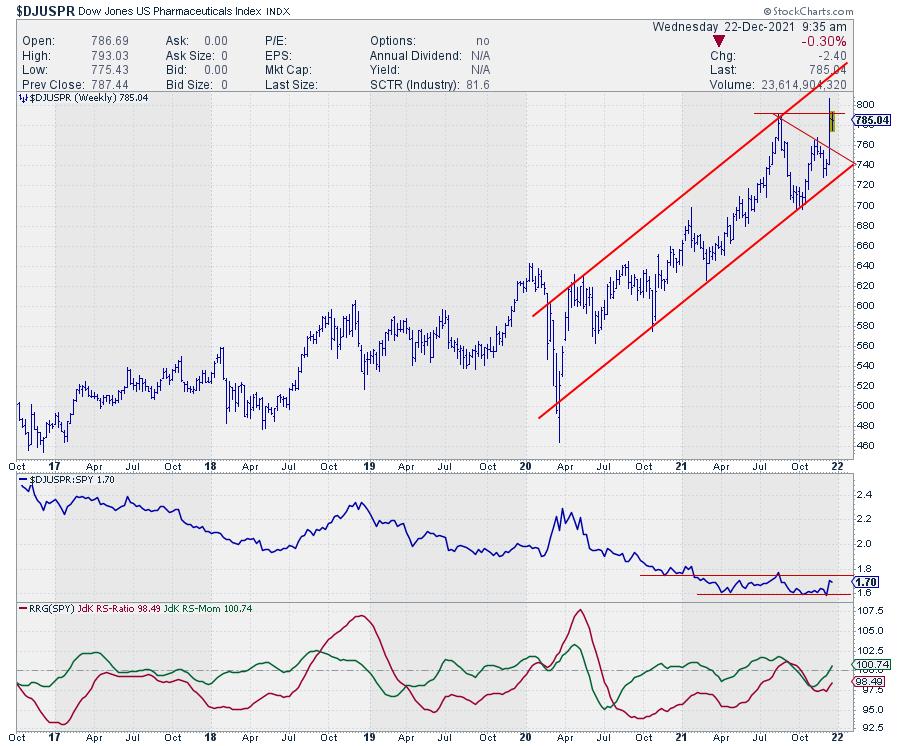
$DJUSPR is pushing against resistance coming off its previous high; a break higher will definitely add to the further outperformance for this group.
The RS-line vs. SPY has bottomed against lows that were formed earlier this year. A break out of the range will push the tail on the RRG further into the leading quadrant at an accelerating speed. The RRG-Lines are already picking up a potential new uptrend, as they are both rising with RS-Momentum>100 and RS-Ratio approaching that 100-level.
Taking the same RRG but changing the benchmark from $SPX to XLV gives us a more granular insight. The tail on Healthcare providers is flat and has started to head slightly lower in terms of JdK RS-Momentum recently. The tail on pharmaceuticals is also showing a strong RRG-Heading against its sector index.
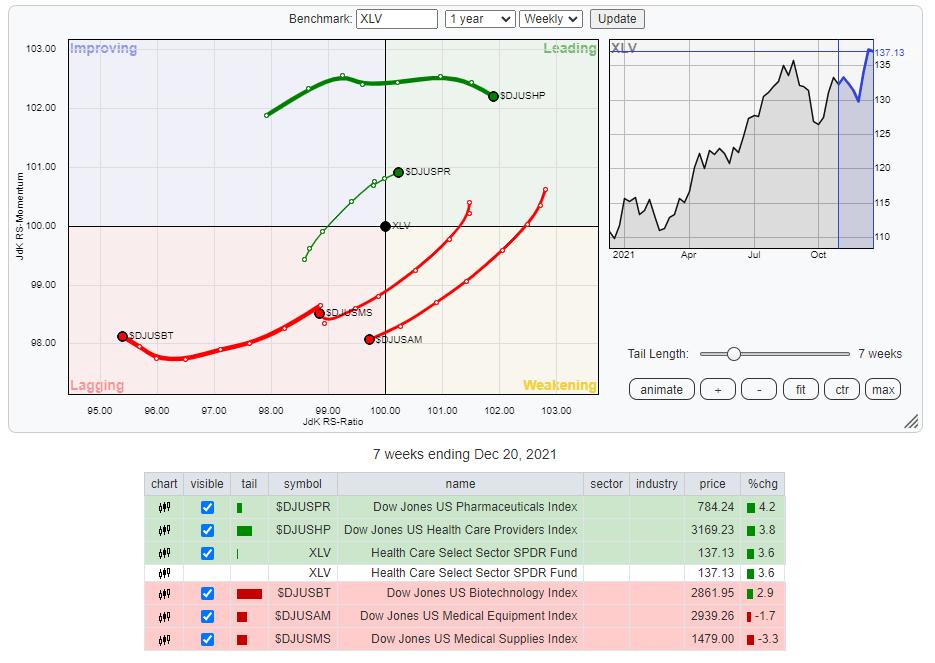
This does not make the Healthcare providers a weak group, but it looks as if they are taking a break after having led the sector higher (on a relative basis) recently. Pharmaceuticals seem to be taking over now. Following these rotations, it seems wise to have allocations to the Healthcare sector positioned in the Pharmaceuticals group.
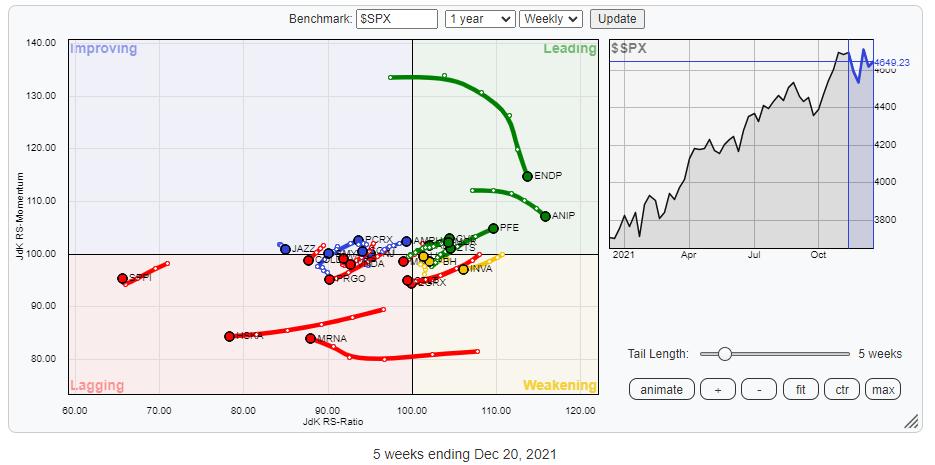
This RRG shows the stocks in the group Pharmaceuticals, which are in the S&P composite index (S&P 1500, $SPSUPX).
As you can see, there are a few tails going wide on the outside of the plot. These are ENDP, ANIP, MRNA, HSKA, and SPPI. In the next RRG, I have switched off these tails to zoom in and get a better view of what is going on inside this industry.
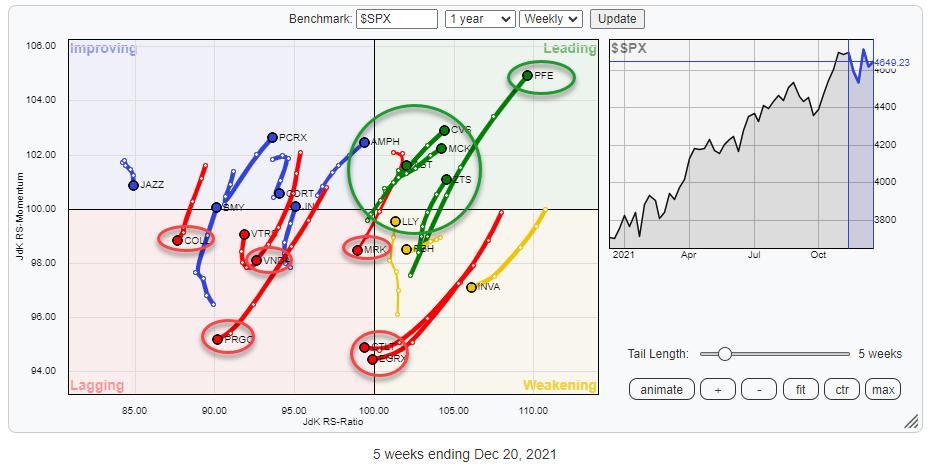
The resulting picture gives a much better view of what's going on in terms of rotation for the members of this group. The tails that are standing out in a negative way are COLL, VNDA, PRGO, MRK, CTLT, and EGRX. So, even though the group is doing well and the sector is picking up strength recently, these stocks are not able to follow. The strong names in the group/sectors are PFE, CVS, MCK, ZTS and ABT inside leading, AMPH in improving and LLY inside weakening.
Switching the benchmark to XLV gives this picture:
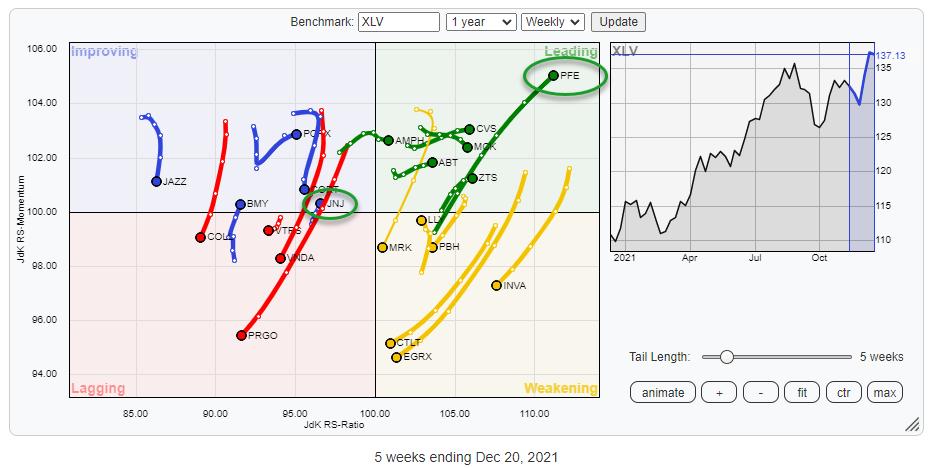
PFE is here the real outsider and one of the larger stocks in the group, with a very strong tail at a strong RRG-Heading pushing further into the leading quadrant. Given the strong move that is already underway for a while, I would probably pass on new entries in PFE (hold for sure), but check out opportunities in the other stocks inside the leading quadrant and potentially LLY inside weakening, which is traveling back up.
A more risky opportunity may be arising in JNJ, an even bigger name in terms of the market cap than PFE. At the moment, it's still at the left side of the RRG on a very short tail, but it has recently starting to travel at a positive RRG-Heading and enter the improving quadrant.
Julius de Kempenaer
Senior Technical Analyst, StockCharts.com
Creator, Relative Rotation Graphs
Founder, RRG Research
Host of: Sector Spotlight
Please find my handles for social media channels under the Bio below.
Feedback, comments or questions are welcome at Juliusdk@stockcharts.com. I cannot promise to respond to each and every message, but I will certainly read them and, where reasonably possible, use the feedback and comments or answer questions.
To discuss RRG with me on S.C.A.N., tag me using the handle Julius_RRG.
RRG, Relative Rotation Graphs, JdK RS-Ratio, and JdK RS-Momentum are registered trademarks of RRG Research.


