Big drops call for big recoveries, but it's dangerous to watch these moves in isolation.
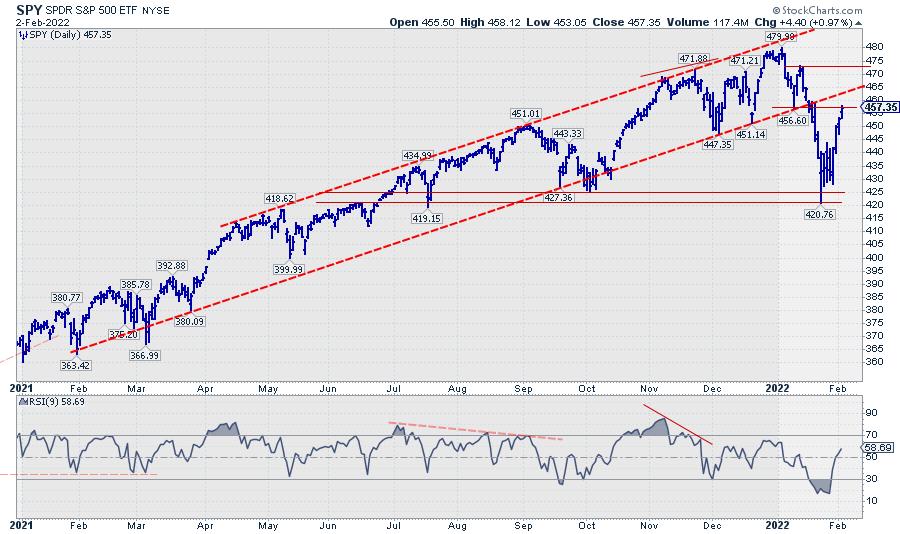
The S&P 500 dropped roughly 60 points from its peak at 480 at the start of the year to find a low recently around 420. Out of that low, the market rallied 40 points. In percentage terms, that equals a drop of around 12.5% and a rally of roughly 10%, a little less. I am NOT KIDDING when I tell you that I have met people who wanted to convince me that the market was thus only down 2.5%. We all know that a 12.5% drop from a high level is very different from a 10% rally out of a much lower level... Don't we?
This S&P chart is in my ChartList that I use in Sector Spotlight on a regular basis. The big problem that is staring you in the face from this image is the break below the rising support line, which marked the lower boundary of the rising channel the S&P has been moving in. The initial drop from the high caused a lot of damage to that chart and to that uptrend. The rhythm of higher highs and higher lows is now broken, and we need to set up a new starting point for higher highs and higher lows to get back into a new uptrend (on the daily chart, that is).
On this daily chart, a series of lower highs and lower lows has already started, and we can see how old support levels are now showing up as resistance on the way up. This means that the "ease of movement" is now on the downside rather than to the upside.
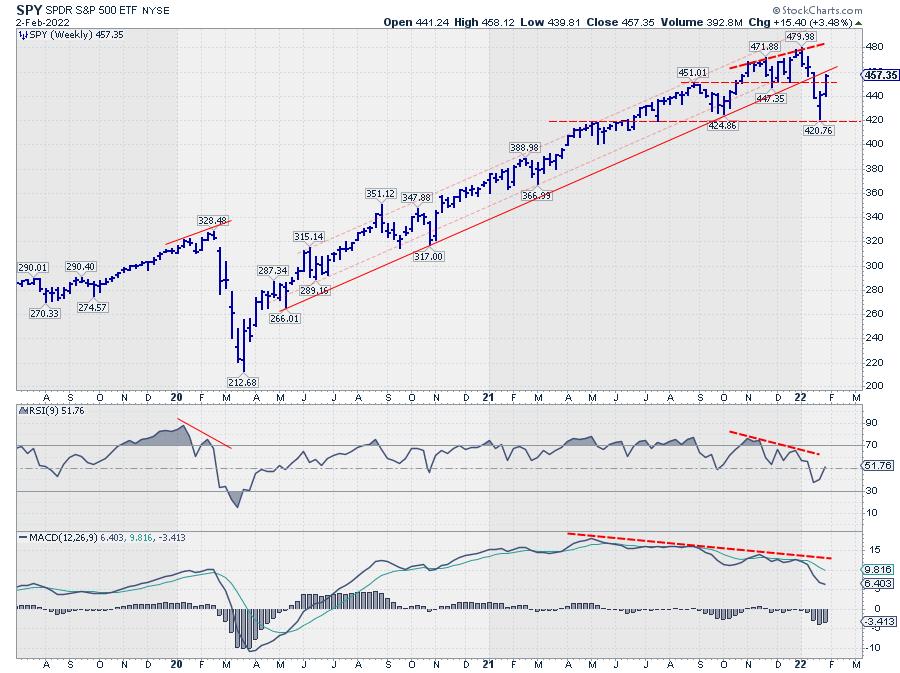
If we look at the weekly version of this chart, we can see that, here also, the rhythm of higher highs and higher lows is broken. But a new series of lower highs and lower lows has not started yet. However, here also, it is clearly visible that damage has been done. And, whatever happens next, this damage needs time to recover.
Even if the most recent low at 420 will hold, it is highly unlikely that the market will shoot higher from here as if nothing has happened.
From a Sector Rotation Perspective
Does the current sector rotation give us any pointers?
For a few months, I started to break down sectors into three groups, instead of two: Cyclical (Offensive), Defensive, and Sensitive. One of the watchers of Sector Spotlight pointed me to this approach by Morningstar, and it actually makes sense. At least IMHO. Also, to get a better grip on what's happening in the sectors, I started to use the Equal Weight Sectors more to eliminate the big impact of some mega-cap stocks on the performance of cap-weighted sectors.
BTW, don't be fooled by the idea that using EW sectors means that every sector has the same weight in the S&P 500. The individual stocks in the S&P are of equal weight. When this is translated to sectors, that does not mean that every sector is equal weight. If you want to read more about that; I have written a ChartWatchers article on this subject in May last year.
Cyclical
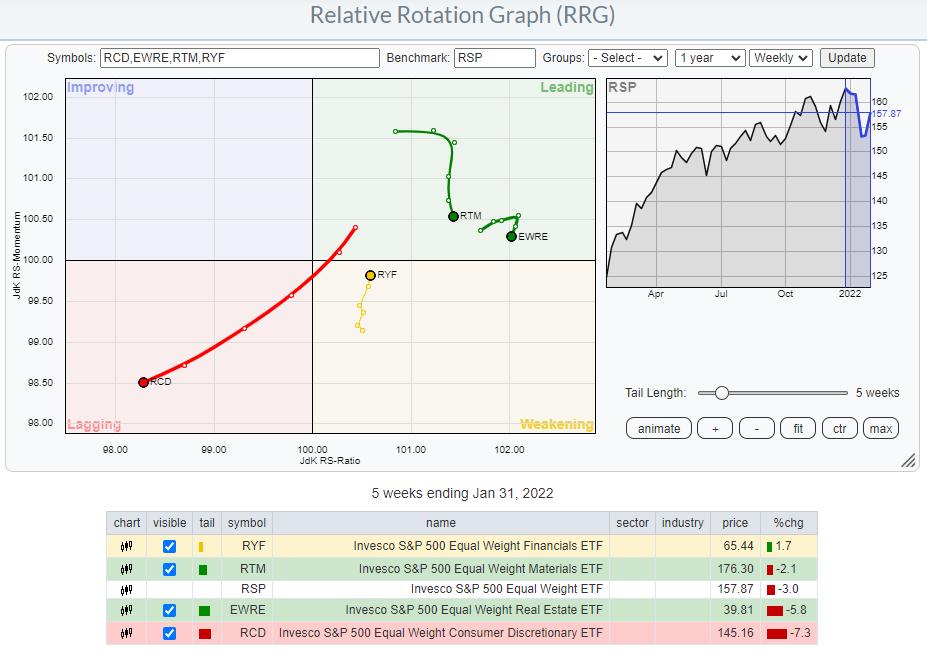
This Relative Rotation Graph shows the recent rotation fore the groups of cyclical sectors (Equal-weight). It's pretty clear that these tails are not representing a group of sectors that is driving a strong bull market.
Materials and Real-Estate are inside the leading quadrant but have already started to roll over. So at least they are taking a break from their prior up-moves. Consumer Discretionary is nose-diving further into the lagging quadrant, confirming its recent weakness.
The only sector that does reasonably well in this group is Financials, which are crawling back up towards the leading quadrant, albeit at a very short tail.
Defensive
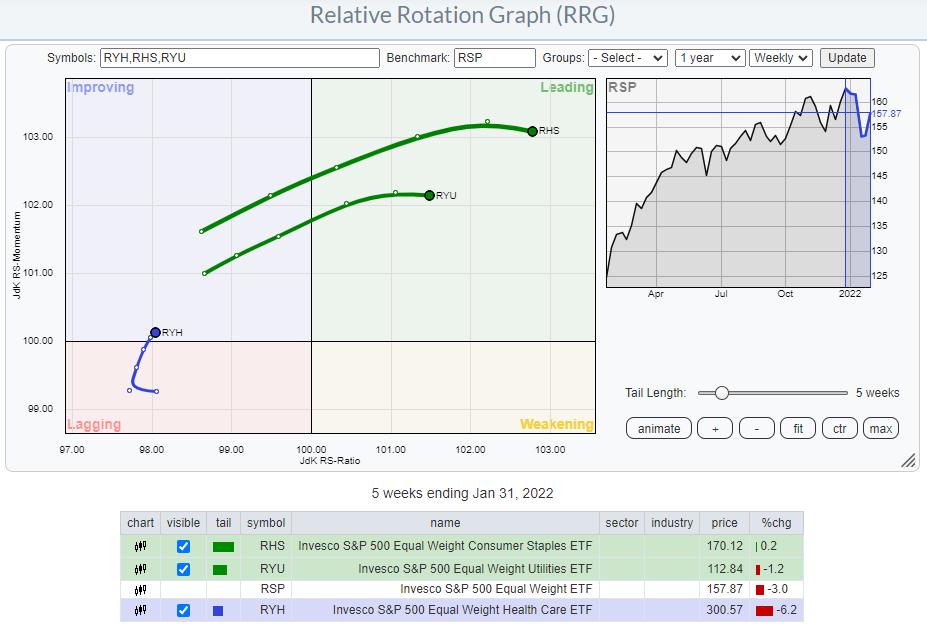
The general direction for the tails in the defensive group is much clearer. Staples and Utilities are clearly inside the leading quadrant, powered by long tails. The performance during the week so far, the last segment of these tails, shows a slight slow-down, but the direction and the gain in terms of relative strength (JdK RS-Ratio scale) is clearly there. Healthcare has been lagging in recent weeks/months, but now seems to be picking up again as it is moving from lagging into improving.
This means that all defensive sectors are on a positive rotational trajectory, which is something that does not really rhyme well with a full-fledged bull market.
Sensitive
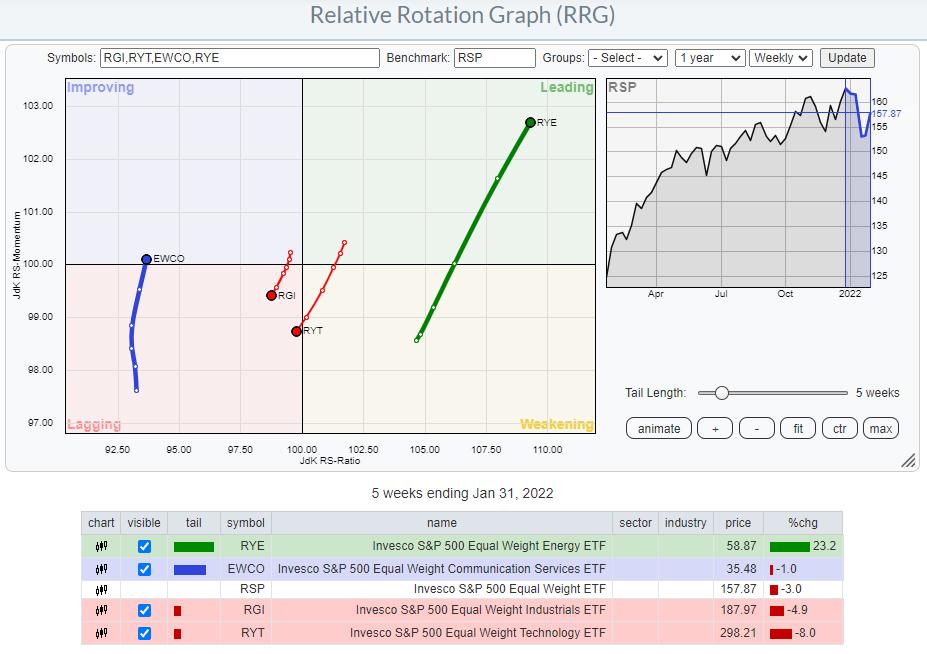
In the groups of sectors that are classified as sensitive, we see Energy standing out, with a long tail shooting further into the leading quadrant. Technology and Industrials are heading(further) into the lagging quadrant, while communication services is picking up relative momentum (JdK RS-Momentum scale) but not much relative strength (JdK RS-Ratio scale).
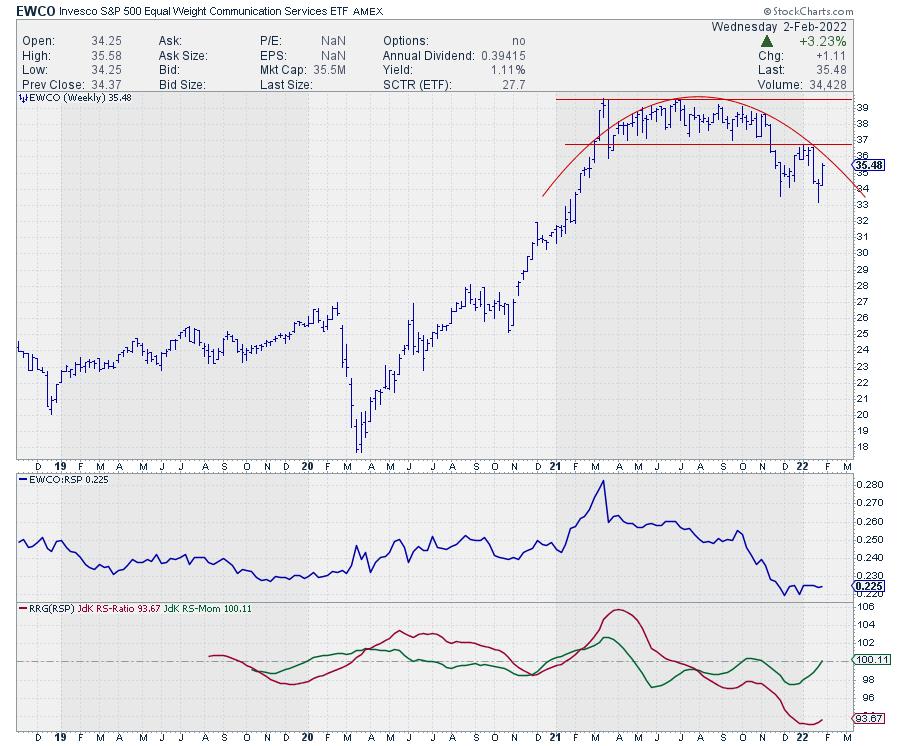
Given the large and completed top-formation on the price chart, in combination with the weak relative strength line and the low reading on the RS-Ratio scale (vs. RSP), I believe there is a very good chance that EWCO will complete a rotation on the left-hand side of the graph. So lagging-improving-lagging. Which will bring 3 out of 4 sensitive sectors at a negative rotation.
With defensive sectors leading the market at the moment and both cyclical and sensitive sectors turning more negative, there are enough reasons to remain very careful with this market. Downside risk largely outweighs upside potential, which is a situation most investors don't really like too much.
Julius de Kempenaer
Senior Technical Analyst, StockCharts.com
Creator, Relative Rotation Graphs
Founder, RRG Research
Host of: Sector Spotlight
Please find my handles for social media channels under the Bio below.
Feedback, comments or questions are welcome at Juliusdk@stockcharts.com. I cannot promise to respond to each and every message, but I will certainly read them and, where reasonably possible, use the feedback and comments or answer questions.
To discuss RRG with me on S.C.A.N., tag me using the handle Julius_RRG.
RRG, Relative Rotation Graphs, JdK RS-Ratio, and JdK RS-Momentum are registered trademarks of RRG Research.


