
The RRG below shows the tails for the DJ Growth and -Value indexes against the DJ US index. In January of this year, the Value tail crossed over into the leading quadrant while, at the same time, Growth crossed into the lagging quadrant.
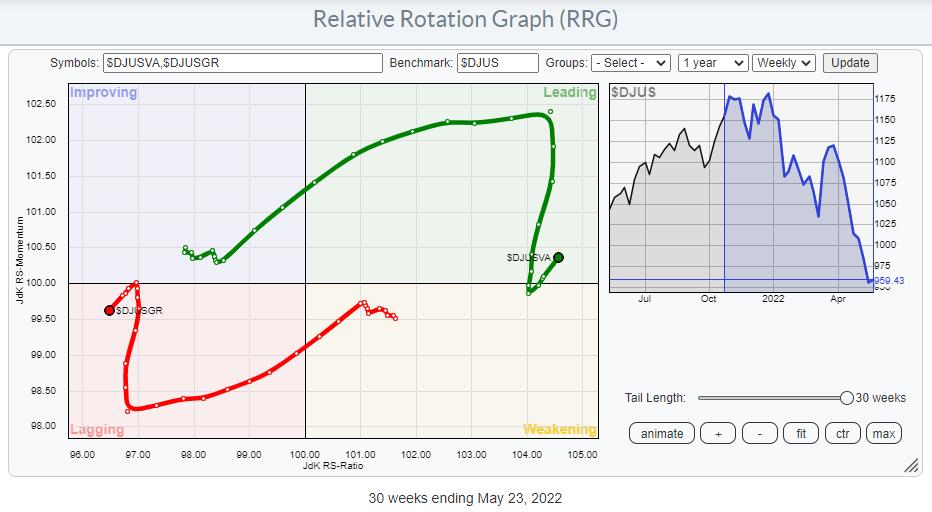
After a strong stint, the tails started to roll towards each other in March, signaling a recovery for the beaten-down growth stocks. This lasted until 3-4 weeks ago, when the tails very sharply hooked back into their original direction of travel. This move underscores the current strength of Value over Growth.
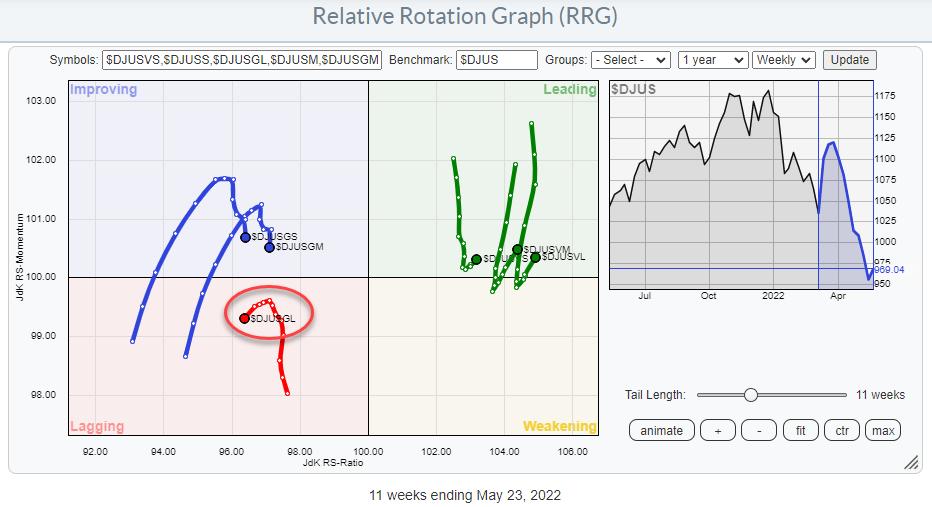
The second RRG above basically shows the same rotation of Growth vs Value, but now both groups are broken down into Large-, Mid- and Small-Caps.
On this chart, we can make the interesting observation that, on the value side, all three segments of market capitalization are moving more or less in sync and are following similar rotational paths. On the growth side, however, there is a clear disconnect between the rotation of Growth Large-Cap and the Small-/Mid-Cap segments. Large-Cap Growth is leading the way lower, followed by the Mid- and Small-Cap Growth segments, while all value segments just rotated back into a positive RRG-Heading and are now traveling further into the leading quadrant.
This observation also lines up with the weak picture for the offensive (Growth) sectors inside the S&P 500. Consumer Discretionary, Information Technology and Financials are all inside the lagging quadrant. Clearly, there's a lot of mega-cap stocks in that cross-section of Growth sectors.
Large-Cap Growth
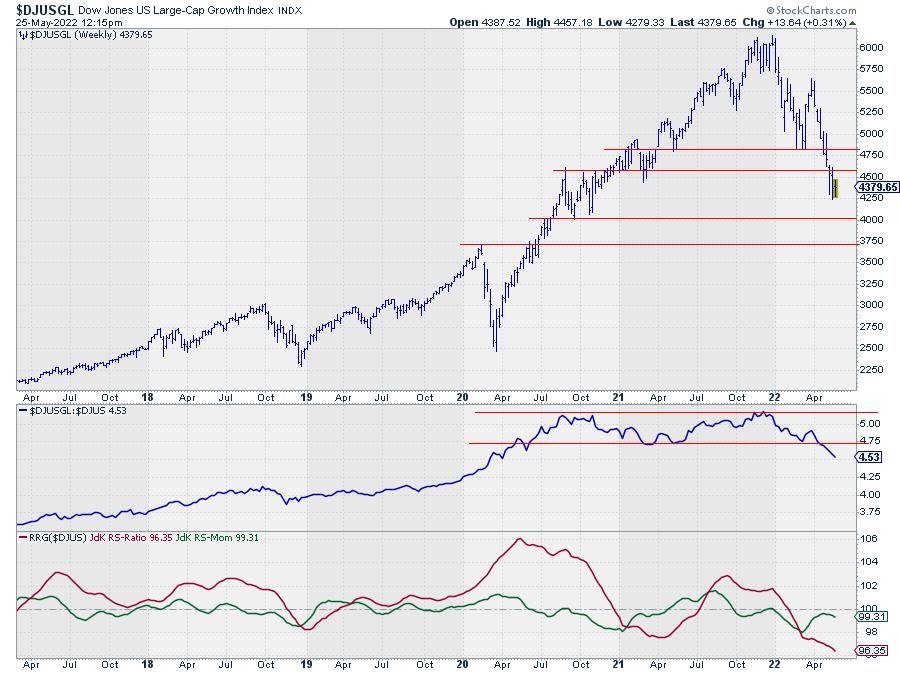
On the price chart for $DJUSGL the breakdown from the highs that were set at the end of last year is clearly visible. So is the rhythm of lower highs and lower lows. But maybe even more important is the crisp and clear break from the sideways range in relative strength, which is just about now starting to accelerate. This combination makes the outlook for Large-Cap Growth stocks look very weak in the coming weeks.
Upside potential in both price and relative terms is very limited for Large Cap Growth stocks, while there is considerable downside risk.
Large-Cap Value
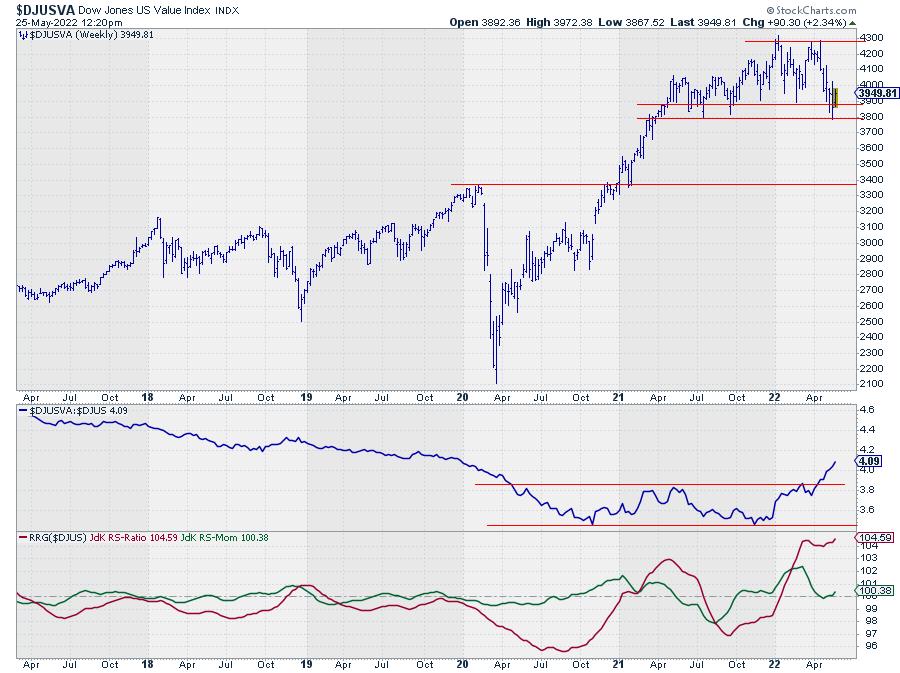
The Value index (Large) shows a very different picture. In price terms, the index is still holding up well above horizontal support between 3800-3900. The resulting Relative Strength chart is the opposite of what we just saw in Growth: an upward break from a long base with an acceleration just getting underway.
For this segment in the market, the risk is fairly limited (to the lower boundary of the range near 3800-3900) while there is quite a bit of upside potential within the boundaries of the trading range. In relative terms, the former top of the trading range should start to act as support, while the long-term downtrend has turned up, creating plenty of upside potential for the RS-Line to rise further.
This is the Knock-Out Chart
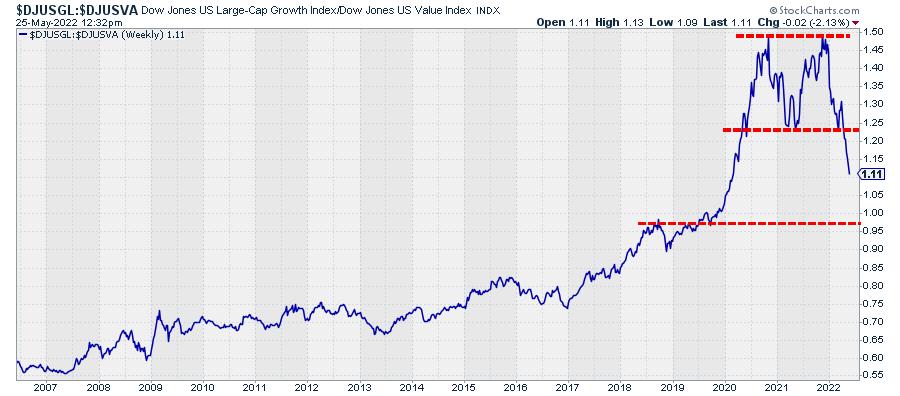
Plotting the 1-1 comparison between Growth and Value gives the chart above. For me, that is one massive double top that just got completed when the ratio broke below its early 2021 low.
The completion of this major top formation marks the end of a very long period of Growth dominance. But also, the clear boundaries of the formation allow us to peg a (minimum) target from the breakout, which is around 0.25 (the height of the formation) projected below the breakout level. That comes out just below 1.00, which is still quite a bit lower from current levels.
All in all, I'm afraid that Value has knocked out Growth for the time being and that there are a few more punches left to deal with. And if and when this fight slows down and settles, it will take quite a bit of time for Growth to recover.
Be careful out there!! #StaySafe, --Julius
Julius de Kempenaer
Senior Technical Analyst, StockCharts.com
Creator, Relative Rotation Graphs
Founder, RRG Research
Host of: Sector Spotlight
Please find my handles for social media channels under the Bio below.
Feedback, comments or questions are welcome at Juliusdk@stockcharts.com. I cannot promise to respond to each and every message, but I will certainly read them and, where reasonably possible, use the feedback and comments or answer questions.
To discuss RRG with me on S.C.A.N., tag me using the handle Julius_RRG.
RRG, Relative Rotation Graphs, JdK RS-Ratio, and JdK RS-Momentum are registered trademarks of RRG Research.


