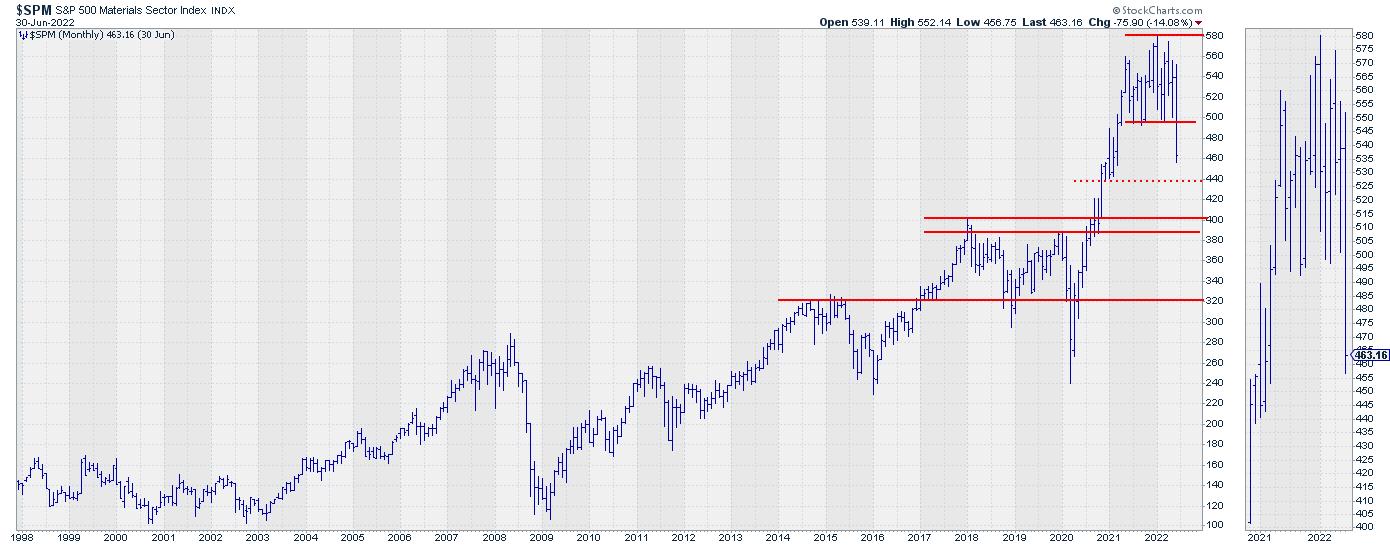
The chart above is the monthly chart for the materials sector $SPM, which I discussed in this week's episode of Sector Spotlight while going through the completed monthly charts for June.
Materials Sector Completing Big Top Formation
$SPM especially stands out, as the sector very clearly completed a large top-formation following a strong rally, which started in 2020 and started stalling in the middle of 2021. The break below the horizontal support level around 495 was the trigger for a further move lower.

The weekly chart for the materials sector above shows a more detailed picture. After breaking horizontal support, the initial decline is underway with a low, so far, at 447.50. Given the speed and the steepness of the recent decline, it is very well possible that we will see a bounce back up in the near future. But, as long as the horizontal resistance near 495 remains intact, such rallies have to be judged as recoveries within a downtrend.
All Metals Groups Showing Weak Rotation on RRG
From a relative perspective, the materials sector has tested resistance in the area of the 2021 relative peak from which it started declining. This has caused the RRG-Lines to roll over and JdK RS-Momentum has already pushed below 100, causing the tail to rotate into the weakening quadrant.
Breaking down the Materials sector into its sub-groups gives the rotational picture in the RRG below.
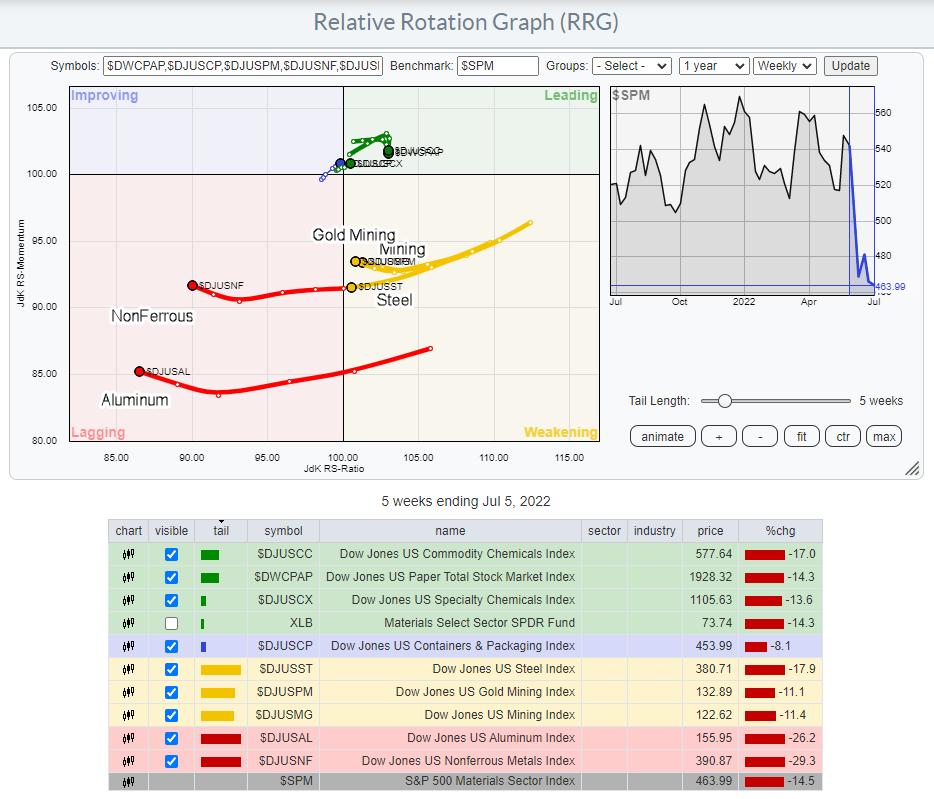
This Relative Rotation Graph shows the groups inside the sector, and it is providing an interesting picture. Basically, the sector is split into two groups, those being all groups related to metals and all others (Chemicals, Paper). The groups related to metals are catching the attention. All of them are inside weakening or lagging, but, more importantly, they are all heading lower on the RS-Ratio scale, suggesting more weakness lies ahead.
These metals-related groups are also far away from the benchmark (center of the chart) compared to the other groups, which are concentrated close(r) to the benchmark and all but one inside the leading quadrant. This means that the current weakness of the sector can largely be attributed to the weakness in the metals groups and less so to the others.
Aluminum
Going over the individual charts for the group, the Aluminum index attracted my attention.
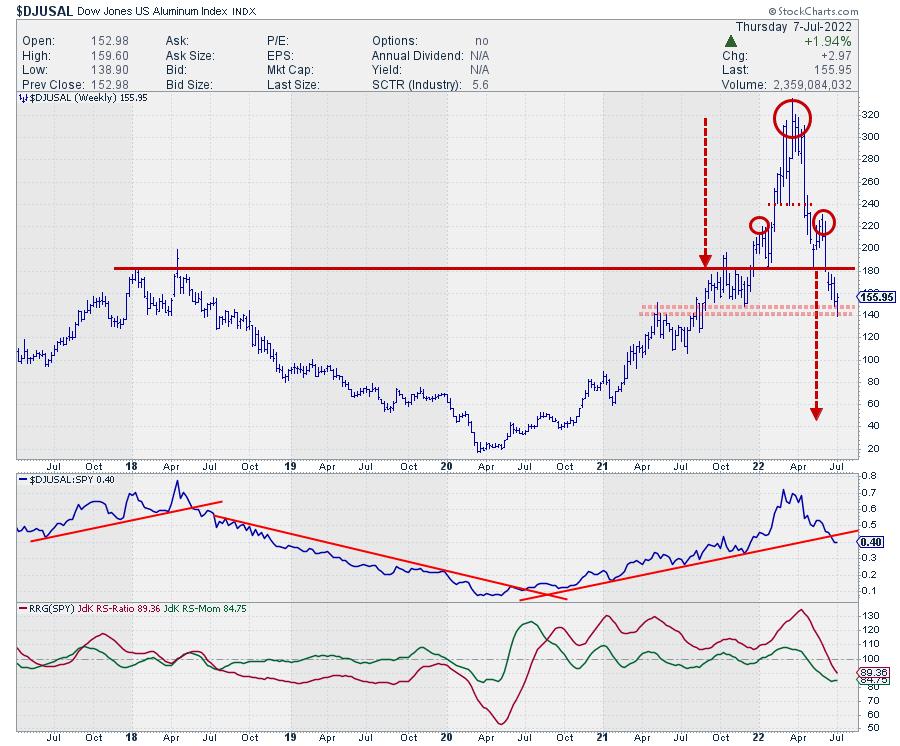
At the start of this year, Aluminum broke above resistance coming off multi-year highs near 180, then shot up to a high around 320, before coming back down to 180 and breaking below it again just a few weeks ago. The price behavior above that 180 level looks like an H&S top-formation. Applying basic TA rules, I get a target price of around 40, which is seriously lower than where we currently are.
These are the situations that make me go hmmm, and I start questioning myself. Am I missing something, does it make sense, does it fit in the context, etc., etc? I am quite reluctant to blatantly scream that Aluminum could drop $100 or ~65% from current levels... At the very least, I want to dig a little deeper.
In this case, that means pulling up a real long-term chart to figure out where we are in terms of all-time-high levels, etc.
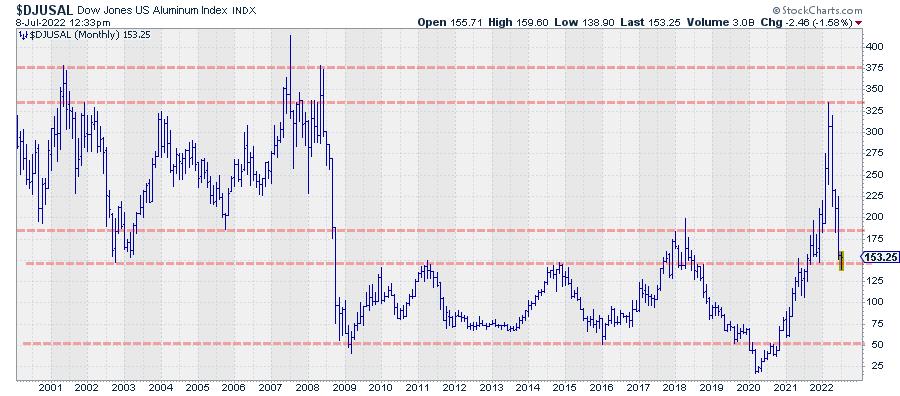
And that chart is very interesting, IMHO. First of all, the parabolic rise from 2020-2022 (25 to 325) did NOT bring Aluminum to a new all-time high. $DJUSAL traded around 375 in 2002, 2007 (spiked) and 2008. But the projected target area, somewhere around 50, is also not strange, as it traded there numerous times since the sharp drop in 2009.
The way I read this chart is that there are two big ranges that offer support or resistance. The first is at the top between roughly 330-375. The most recent peak was formed against the bottom of that range. The second important range is between 145-185. As we speak, Aluminum is testing the lower boundary of that support range.
In the near term, this area may provide enough support for Aluminum to bounce a little, but the large H&S is expected to start weighing in sooner or later and push $DJUSAL below 145, which will open up a huge downward risk.
Based on the historical performance and technical behaviour, $50 for Aluminum is absolutely possible!
No matter what happens, at the moment, Aluminum has very limited upside and a huge downside risk, making it a very risky investment. With more metals-related groups in the Materials sector, it is very difficult to see $SPM turning around and moving significantly higher in the coming weeks.
#StaySafe and Have a Great Weekend, --Julius
Julius de Kempenaer
Senior Technical Analyst, StockCharts.com
Creator, Relative Rotation Graphs
Founder, RRG Research
Host of: Sector Spotlight
Please find my handles for social media channels under the Bio below.
Feedback, comments or questions are welcome at Juliusdk@stockcharts.com. I cannot promise to respond to each and every message, but I will certainly read them and, where reasonably possible, use the feedback and comments or answer questions.
To discuss RRG with me on S.C.A.N., tag me using the handle Julius_RRG.
RRG, Relative Rotation Graphs, JdK RS-Ratio, and JdK RS-Momentum are registered trademarks of RRG Research.


