I don't like it when parts of a puzzle don't match. You just don't get a clear picture.
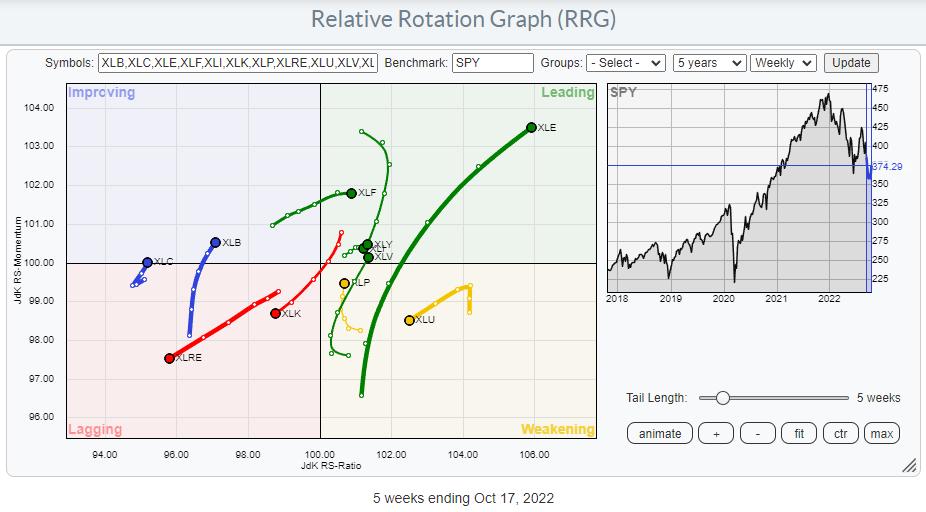
As participants in the markets, we are trying to solve the puzzle of the markets every day/week/month, and at the start of every new period, someone tosses all the pieces around, and you have to start all over again. Looking at the current sector rotation on a Relative Rotation Graph and the price chart of SPY side by side, we see a confusing picture at the moment. As if someone has just messed up all the pieces again. There is no coherent image.
SPY Weekly
Let's start with the chart of SPY on a weekly basis.
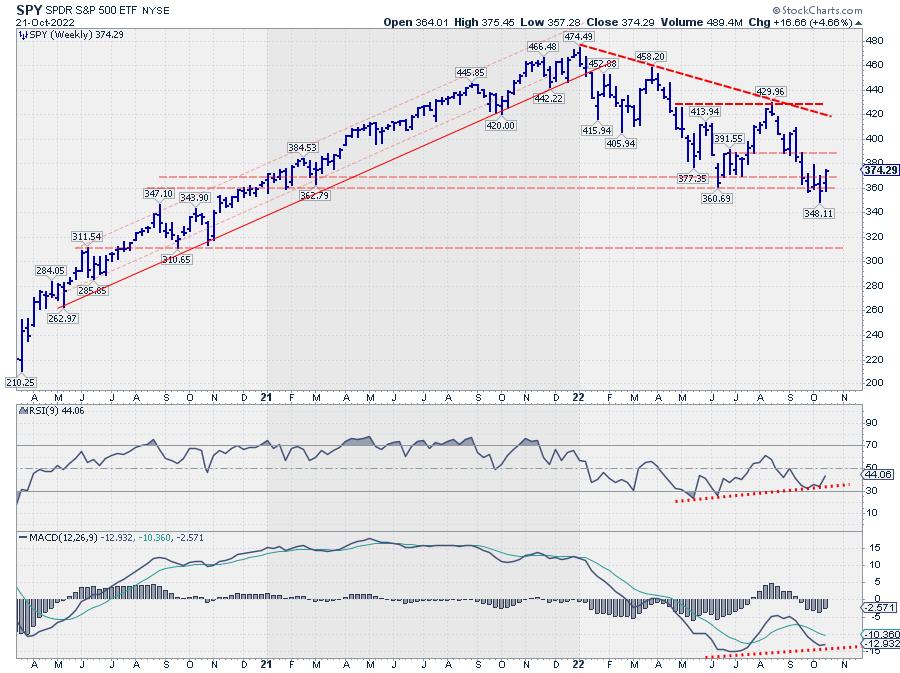
Over the last four weeks, SPY has been testing support in the 360 area. Two weeks ago, SPY dipped to a low of 348 during the week, but managed to close back up towards the 360 area, followed by a further rally last week, bringing the index back to a close at 374.
The rhythm of lower highs and lower lows is still present on this weekly chart, but, given the steep dip and the distance from the upper boundary of this falling trend, there is quite some room for the market to rise without violating this downtrend.
We can find some support for a rally from the positive divergences between price and RSI and MACD. I am not the biggest fan of a divergence in the RSI, where the indicator reached levels above 50 again between the two connected lows, but it's there.
In the MACD, a divergence seems to be setting up. It still needs a bit of work, but the early signs are there, and here the peak in between the two (possible) lows has not pushed back above 100, which makes it a valid divergence (at least in my mind).
SPY Daily
We can see more detail when we zoom in on to the daily chart.
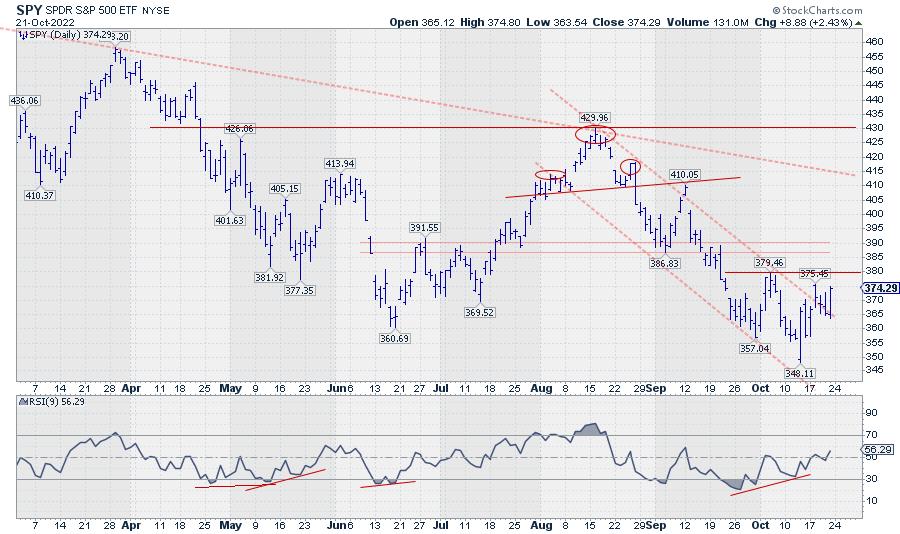
The falling trendline currently running around 415 is the same line that connects the last three major peaks on the weekly chart. The struggle around the 360 support level over the last weeks can be seen in more detail on this chart and could eventually become a double bottom. The trigger to complete this formation would be a break of 380.
The positive divergence between the price and the RSI is a bit more pronounced on this daily chart. In last week's episode of Sector Spotlight, I spoke about the need for a trigger to "activate" this divergence. That trigger came last week when the price managed to break the falling trendline. This move, at least, signaled that the imminent danger of a rapid breakdown had faded for the time being.
For the near-term, signs are pointing to the upside for SPY. Breaking 380 will be the confirmation for a further move higher. Although there is still quite some resistance on the way up, SPY could reach the falling resistance line that currently comes in around 415.
This rally could tell us a lot more about the current state of the market. When SPY can reach that overhead resistance area near 415 relatively easily, it tells us there is some serious underlying buying power. In the case that the 415 area cannot be reached, and a new lower low (weekly chart) is being put into place, it tells us that sellers are coming back early. The level of a new lower high will tell us how aggressive sellers are.
That's All Nice, BUT...
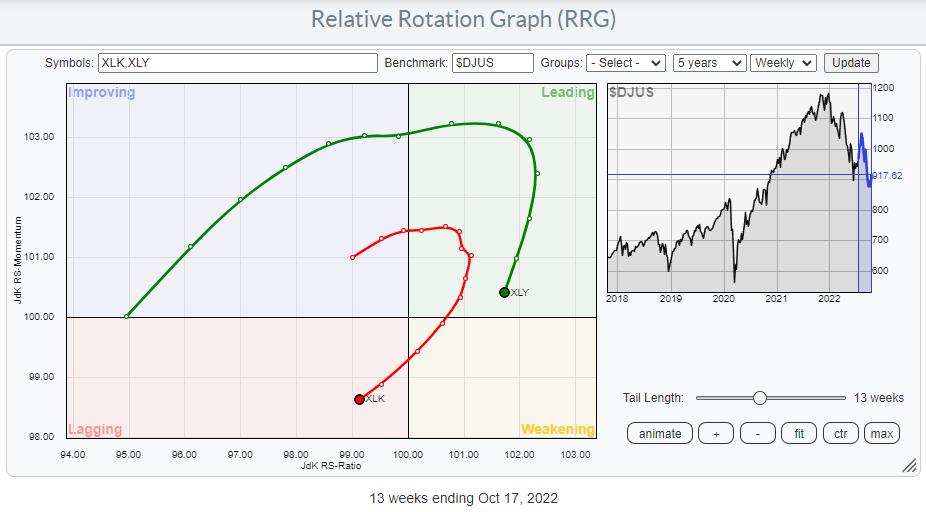
When I look at the current sector rotation, and more specifically, the rotations for Consumer Discretionary and Technology, things are not looking too good.
Both trails are clearly at a negative RRG-heading. Technology has already reached the lagging quadrant, pushing further into negative territory. Discretionary is still inside the leading quadrant, but rapidly heading toward weakening. At the minimum, we can conclude that these sectors are not likely to contribute to SPY's performance in a positive way in the near term.
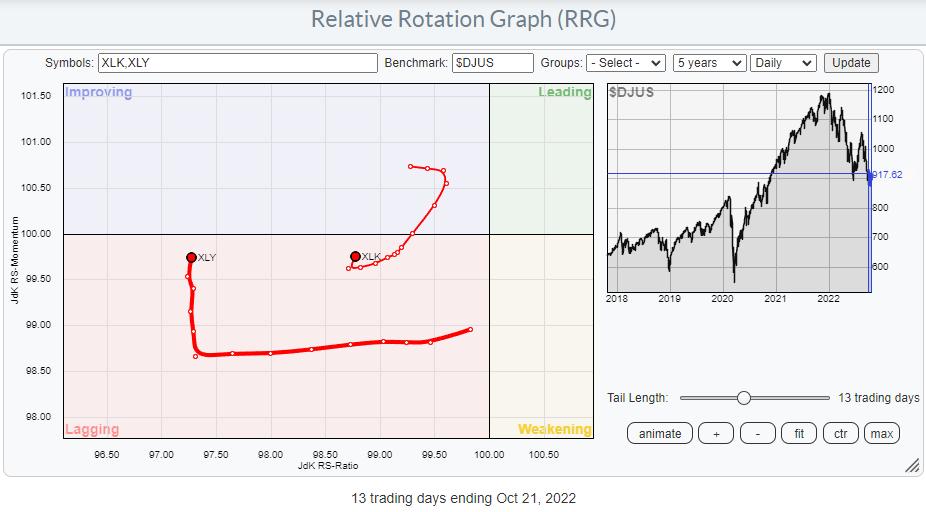
Even if we zoom in on the daily tails, things are not improving. Both sectors are in the lagging quadrant and, despite the small increase in relative momentum, we cannot say these are strong tails that will help the market to push higher at the moment.
Adding It All UP
So when we add up all the pieces of evidence, we have to conclude that things are not aligning. At least this should make you keep an open mind to the possibility that the decline is not over yet. Is it a tradable move to the upside? It depends on your investment horizon, as always. For shorter-term traders and swing traders with solid money management in place, some good trading opportunities can be found. Are you on a longer time frame? I would still be very cautious until sector rotation comes back in line with the main trend in SPY.
--Julius
Julius de Kempenaer
Senior Technical Analyst, StockCharts.com
Creator, Relative Rotation Graphs
Founder, RRG Research
Host of: Sector Spotlight
Please find my handles for social media channels under the Bio below.
Feedback, comments or questions are welcome at Juliusdk@stockcharts.com. I cannot promise to respond to each and every message, but I will certainly read them and, where reasonably possible, use the feedback and comments or answer questions.
To discuss RRG with me on S.C.A.N., tag me using the handle Julius_RRG.
RRG, Relative Rotation Graphs, JdK RS-Ratio, and JdK RS-Momentum are registered trademarks of RRG Research.


