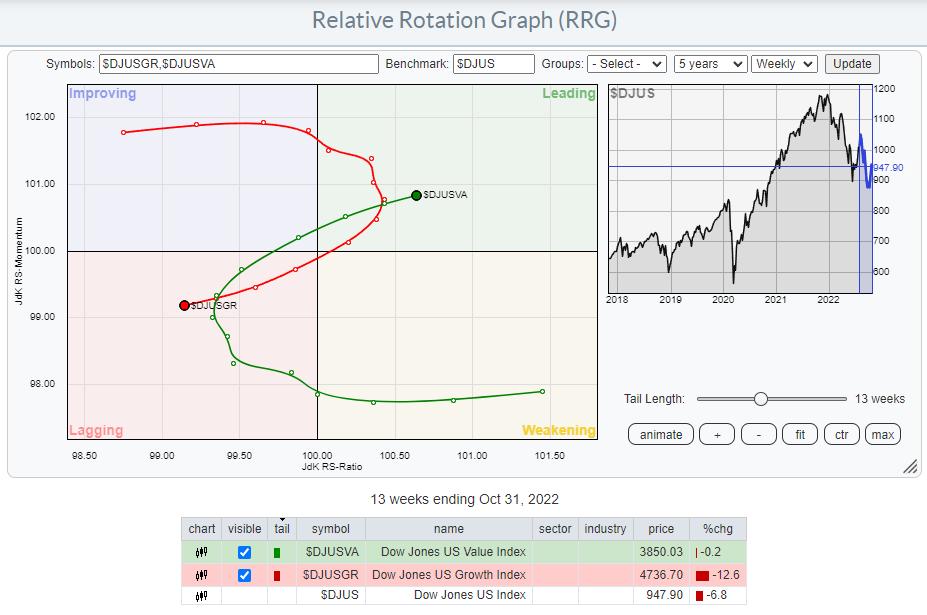
Over the last 13 weeks, a notable shift from growth to value stocks has taken place. After a rotation from leading, through weakening, into lagging between April and mid-October, the tail for value stocks has re-entered the leading quadrant at a strong RRG-Heading.
Generally, value stocks are seen as more defensive in nature than their growth counterparts. Looking back in history, it is not absolutely necessary for growth stocks to lead for the S&P 500 to rise, but it certainly helps.
In this week's episode of Sector Spotlight, I am addressing the long-term trends in asset classes and sectors. Without giving away all observations, I think that the most important takeaway from that exercise is that the trends (long-term) as they are visible and unfolding on these monthly graphs, are predominantly moving down.
Adding the observation that value stocks are taking over from growth again at the moment makes it hard for me to become overly bullish on the market as a whole at this stage. The near-term trend in the S&P is certainly pointing higher, and I think there is still some upside left. However, we will inevitably hit some pretty strong overhead resistance levels in both individual sectors and the index itself. The behavior of the market around these levels will be crucial for the longer-term outlook.
I also used monthly Relative Rotation Graphs in Sector Spotlight to visualize these long-term trends. The monthly time frame is a new feature on RRG and was recently added together with the intraday time frames.
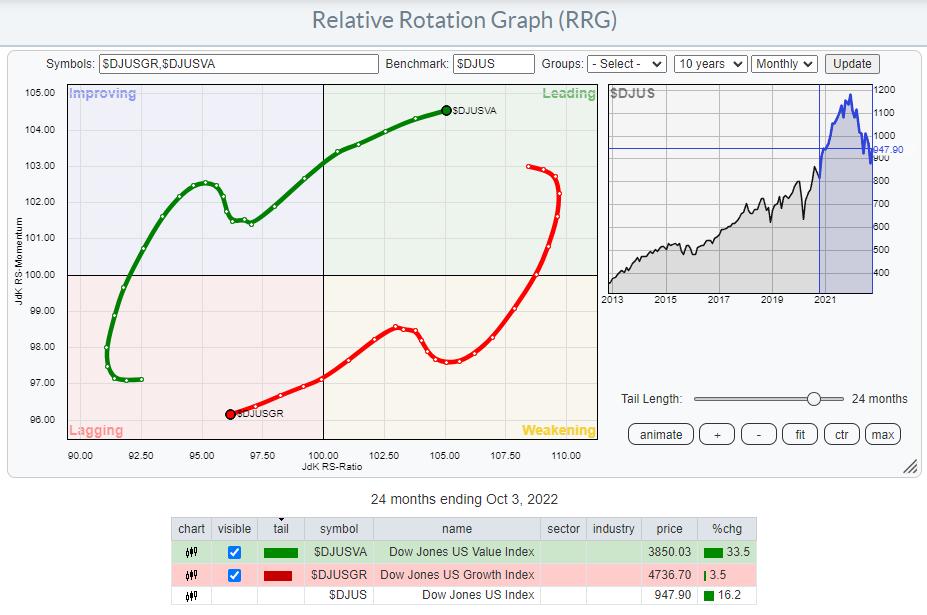
The RRG above shows 24 months of rotation between growth- and value stocks. After the mild hiccup in favor of growth from Oct-21 to Feb-22, the growth tail continues to move lower at a negative RRG-Heading, while Value is moving in the opposite direction.
An interesting picture emerges when I bring this relationship to a standard graph.
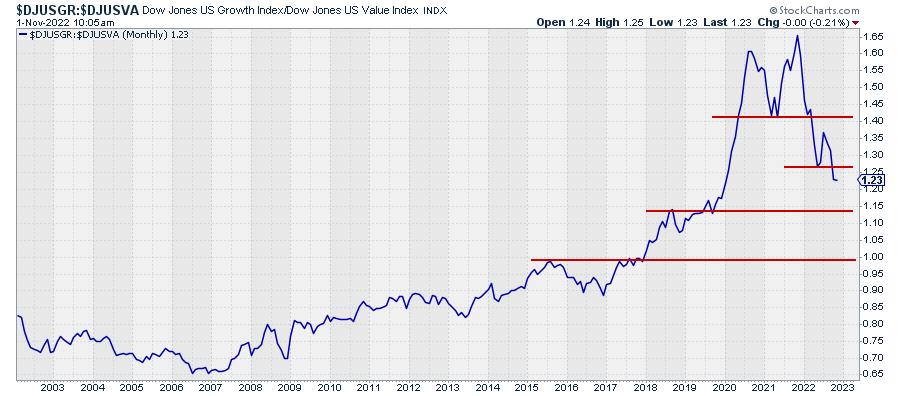
Here is the monthly version of that relationship. The rhythm of lower highs and lower lows that emerged out of the 2021 peak is visible and confirmed by the break below the May low.
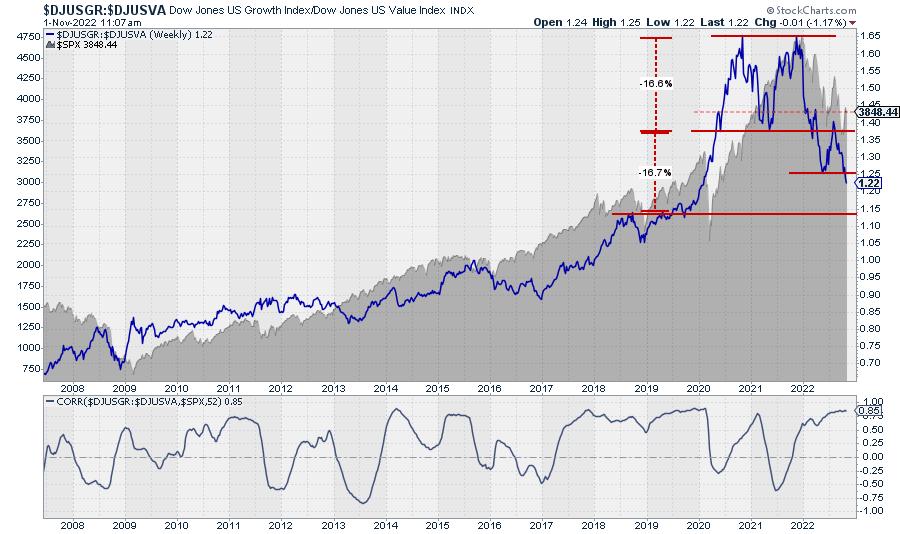
The weekly version offers more detail and shows an almost perfect double-top formation, with the two peaks aligning at 1.657 and 1.658 (WOW!!). The break of the low in between these two peaks is a little less clear, with one pull-back attempt reaching back to 1.4, but the subsequent move lower, now confirmed by the break of the previous low, that double top formation is now judged as valid. Based on the height of the formation, roughly 16.6%, we can now project the target for the current move to reach the area around 1.15 (minimum). Or in other words, back to the levels seen in 2018 and 2019 before this ratio accelerated higher.
The $SPX chart is plotted in the background as a reference. Be careful. The correlation between this ratio and the S&P 500 is generally high, currently 0.85 for a 52-week period, but it can definitely also go through periods of low or negative correlation.
Together with the continuing inversion of the yield curve, this is another long-term chart that I keep watching closely to monitor overall market conditions.
#StaySafe, --Julius
Julius de Kempenaer
Senior Technical Analyst, StockCharts.com
Creator, Relative Rotation Graphs
Founder, RRG Research
Host of: Sector Spotlight
Please find my handles for social media channels under the Bio below.
Feedback, comments or questions are welcome at Juliusdk@stockcharts.com. I cannot promise to respond to each and every message, but I will certainly read them and, where reasonably possible, use the feedback and comments or answer questions.
To discuss RRG with me on S.C.A.N., tag me using the handle Julius_RRG.
RRG, Relative Rotation Graphs, JdK RS-Ratio, and JdK RS-Momentum are registered trademarks of RRG Research.


