After a 50% decline, you need to make a 100% return to break even.
That is precisely what happened to the Communication Services sector. In August 2021, the Communications Services Select Sector SPDR fund (XLC) peaked at 85 and, from that point onward, started a disastrous decline, bringing its price back to 45, almost 50% lower. To get back to 85, the sector needs a 100% return from its lowest point.
With that perspective, the recent 20% gain is only a small beginning. The good news is that you are not buying at the highest point and that there is plenty of upside potential looking at where this sector used to trade.
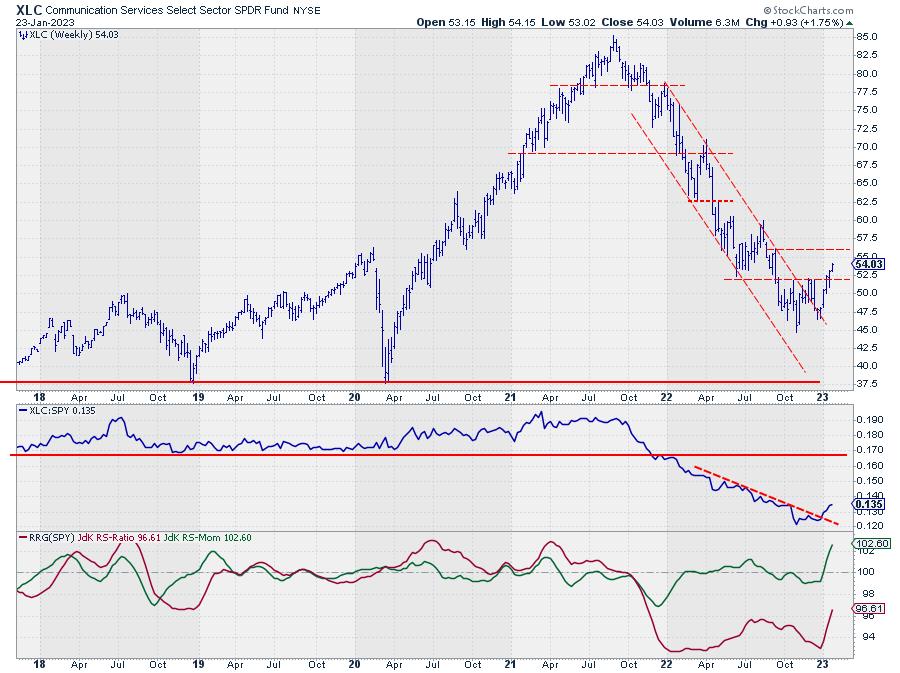
The chart above shows the very regular rhythm of lower highs and lower lows that took XLC all the way down to 45 while moving in a declining parallel channel. Such "high quality" downtrends are not seen very often.
The first rally out of the recent low stalled against the level of the previous low, around 52. Old support acting as resistance. The brief correction put in the first higher low, and last week XLC managed to break that barrier convincingly and start a new series of higher and lower highs.
The first higher low is in place. We need to wait for the higher high, but given that we are already trading above the previous high, it guarantees that it will be higher.
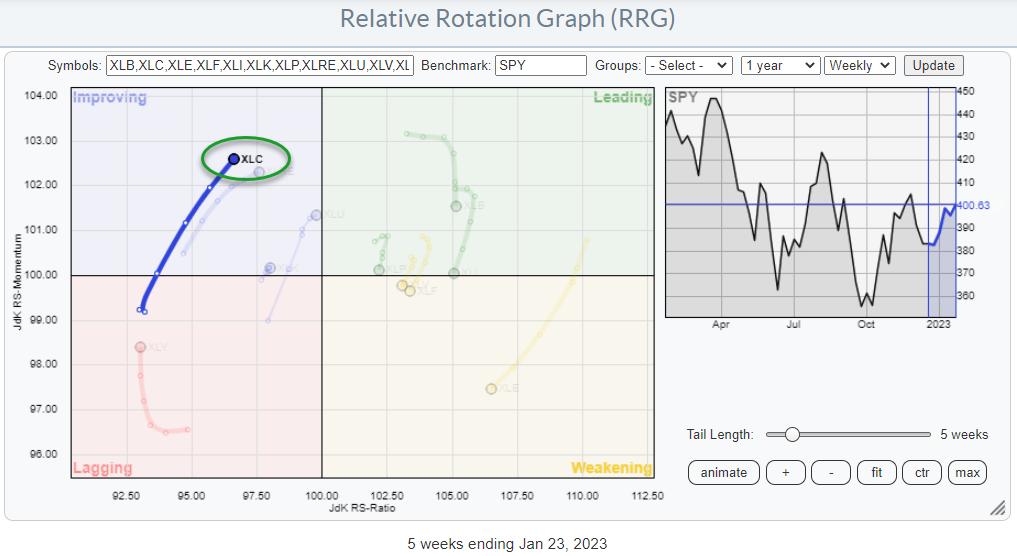
Along the way, there will be resistance levels that need to be taken out, but together with the upward break in relative strength and the rotation through the improving quadrant at a strong RRG-Heading make, communication services an interesting sector in the coming weeks.
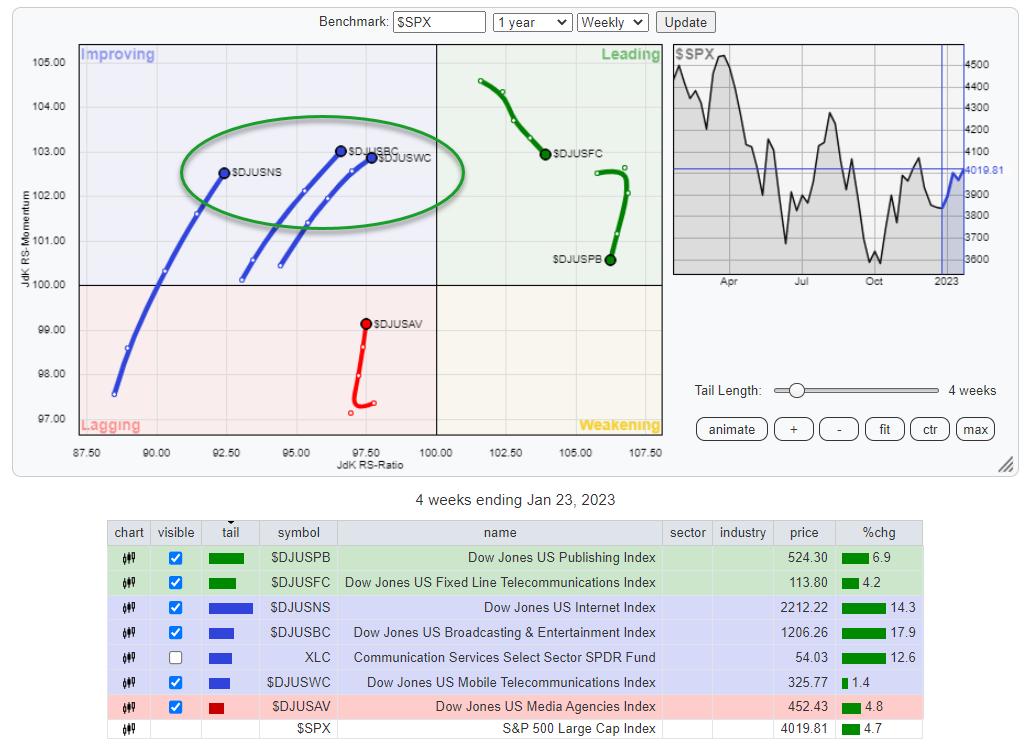
When we break down the communication services sector into its industries, we can see that Publishing and Fixed line telecom are inside the leading quadrant but losing relative momentum, which causes the tails to roll over.
The three sectors improving and traveling at a positive RRG-heading look more promising. These are Internet, Broadcasting and Entertainment, and Mobile Telecom.
Going over the individual holdings of the sector sorted by industry, I ran into two interesting charts.
Walt Disney
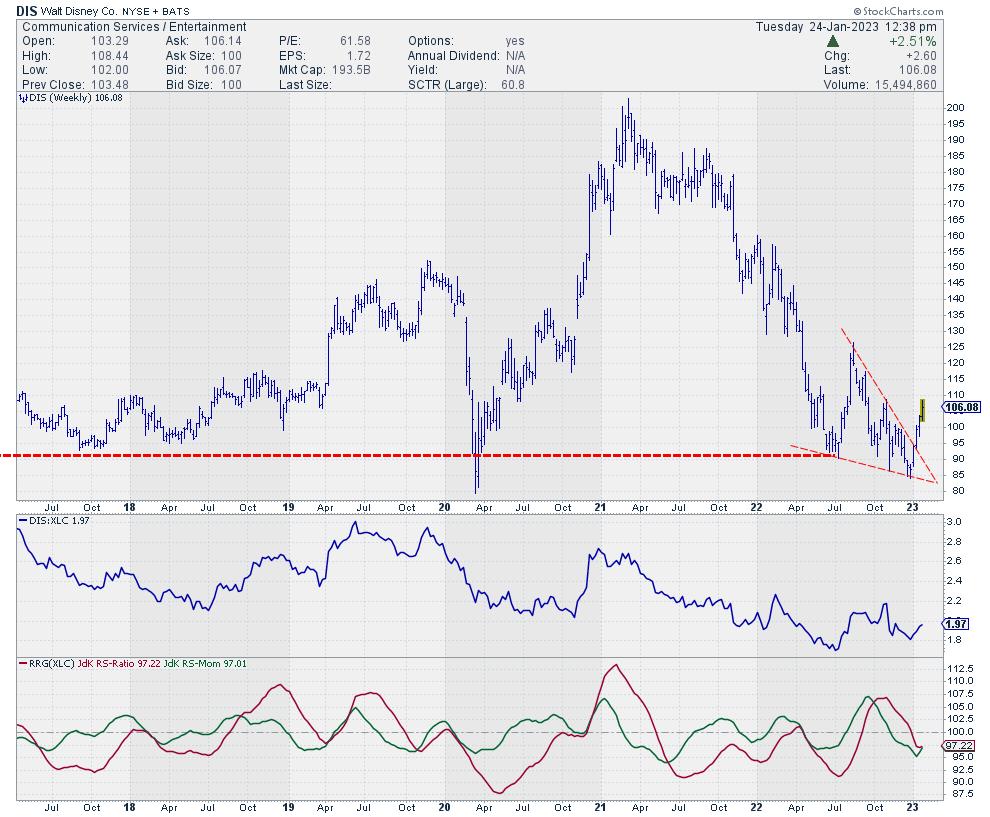
On the RRG against XLC, DIS is still inside the lagging quadrant, but its tail has just started to curl up.
What caught my eye is the large falling wedge at the end of that long downtrend going back to the start of 2021. Additional confidence comes from the fact that the wedge came to rest in the area around 90, which also played a role as support in 2017 and 2020.
So what we have here is a large reversal formation, the falling wedge, at the end of a long downtrend, in an important support area. At the same time, relative strength against the sector is improving.
This does not seem to be a bad place to start looking for more upside in DIS
Warner Bros Discovery
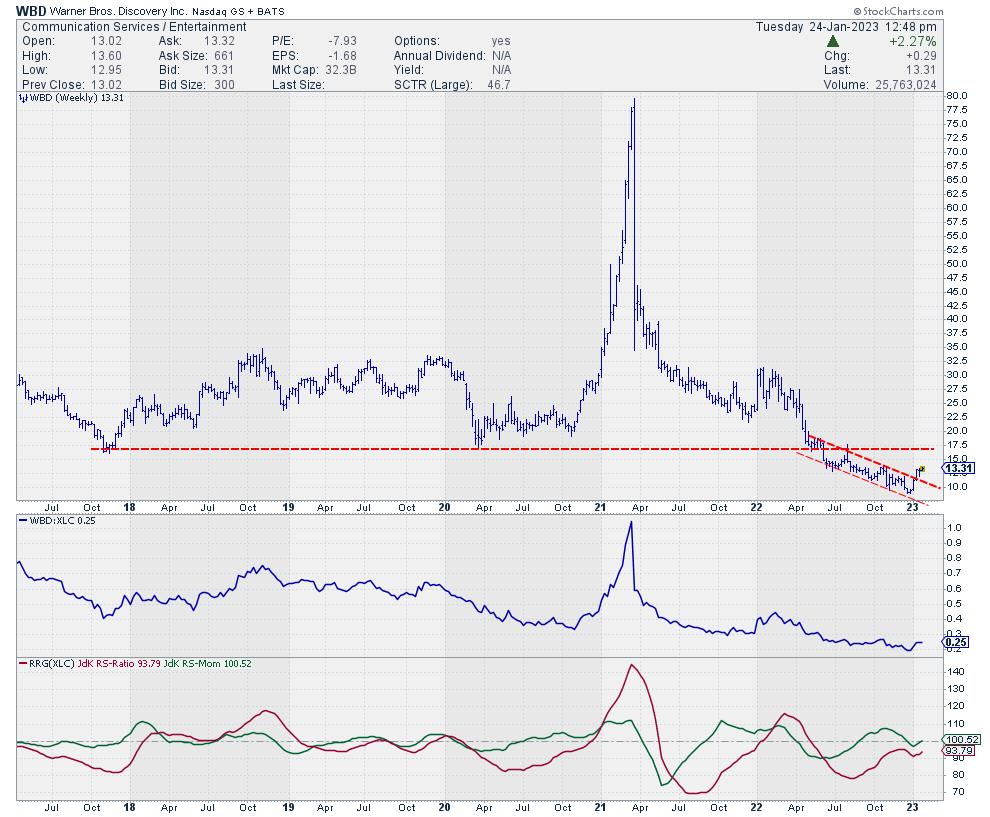
The second chart spurred my interest in WBD. Coming from a high near 80 at the start of 2021, its price dipped below ten at the end of 2022. Out of its most recent low, a new rally emerged, which managed to break the falling resistance line, which marked the upper boundary of the channel that was in play since June.
So far, that move is shaping up nicely while relative strength is improving.
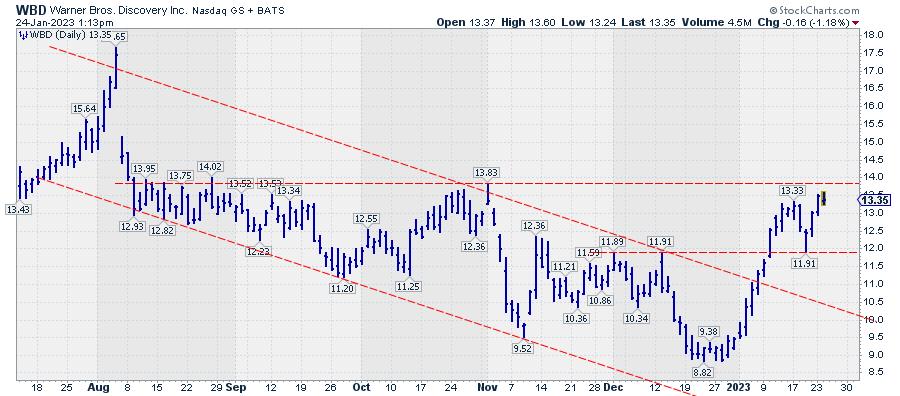
The zoomed-in daily chart shows this in more detail. The first pullback has held above previous highs, setting the stage for new higher lows. Currently, WBD is pushing to get above last week's high and will soon face more serious resistance just below 14.
Once WBD can clear these levels much more upside will be unlocked making it one of the more interesting stocks in the Broadcasting and Entertainment Industry.
#StayAlert --Julius
Julius de Kempenaer
Senior Technical Analyst, StockCharts.com
Creator, Relative Rotation Graphs
Founder, RRG Research
Host of: Sector Spotlight
Please find my handles for social media channels under the Bio below.
Feedback, comments or questions are welcome at Juliusdk@stockcharts.com. I cannot promise to respond to each and every message, but I will certainly read them and, where reasonably possible, use the feedback and comments or answer questions.
To discuss RRG with me on S.C.A.N., tag me using the handle Julius_RRG.
RRG, Relative Rotation Graphs, JdK RS-Ratio, and JdK RS-Momentum are registered trademarks of RRG Research.


