TAKEAWAYS
- Strong Sector Rotation Out Of Technology
- Financials and Real Estate Lead
- Stock/Bond Ratio Triggers Sell Signal
Flying Financials
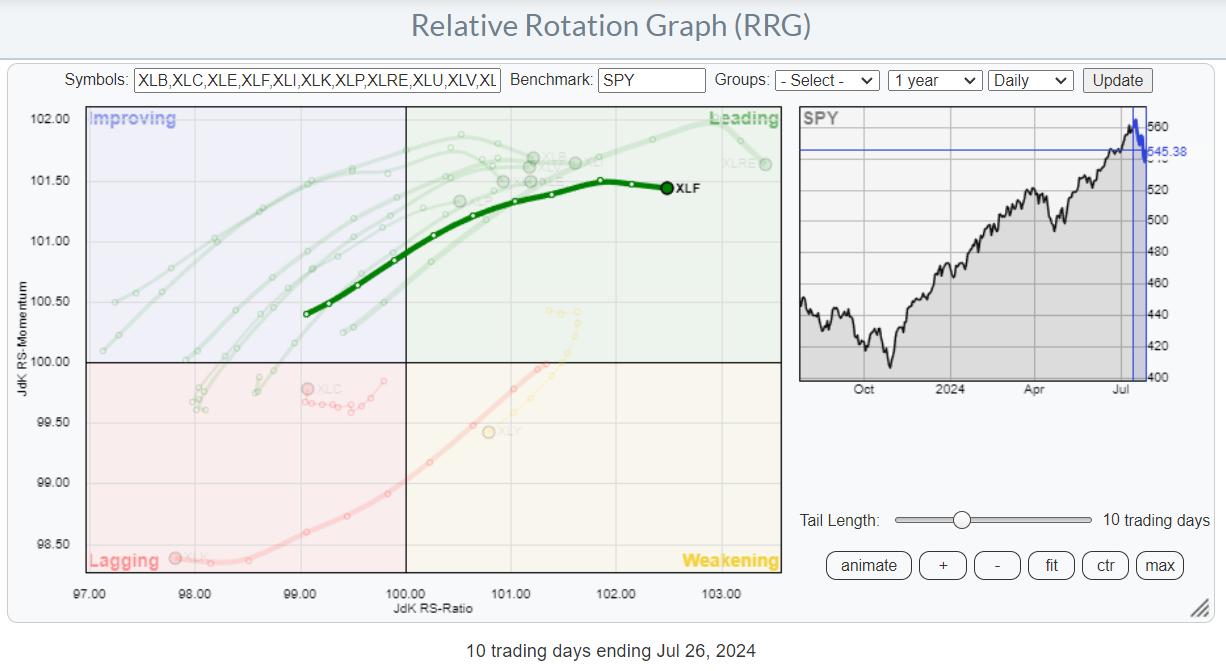
In the recent sector rotation, basically OUT of technology and INTO anything else, Financials and Real-Estate led the relative move.
On the RRG above, I have highlighted the (daily) tail for XLF to show how it stands out from the other sectors.
On the weekly RRG, XLF is still positioned inside the lagging quadrant but has started to curl back up on the back of the recent strength.
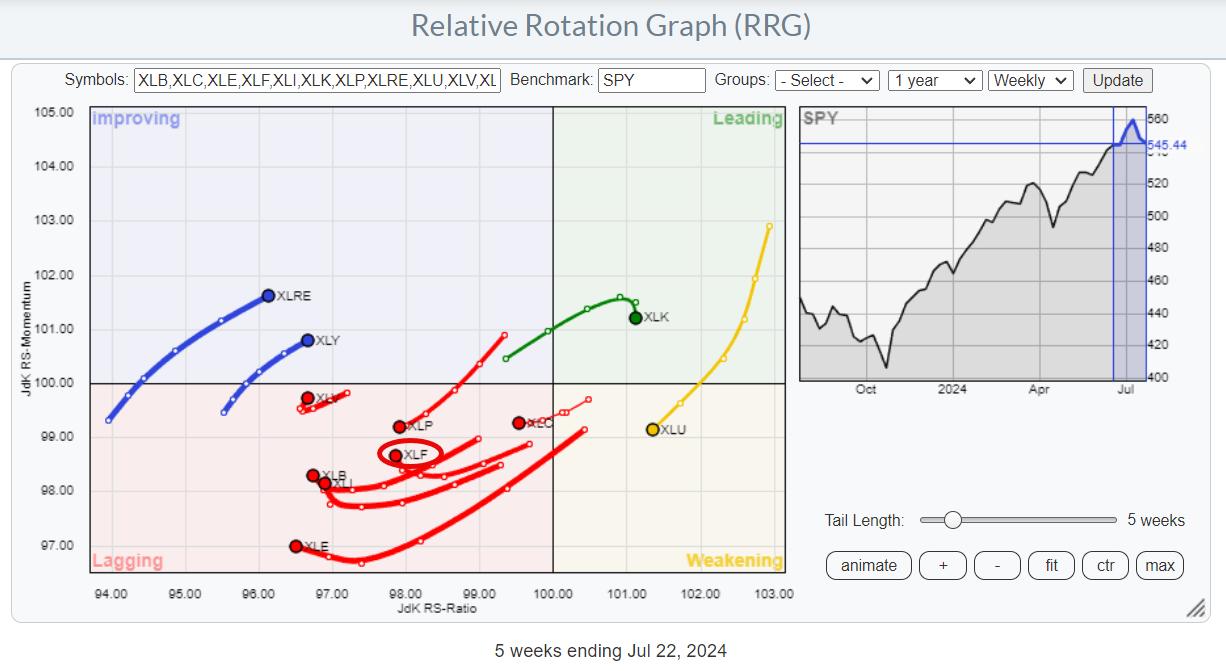
The start of the rotation out of Technology translates into a tail for XLK, which has started to roll over inside the leading quadrant. With increased weakness for Technology, Communication Services, and Consumer Discretionary showing on the daily RRG, it now becomes a balancing act to match this rotation with the one seen on the weekly RRG.
Technology Still Carries a Lot of Weight
Let's start at the top, the weekly time frame. Technology is still inside the leading quadrant and has just started to roll over. There is nothing unusual or alarming from this rotation on its own. What is unusual, and at least a bit worrisome, is the high concentration of tails on the opposite side inside the lagging quadrant. This image tells the story of narrow breadth, which I have mentioned in articles and blogs.
Information Technology, on this weekly RRG, still carries the weight of the entire market.
On the daily RRG, the situation is the exact opposite. XLK has rapidly rotated into the lagging quadrant. XLY is inside weakening and heading for lagging, while XLC is on a very short tail inside, lagging with this week's node picking up relative momentum. ALL other sectors have rotated into the leading quadrant at long tails led by Financials and Real Estate.
This raises the question: Is the strong rotation on the daily RRG the start of a bigger rotation, which will drag XLK out of the leading quadrant on the weekly RRG, and will this benefit the other sectors? Or is this rotation on the daily RRG just an intermezzo, and will the rotations that have started on the weekly RRG be completed on their respective sides of the chart and maintain their long-term relative trends?
Rotation To Other Sectors or Out of the Market?
From the RRGs alone, I feel that Technology has become top-heavy and needs a break. Money has started to rotate out of the sector, which is likely not over yet. With the market capitalization remaining so split between tech and anything else, it is very well possible that the other sectors will now take over and help $SPX stay afloat. In that case, we will see broader participation, with all sectors minus tech, but still a market under pressure.
But this only works when the money remains in the stock market, i.e., true sector rotation. It's a different story when money starts to move out of the market ($SPX).
Stocks vs. Bonds Tell a Story
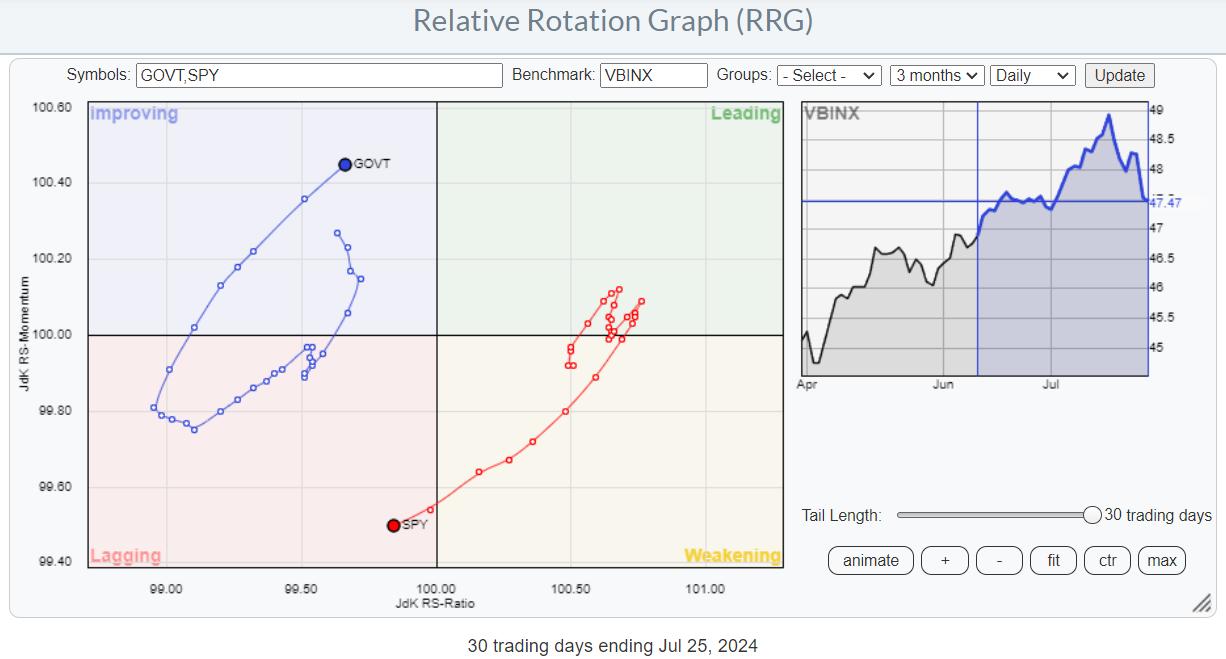
When I compare stocks and bonds, we see a clear rotation out of stocks (SPY) into bonds (GOVT) in the daily time frame.
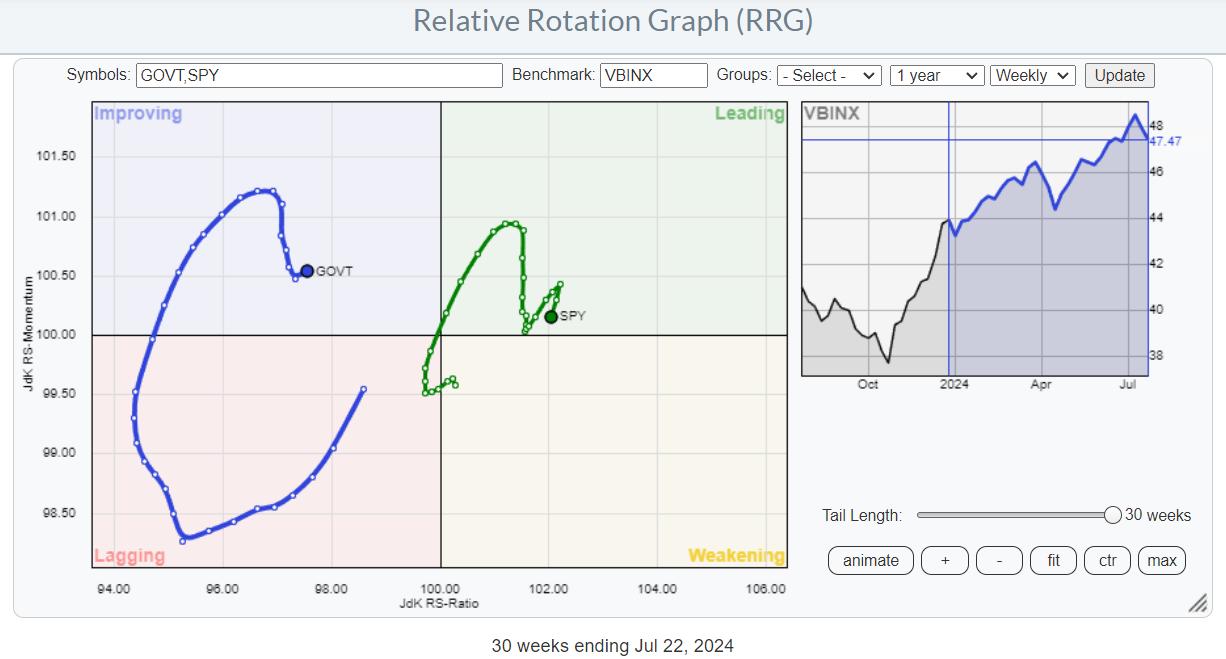
Here, the weekly picture is also not as pronounced, but the first cracks are visible.
On the straight 1-1 comparison between SPY and IEF, we get a bit more clarity.
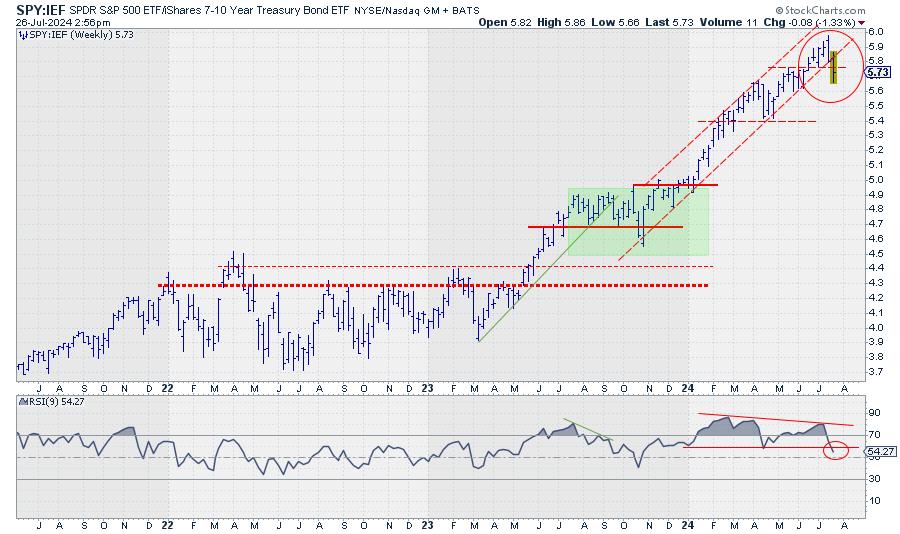
This week (one more hour of trading to go), the SPY:IEF ratio is breaking down from its rising channel, which has been in place since October 2023. It is breaking the rising support line and the previous low (double support), while the negative divergence between price and RSI is now executing/triggering with a break below the previous low in the RSI.
So, all in all, it leads me to believe that we are facing, at least, a few weeks of sideways to lower movement for the S&P 500.
To maintain the long-term uptrend, the market must catch the outflow from large-cap growth/Technology stocks and regroup during this period. Preferably, it should build a stronger base in terms of the number of sectors and stocks that contribute to a renewed or continued rally in the S&P 500.
For now, caution and careful money management are key.
#StayAlert and have a great weekend. --Julius
Julius de Kempenaer
Senior Technical Analyst, StockCharts.com
Creator, Relative Rotation Graphs
Founder, RRG Research
Host of: Sector Spotlight
Please find my handles for social media channels under the Bio below.
Feedback, comments or questions are welcome at Juliusdk@stockcharts.com. I cannot promise to respond to each and every message, but I will certainly read them and, where reasonably possible, use the feedback and comments or answer questions.
To discuss RRG with me on S.C.A.N., tag me using the handle Julius_RRG.
RRG, Relative Rotation Graphs, JdK RS-Ratio, and JdK RS-Momentum are registered trademarks of RRG Research.


