
The Right Indicator Combinations Are Key To Strong Trading Results. In my analysis of the stock market, I like to put together indicators that provide a multi-faceted view of what is going on within the price movement of stocks, indexes, and ETFs. I always try to combine indicators so that all 3 pieces of market data are analyzed which are volume, price, and time.
One of the indicator combinations I teach is Bollinger Bands in a line oscillator form alongside the volume oscillator, which is Time Segmented Volume TSV. This is a great combination of indicators to use in the study of trade potential.
It is a combination of 2 primary indicators rather than the typical primary with a subordinate indicator, a more common method of combination indicators. The study of a Price Oscillator with a Volume Oscillator provides an analysis of all 3 pieces of data and a new perspective on the relationship between volume and price.
Since the most important market participants are the giant institutions who use Dark Pools to transact their trades in the market, it is imperative that volume is included in the analysis of any trading instruments whenever possible.
What we want to see with the combination of %B and TSV is harmony between price and volume. This helps expose the incremental yet steady buying patterns of quiet accumulation, see the chart below.
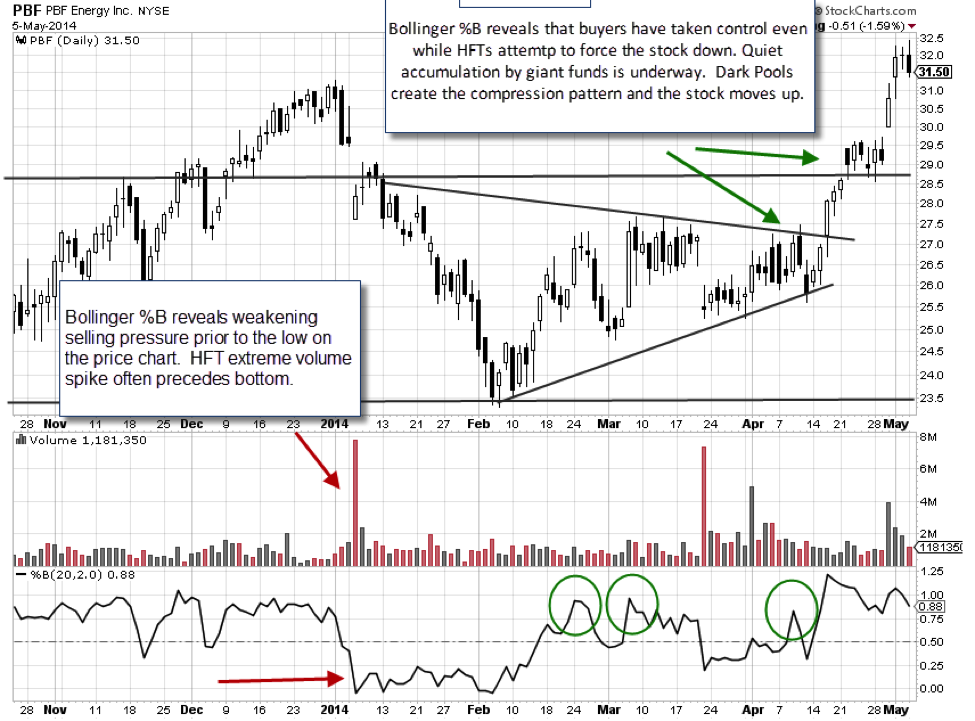
The High Frequency Traders HFTs are constantly trying to find the Dark Pool quiet accumulation occurring in stocks, so you’ll often find their extreme patterns following periods of steady incremental buying. The key to capitalizing on HFT price movement is to recognize these quiet accumulation periods by studying the volume to price relationships. This gives traders a huge advantage to get in earlier, before the HFTs move price suddenly.
This volume to price analysis is part of what we at TechniTrader call Relational Analysis a large part of which relates the buying habits of the market participants, to technical analysis through the study of a leading set of indicators and candlestick patterns.
Bollinger Bands %B is a good replacement for standard Bollinger Bands on price when they lose their leading edge as the momentum action of the HFTs sets in. It is an especially useful tool in momentum stocks. Add a volume oscillator like Time Segmented Volume TSV and you have a match made in heaven.
There is a ton of information that can be gleaned from this easy combination of indicators using a relational approach to the study of stocks, indexes, and ETFs. Here are some examples:
• Harmonic versus disharmonic patterns to determine follow through of the price action.
• Overbought/oversold analysis with the high and low range of %B.
• Center line delineation between accumulation and distribution, and volume sensitivity with TSV.
Using a volume oscillator indicator along with the %B price oscillator rounds out the analysis to give leading signals, so long as you understand the effect that the largest players in the market have on price and volume patterns.
Trade Wisely,
Martha Stokes CMT
www.TechniTrader.com
info@technitrader.com