
Volume has become a far more important indicator for technical traders as more orders are executed off the regular exchanges in Dark Pool Alternative Transaction Systems and with High Frequency Trading, HFT, dominating price action on the exchanges.
Volume exhaustion patterns are a key element in determining when a stock is starting a bottom formation even before the stock price reaches its final low. Often times, HFTs drive price down right into the prior “buy zone” of the Dark Pools without anyone being aware of it.
Since Dark Pools are also automated orders that trigger when specific price points are met along with time-oriented accumulation programs that fire off systematic orders automatically so long as there is sufficient liquidity, HFTs frequently are selling a stock down and enter buy zones accidentally, which triggers the automated orders of the Dark Pools.
In these instances, volume can spike into an exhaustion volume pattern quickly and within days, the stock starts a bottom as the giant-lot orders of the Dark Pools overwhelm the HFT orders. Smaller funds and retail traders, who typically chase HFT volume, are often accidentally in the way of these two powerful market participant groups, each trading completely differently.
The chart of Stamps.com is an excellent example of why volume, quantity, and accumulation/distribution indicators are so critical to stock analysis in today’s market. Price used to be the most important indicator, but nowadays, with automated orders, numerous transaction venues, and more types of orders, price and quantity must be studied and analyzed in combination. Hybrid indicators are the best for today’s marketplace.
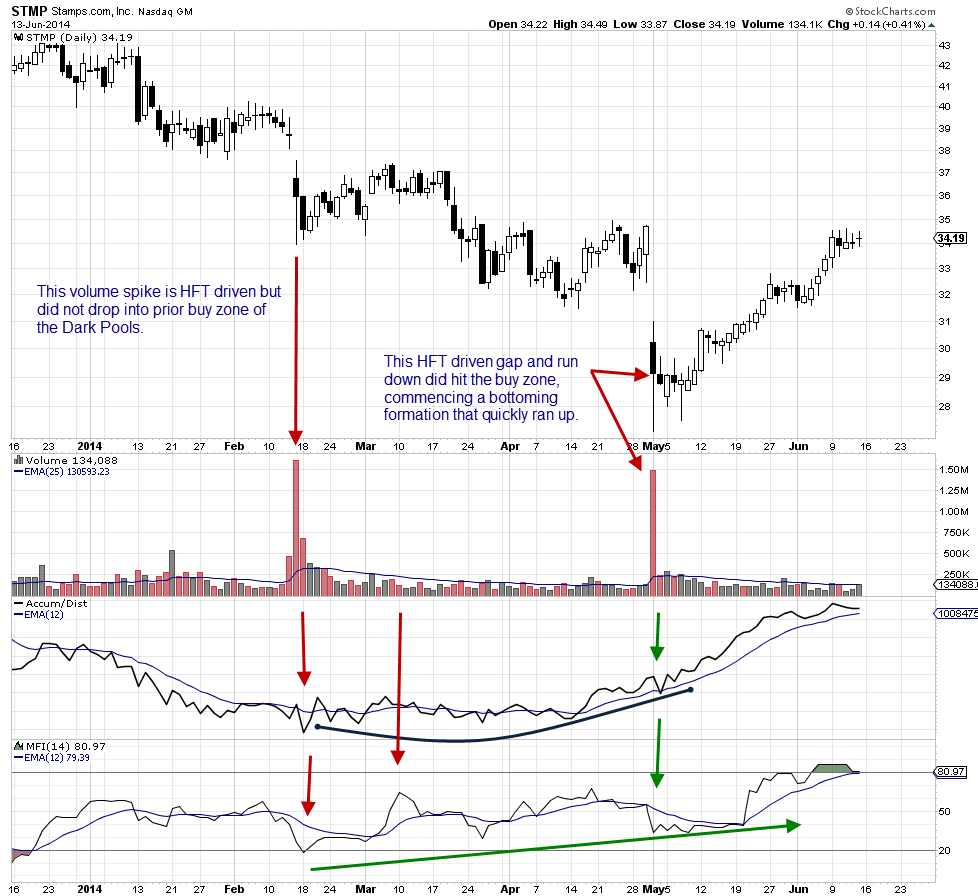
There are 2 instances of a huge spike in downside volume in the STMP chart below. The candles on both days are very similar.
1. Both candles are indecision day candles with longer tails than wicks and longer bodies than normal for reversal patterns.
2. Both occurred on a gap down open.
3. Both were followed by a few days of sideways action before the trend resumed.
Volume has become a far more important indicator for technical traders as more orders are executed off the regular exchanges in Dark Pool Alternative Transaction Systems and with High Frequency Trading, HFT, dominating price action on the exchanges.
Volume exhaustion patterns are a key element in determining when a stock is starting a bottom formation even before the stock price reaches its final low. Often times, HFTs drive price down right into the prior “buy zone” of the Dark Pools without anyone being aware of it.
Since Dark Pools are also automated orders that trigger when specific price points are met along with time-oriented accumulation programs that fire off systematic orders automatically so long as there is sufficient liquidity, HFTs frequently are selling a stock down and enter buy zones accidentally, which triggers the automated orders of the Dark Pools.
In these instances, volume can spike into an exhaustion volume pattern quickly and within days, the stock starts a bottom as the giant-lot orders of the Dark Pools overwhelm the HFT orders. Smaller funds and retail traders, who typically chase HFT volume, are often accidentally in the way of these two powerful market participant groups, each trading completely differently.
The chart of Stamps.com is an excellent example of why volume, quantity, and accumulation/distribution indicators are so critical to stock analysis in today’s market. Price used to be the most important indicator, but nowadays, with automated orders, numerous transaction venues, and more types of orders, price and quantity must be studied and analyzed in combination. Hybrid indicators are the best for today’s marketplace.
There are 2 instances of a huge spike in downside volume in the STMP chart below. The candles on both days are very similar.
1. Both candles are indecision day candles with longer tails than wicks and longer bodies than normal for reversal patterns.
2. Both occurred on a gap down open.
3. Both were followed by a few days of sideways action before the trend resumed..
However, upon closer examination of the volume, the first big volume spike was preceded by a higher volume day to the downside than in many weeks, and the day after that huge spike in volume was also much higher than normal.
The second gap-down indecision day candle with spiking volume has lower volume preceding and following the spike. What often confuses technical traders is they imagine that Dark Pools must show huge volume. The opposite is true. Because Dark Pools are buying in incrementally over many days or weeks, they are able to spread out their quantity of shares purchased over an extended period of time. This means that Dark Pools do not move price, nor do they create huge volume spikes. Huge price and volume action is the footprint of HFTs, not Dark Pools who are predominantly huge mutual fund companies and pension funds.
Summary:
Learning to see volume as an important element of technical analysis is often a new concept for many technical traders, especially those who learned to read stock charts during the bar chart era, or who learned that price was the most important indicator more than a decade ago.
Today, ignoring volume is one of the more common mistakes technical traders make. By not giving volume its due merit in helping to reveal who controls price at any given time, determining how price will behave in the near term becomes opaque and often frustrating.
Using volume and quantity indicators, especially the new hybrids written for the automated market, make analysis far easier and much more reliable. Reliable entries require a full analysis of ALL of the data, not just price and time. Quantity added to any stock analysis makes a substantial difference in eliminating weaker trades that cause whispaws and losses.
Trade Wisely,
Martha Stokes CMT
www.TechniTrader.com
info@technitrader.com